

1. Introduction
There are two undisputable facts concerning data collection in the field of generative syntax: (i) Acceptability judgments form a substantial component of the empirical foundation of generative syntax (Chomsky Reference Chomsky1965, Schütze Reference Schütze1996), and (ii) the vast majority of the acceptability judgments that have been reported in the generative syntax literature over the past 50 years were collected informally, that is, without either the use of formal data collection protocols, nor scrutiny via the statistical analysis techniques that are familiar from experimental psychology. The informality with which acceptability judgments are traditionally collected has led to a steady stream of methodological criticisms since the earliest days of generative syntax (e.g., Hill Reference Hill1961, Spencer Reference Spencer1973), culminating in a particularly dramatic increase in methodological discussions over the past 15 years, presumably due to the relative ease with which formal acceptability judgment can be constructed, deployed, and analyzed using freely available software and internet-based participant pools (Bard, Robertson & Sorace 1996; Keller Reference Keller2000, Reference Keller, Alterman and Kirsh2003; Edelman & Christiansen Reference Edelman and Christiansen2003; Phillips & Lasnik Reference Phillips and Lasnik2003; Featherston Reference Featherston2005a, Reference Featherstonb, Reference Featherston2007, Reference Featherston, Riehl and Rothe2008, Reference Featherston2009; Ferreira Reference Ferreira2005; Sorace & Keller Reference Sorace and Keller2005; Wasow & Arnold Reference Wasow and Arnold2005; Alexopoulou & Keller Reference Alexopoulou and Keller2007; den Dikken, Bernstein, Tortora & Zanuttini Reference den Dikken, Bernstein, Tortora and Zanuttini2007; Fanselow Reference Fanselow2007; Newmeyer Reference Newmeyer2007; Sprouse Reference Sprouse2007a, Reference Sprouseb, Reference Sprouse2008, Reference Sprouse2009, Reference Sprouse2011a, Reference Sprouseb; Culbertson & Gross Reference Culbertson and Gross2009; Myers Reference Myers2009; Phillips Reference Phillips, Iwasaki, Hoji, Clancy and Sohn2009; Bader & Häussler Reference Bader and Häussler2010; Culicover & Jackendoff Reference Culicover and Jackendoff2010; Dąbrowska Reference Dąbrowska2010; Fedorenko & Gibson Reference Gibson and Fedorenko2010; Gibson & Fedorenko Reference Gibson and Fedorenko2010, Reference Gibson and Fedorenkoin press; Gross & Culbertson Reference Gross and Culbertson2011; Weskott & Fanselow Reference Weskott and Fanselow2011; Sprouse & Almeida Reference Sprouse and Almeida2011, Reference Sprouse, Almeida, Grohmann and Boeckx2012; Sprouse, Fukuda, Ono & Kluender Reference Sprouse, Fukuda, Ono and Kluender2011; Sprouse, Schütze & Almeida Reference Sprouse, Schütze and Almeida2011; Sprouse, Wagers & Phillips Reference Sprouse, Almeida, Grohmann and Boeckx2012).
One oft-repeated claim in this literature is that traditional methods are somehow unreliable, resulting in the construction of ill-supported syntactic theories (e.g., Edelman & Christiansen Reference Edelman and Christiansen2003, Ferreira Reference Ferreira2005, Wasow & Arnold Reference Wasow and Arnold2005, Gibson & Fedorenko Reference Gibson and Fedorenko2010, Reference Gibson and Fedorenkoin press). Our goal in this paper is to address this claim empirically by testing all of the unique, US-English language data points found in a recent (and popular) generative syntax textbook (Core Syntax by David Adger, Reference Adger2003, Oxford University Press). Our hope is that by testing a large set of data points (469 sentence types forming 365 statistical comparisons) that cover a wide range of syntactic phenomena (nine distinct topic-oriented chapters) and form a comprehensive introduction to (generative) syntax we will be able to provide a relatively accurate estimate of the reliability of the data that is central to generative syntactic theory. Of course, the generalizability of this estimate depends entirely on how representative of the field one finds the textbook – a subjective issue that is likely to vary from researcher to researcher (see Section 8 for discussion). However, we believe that testing such a large set of data will provide a much better estimate of the reliability of syntactic data than the relatively small proof-of-concept studies that have been conducted to date (e.g., Wasow & Arnold Reference Wasow and Arnold2005, Gibson & Fedorenko Reference Gibson and Fedorenkoin press). These proof-of-concept studies typically suffer from both limited amounts of data (typically fewer than 10 sentence types) and biased selection of phenomena (they typically only report replication failures, not successful replications). We believe that the only way to truly address the question of whether there is an epidemic of unreliable data in syntactic theory is to compare the ratio of replication failures to successful replications for a large sample of phenomena.
2. Defining reliability
Although the word unreliable has an intuitive meaning to most readers, formally there are (at least) two types of unreliability that are relevant to the evaluation of an experiment. The first type of unreliability concerns false positives, which occur when an experiment reports a difference between two (or more) conditions, but no difference truly exists (false positives are also known as Type I errors). The second type of unreliability concerns false negatives, which occur when an experiment reports no difference between two (or more) conditions, but there is, in fact, a difference between the conditions (false negatives are also known as Type II errors). It is important to note that these two types of unreliability, though related, are not treated equally in the experimental psychology literature. False positives are generally considered more detrimental to scientific research than false negatives, primarily because of the assumption that scientific theories are constructed from differences between conditions (i.e., positive results), not invariances between conditions (i.e., negative results).Footnote 2 This asymmetry can be clearly seen in the statistical best practices of the field: whereas the criterion for inferring a positive result under null hypothesis testing is p<.05, which would result in a maximum 5% false positive rate if applied consistently (Nickerson Reference Nickerson2000), the suggested maximum false negative rate is four times higher – 20% (Cohen Reference Cohen1962, Reference Cohen1988, Reference Cohen1992). This suggests that, as a rule of thumb, experimental psychologists view false positives as four times more detrimental than false negatives (Cohen Reference Cohen1992). Though the definition of tolerable and intolerable false positive and false negative rates is ultimately subjective, in general we can say that an experimental protocol is reliable if it produces both a very low rate of false positives and a tolerable rate of false negatives.
With these definitions in place, we can see that there are in fact two types of criticisms that can be levied at traditional experimental methods in syntax:
1. Traditional methods are unreliable because they have an intolerably high false positive rate. The corollary of this is that formal experiments are more reliable because they have a lower false positive rate.
2. Traditional methods are unreliable because they have an intolerably high false negative rate. The corollary of this is that formal experiments are more reliable because they have a lower false negative rate.
Criticisms of traditional methods have primarily focused on false positives (Wasow & Arnold Reference Wasow and Arnold2005, Gibson & Fedorenko Reference Gibson and Fedorenkoin press), perhaps because of the aforementioned assumption in experimental psychology that false positives are more detrimental than false negatives. Because false positives have been the primary focus of many critics, we will focus almost exclusively on false positives in this article. However, it is important to note that it is possible that the consequences of false negatives on syntactic theory are greater than the consequences of false negatives on other psychological theories. Syntacticians often attempt to capture both differences between sentences and invariances between sentences in grammatical theories, such that false negatives may have an impact on theory construction that it is similar to that of false positives. Several researchers have investigated whether traditional methods lead to more false negatives than formal methods, at least for individual phenomena, by re-testing classic phenomena with formal experiments and looking for subtle patterns in the data that may have been overlooked by traditional methods (e.g., Bard et al. Reference Bard, Robertson and Sorace1996, Keller Reference Keller2000, Featherston 2005b, Alexopoulou & Keller Reference Alexopoulou and Keller2007, Sprouse, Fukuda, Ono & Kluender Reference Sprouse, Fukuda, Ono and Kluender2011). Taking a slightly different tack, Sprouse & Almeida (Reference Sprouse and Almeida2011) compared the false negatives/statistical power of two types of acceptability judgment experiments, magnitude estimation and forced-choice, for 95 phenomena that span the range of possible effect sizes in syntax and found evidence that suggests that traditional acceptability judgment experiments may in fact be more powerful at detecting differences between sentence types than formal experiments, contrary to common assumptions. Clearly both false positives and false negatives have a role to play in assessing the reliability of data in syntax; nonetheless, for the current article, we will focus primarily on false positives, and refer interested readers to the above-mentioned references for a fuller discussion of false negatives.
In the sections that follow, we will compare the traditionally collected judgments reported in Adger (Reference Adger2003) to the results of two formal acceptability judgment experiments in an attempt to estimate the false positive rate in this data set. At this point, the problem with this comparison should be clear: to determine the false positive rate, we need a list of the true positives, but all we have are the results of two types of experiments (traditional, informal experiments and formal experiments), each of which are susceptible to both false positives and false negatives. To get around this, we will evaluate these results in a two-step process. First, we will simply assume that the results of the formal experiments reveal all and only true positives. This is very much in line with the assumptions of many critics of traditional methods, therefore it will allow us to evaluate their concerns on their own terms. Because the negative results of the formal experiments are either true negatives or false negatives, the replication rate derived from comparing the Adger (Reference Adger2003) results to the formal results is the minimum replication rate for this particular data set (i.e., the replication rate could be higher than this number, but it cannot be lower). Then we will take a closer look at the phenomena that did not replicate in the formal experiment (i.e., the negative results) to better determine whether they are likely true negatives, which means that they were false positives in Adger (Reference Adger2003), or whether they are likely false negatives, which means that they were true positives in Adger (Reference Adger2003) . Although we can offer no definitive conclusions about the status of the negative results from the formal experiments, we believe the discussion will help readers to refine the replication estimate for this particular data set for themselves.
3. The data points in Adger (Reference Adger2003)
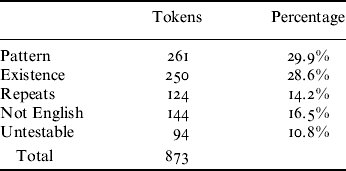
The procedure for identifying the data points in Adger (Reference Adger2003) was as follows: First, all examples that were obviously not data points (syntactic trees, terminological definitions, etc.) were excluded. This yielded 873 data-like examples, which were sorted into the following categories:
Pattern: These are sentences that are reported as part of a group of two or more sentence types that form a pattern of acceptability as is standard in generative syntax. A pattern always included at least one starred example and one un-starred example.
Existence: These are sentences that were used to demonstrate the existence or inexistence of a given construction in English.
Repeats: As a textbook, some sentences are repeated for expository or pedagogical reasons.
Not English: These are examples that are non-English. We included non-US and non-standard dialects of English (as defined by Adger) in this category because the participant population in our experiments was native US-English speakers.
Untestable: These are sentences that required a task different from acceptability judgment. For example, some data in syntax is based on the availability or unavailability of specific interpretations or readings of a potentially ambiguous string of words. These cannot be tested using a standard judgment survey.
The distribution of data-like examples in Adger (Reference Adger2003) is given in Table 1. Though we attempted to apply the above criteria consistently throughout the entire textbook, it is possible that some readers may disagree with a few of the classifications. Nonetheless, we believe that the classification in Table 1 is by-and-large correct.
The distribution of data-like examples in Adger (Reference Adger2003) .
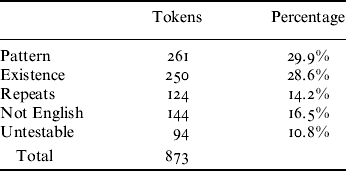
The 261 tokens that were categorized as pattern examples represented 198 distinct sentence types (i.e., there were 63 structural repeats). Twenty-one of those sentence types were presented without an explicit control condition, though the intended control condition was described in the text (e.g., by discussing the grammatical operation that led to the unacceptability). Therefore we constructed 21 additional sentence types to serve as the grammatical control conditions for these sentence types. The resulting 219 sentence types (198+21) served as the conditions of the magnitude experiments (ME) described in Section 5 below. We chose magnitude estimation to test the pattern sentence types because the empirical claim in Adger (Reference Adger2003) is that there is a relative difference (or pattern) in acceptability among these sentence types, and magnitude estimation has been proposed as a good method for assessing relative differences in acceptability (Bard et al. Reference Bard, Robertson and Sorace1996, Cowart Reference Cowart1997, Keller Reference Keller2000, Featherston 2005a; for more cautious endorsements, see Bader & Häussler Reference Bader and Häussler2010, Sprouse Reference Sprouse2011b, Weskott & Fanselow Reference Weskott and Fanselow2011). The 250 existence tokens became the target materials for the yes–no experiments, which are described in Section 6 below. We chose the yes–no task to test the existence tokens because the empirical claim in Adger (Reference Adger2003) is that these constructions are possible in US English (a fact that could also be investigated by using a representative corpus of US English). All but three of the existence tokens were un-starred in the text, and presented without any discussion of potential comparison conditions. Three starred examples were also included in the existence category because there was no discussion of an explicit acceptable comparison condition or a grammatical operation that could be used to construct an appropriate comparison condition. The 219 conditions from the ME experiments were combined with the 250 existence tokens from the yes–no experiments to form the 469 data points referenced in the introduction. The repeat, non-English, and untestable tokens were not tested in the experiments.
4. The criteria for discriminating successful replications and replication failures
Data analysis and interpretation are often glossed over in articles that are critical of traditional methods, leaving the perception that one simply plugs the data into a statistical test, and then the test tells you whether the experimental hypothesis is true or false. Unfortunately, the situation is often much more complex than this. Not only are there many different statistical tests available for any given experimental design, but there are also several different inferential methods that can be used to draw conclusions about the experimental hypothesis from any given set of statistics. A full discussion of statistical tests and types of inference is clearly beyond the scope of this article; however, we can be explicit about the statistical and inferential assumptions that will underlie the data analysis in this article.
For the magnitude estimation experiments, we will define replication as the simple detection of a significant difference in the correct direction between the conditions in a phenomenon. For example, if a phenomenon consisted of two conditions, a replication obtains if the sentence reported as more acceptable by Adger (usually through the lack of a diacritic) is observed to be significantly more acceptable than the sentence reported as less acceptable by Adger (through the presence of a diacritic). Similarly, for the yes–no experiments, we will define replication as the observation of significantly more yes-responses than no-responses for the sentences that were reported as grammatical by Adger, and as the reverse (more no-responses than yes-responses) for the sentences that were reported as ungrammatical by Adger. In other words, for grammatical sentences the proportion of yes-responses must be significantly greater than .5, and for ungrammatical sentences the proportion of no-responses must be significantly greater than .5.
It is clearly possible to imagine other definitions of replication. For example, for the ME experiments one could require that the numerical ratings meet certain thresholds in addition to reaching statistical significance in the correct direction. As a concrete example, one could specify that un-starred sentences in Adger must be rated above 0.5 on a z-unit scale (the standardized scale that is the result of a z-score transformation; see Schütze & Sprouse Reference Schütze, Sprouse, Sharma and Podesvain press for a review), and starred sentences must be rated lower than −0.5 on a z-unit scale in order for Adger's claim to be replicated. Similarly, one could also specify that only significant differences of a certain magnitude (e.g., greater than 0.75 z-units) should count as significant differences. For the yes–no experiments, one could specify that the proportion of desired responses must be significantly larger than a threshold other than 0.5, such as 0.75, which would mean that more than three quarters of participants must find rate the sentence the same as Adger (Reference Adger2003) .
We chose not to impose these extra restrictions on the definition of replication for several reasons. First and foremost, we believe that the simple detection of a difference in the predicted direction is closest to the intent of Adger (Reference Adger2003) . Adger (Reference Adger2003) primarily uses un-starred and starred sentences, as opposed to the full range of diacritics available to syntacticians, suggesting that he is primarily concerned with the existence of the difference, and not the magnitude of the difference, or the absolute location of the ratings on the acceptability continuum. Second, the imposition of additional numerical criteria on the analysis requires an explicit hypothesis about the effect of syntactic (i.e., grammatical) manipulations on acceptability judgments. Acceptability judgments are a behavioral response that is directly affected by several different aspects of the language faculty, of which syntax is only one (others include lexical semantics, compositional semantics, and even parsing difficulty). While it may be possible someday to create a complex theory of acceptability judgments that makes fine-grained predictions about specific levels of acceptability, we do not have one yet (see also Section 8 below). In the absence of such a theory, and in the absence of explicit hypotheses formulated by the author, we feel as though extra numerical constraints are impossible to specify objectively, as different researchers are likely to have different assumptions about what is a reasonable hypothesis. Given all of these reasons, we felt the most appropriate definition would be a simple significant difference in the correct direction; however, in Appendix A we do report the numerical ratings from the ME experiment, and in Appendix B we report the number of yes-responses from the yes–no experiments, so that readers may evaluate the differences for themselves.
Up to this point we have intentionally left the definition of statistically significant vague. This is because we decided to analyze the results using three different types of statistical tests. First, we calculated classic p-values using standard frequentist tests (t-tests for 2-sentence phenomena, one-way ANOVAs for 3-sentence phenomena, two-way ANOVAs for 4-sentence phenomena, and sign-tests for yes–no results). Second, because there has been growing interest in the use of linear mixed-effects models (LMEMs) for the analysis of language data, we ran linear mixed-effect models with two random factors: participants and items. We used the pvals function from the languageR package to estimate p-values (Baayen Reference Baayen2007, Baayen, Davidson & Bates Reference Baayen, Davidson and Bates2008). Finally, given the growing interest in Bayesian statistics across all domains of cognitive science, we calculated Bayes factors for each comparison (Gallistel Reference Gallistel2009, Rouder, Speckman, Sun, Morey & Iverson Reference Rouder, Speckman, Sun, Morey and Iverson2009). Bayes factors provide an intuitively natural measure of the strength of the evidence for each of the two hypotheses in the form of an odds ratio. For example, a Bayes factor of 4 indicates that the data favors the experimental hypothesis (H1) over the null hypothesis (H0) in a ratio of 4:1. For ease of exposition, the resulting Bayes factors were also categorized using the intuitive English classification proposed by Jeffreys (Reference Jeffreys1961) . Our goal in using these three types of analyses, and thus deriving (up to) three replication rates is to ensure that these results are useful to researchers in the field regardless of their preferred method of statistical analysis.
One final thing that we should note is that we decided to use non-directional versions of each of the statistical tests. This means that the p-values that we report are two-tailed, and the Bayes factors that we report are the JSZ Bayes factor equation from Rouder et al. (Reference Rouder, Speckman, Sun, Morey and Iverson2009), which assumes (i) a non-directional H1 (equivalent to a two-tailed t-test), and (ii) an equal prior probability of the two hypotheses. In a similar vain, when calculating the minimum replication rate we counted marginally significant results (i.e., p-values between .05 and .1, and Bayes factors between 1 and 3) as replication failures. These two decisions (non-directional tests and equating marginal results as replication failures) result in more conservative replication rates.
5. Experiment 1: Magnitude estimation
5.1 Participants
Two hundred and forty participants (40 in each of six sub-experiments) completed the magnitude estimation experiment. Participants were recruited online using the Amazon Mechanical Turk (AMT) marketplace, and paid $3.00 for their participation (see Sprouse Reference Sprouse2011a for evidence of the reliability of data collected using AMT when compared to data collected in the lab). Participant selection criteria were enforced as follows. First, the AMT interface automatically restricted participation to AMT users with a US-based location. Second, we included two questions at the beginning of the experiment to assess language history: (i) Were you born and raised in the US? (ii) Did both of your parents speak English to you at home? These questions were not used to determine eligibility for payment, consequently there was no incentive to lie. Five participants answered ‘no’ to one or both of these questions and were therefore excluded from the analysis.
5.2 Materials
An example of each condition from the materials for Experiment 1 are listed in Appendix A
5.2.1 Division into six sub-experiments
The 219 conditions (198 directly form Adger plus 21 that we created as controls) were pseudorandomly distributed among six separate sub-experiments in order to keep the total length of each survey under 100 items. The distribution of the conditions among the sub-experiments was pseudorandom according to the following two constraints: (i) conditions that were related (i.e., formed a pattern) were placed in the same sub-experiment so that the resulting statistical analyses were always repeated measures, and (ii) the balance of by-hypothesis acceptable and unacceptable conditions was approximately balanced across all six sub-experiments. The percentage of by-hypothesis acceptable items was 51% in three of the experiments, and 54% in the other three experiments.
5.2.2 Division into four versions of each sub-experiment
Eight tokens of each condition were constructed such that the structural properties of the condition were maintained but the lexical items varied. The eight tokens were distributed among four lists using a Latin Square procedure such that each list contained two tokens of each condition, and such that the lists did not contain identical lexicalizations of structurally related conditions. As a potential point of comparison across sub-experiments (e.g., to compare the use of the rating scales), two tokens each of eight experimental conditions from Sprouse et al. (Reference Sprouse, Almeida, Grohmann and Boeckx2012) were added to each list. Two additional acceptable items were added to three of the lists to yield 90 items per list. Finally, each list was pseudorandomized such that related conditions never appeared consecutively. The result was four versions each of the six sub-experiments.
5.3 Task
The task was magnitude estimation (Stevens Reference Stevens1957, Bard et al. Reference Bard, Robertson and Sorace1996, Cowart Reference Cowart1997). In the magnitude estimation task, participants are presented with a reference sentence, called the standard, which is pre-assigned an acceptability rating, called the modulus. Participants are asked to use the standard to estimate the acceptability of the experimental items. For example, if the standard is assigned a modulus of 100, and the participant believes that an experimental item is twice as acceptable as the standard, the participant would rate the experimental item as 200. If a participant believes the experimental item is half as acceptable as the standard, she would rate the experimental item as 50. The standard sentence was in the middle range of acceptability: Who said that my brother was kept tabs on by the FBI? The standard was assigned a modulus of 100 and repeated every seven items to ensure that it was always visible on the screen.
5.4 Presentation
In order to familiarize participants with the magnitude estimation task, they were first asked to complete a practice phase in which they rated the lengths of six horizontal lines on the screen prior to the sentence rating task. After the practice phase, they were told that this procedure can be extended to sentences. No explicit practice phase for sentences was provided; however, nine additional anchoring items (three each of acceptable, unacceptable, and moderate acceptability) were placed as the first nine items of each survey. These items were identical, and presented in the identical order, for every survey. Participants rated these items just like the others; they were not marked as distinct from the rest of the survey in any way. However, these items were not included in the analysis as they served simply to expose each participant to a wide range of acceptability prior to rating the experimental items (a type of unannounced practice). This resulted in surveys that were 99 items long. The surveys were advertised on the Amazon Mechanical Turk website, and presented as web-based surveys using an HTML template available on the first author's website. Participants completed the surveys at their own pace.
5.5 Results
Acceptability judgments from each participant were z-score transformed prior to analysis to eliminate some of the forms of scale bias that potentially arise with scaling tasks (Schütze & Sprouse Reference Schütze, Sprouse, Sharma and Podesvain press). The mean rating of each condition is listed in Appendix A. We used the discussion in Adger (Reference Adger2003) to identify the appropriate analyses for each pattern. This resulted in 115 statistical tests: 104 2-condition phenomena, seven 3-condition phenomena, and four 4-condition (2×2 factorial) phenomena.
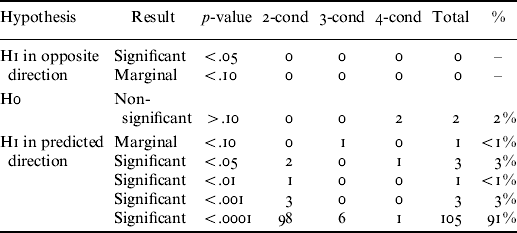
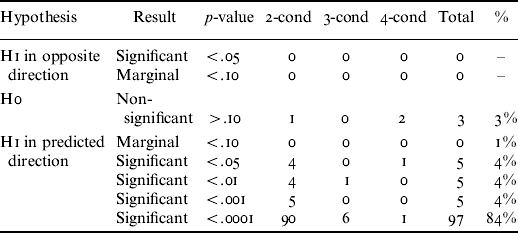
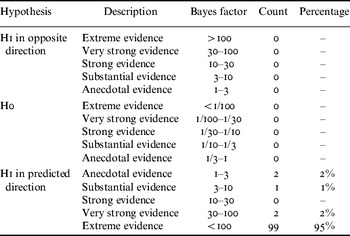
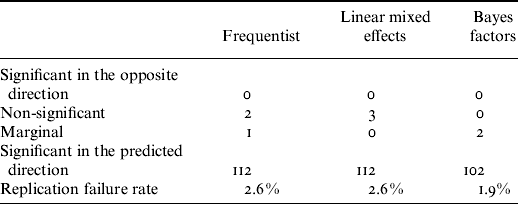
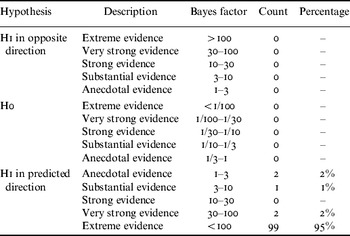
Table 2 reports a summary of the results of the standard frequentist statistical tests (t-tests, one-way ANOVAs, and two-way ANOVAs). Only three out of the 115 standard frequentist statistical tests resulted in either non-significant (p>.10) or marginal (.05<p<.10). Table 3 reports a similar summary for linear mixed-effects models with participants and items included as random factors (e.g., Baayen et al. Reference Baayen, Davidson and Bates2008). Similar to the standard frequentist results, linear mixed-effects models returned only three non-significant results (and no marginal results) out of the 115 statistical tests. Table 4 reports a similar summary for the Bayes factor analyses; however it should be noted that at the time of writing we know of no analytic method for calculating Bayes factors for 3-condition and 4-condition designs. Therefore the following table only reports the results for the 2-condition designs, so instead of 115 statistical tests, Table 4 reports 104 statistical tests. Though only 104 of the 115 phenomena could be analyzed using Bayes factors, the result is similar to the standard frequentist and linear mixed-effects results: two out of the 104 phenomena were not considered evidence for the experimental hypothesis (both were at best anecdotal evidence).
Results of Experiment 1 (magnitude estimation) according to standard frequentist tests. There were 115 phenomena.
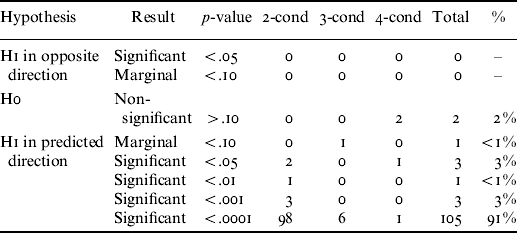
Results of Experiment 1 (magnitude estimation) according to linear mixed effects models. There were 115 phenomena.
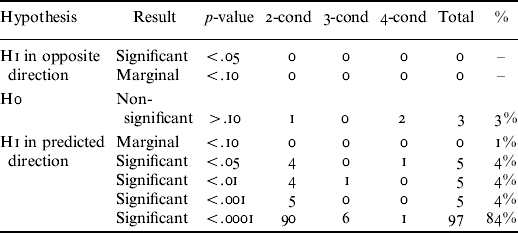
Results of Experiment 1 (magnitude estimation) according to Bayes factor. Only the 2-condition results are reported. There were 104 2-condition phenomena.
5.6 Discussion
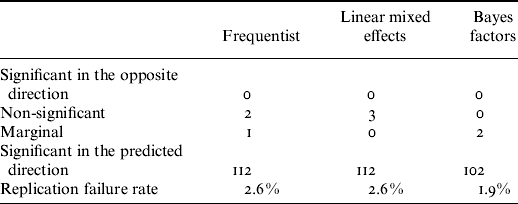
Traditional statistical tests (i.e., paired t-tests, one-way repeated measures ANOVA and two-way factorial 2×2 repeated measures ANOVA) and linear mixed-effects models yielded nearly identical results. Traditional statistical tests (with two-tailed p-values) resulted in 112 replications, one marginal replication (p=.09), and two replication failures (p=.36, p=.14), while linear mixed-effects models resulted in 112 replications and three replication failures (p=.11, p=.38, p=.11). In order to derive a maximum replication failure rate, we equated marginal replications with replications failures, resulting in a maximum replication failure rate for both traditional statistical analysis and linear mixed-effect models of 2.6% (3/115). Bayes factor analyses were only conducted for the pairwise comparisons. Out of the 104 pairwise comparisons, 102 yielded substantial to extreme evidence for H1, and two yielded only anecdotal evidence for H1. In order to derive a maximum replication failure rate for Bayes factor analysis, we counted anecdotal evidence as a replication failure, resulting in a maximum replication failure rate of 1.9%. Taken together, the maximum replication failure rate for the 115 analyses tested in the ME experiments is in the range of 1.9%–2.6%. Table 5 summarizes these counts.
Counts of the replications and failures for the ME experiments. The failure rate includes marginal results as replication failures to derive a maximum failure rate.
Although it is too early to calculate a comprehensive replication rate for Adger (Reference Adger2003) as we have yet to discuss the yes–no experiment, two patterns do seem present in the ME data. First, the phenomena that were tested using ME appear to be overwhelmingly replicable, with fewer than 3% failing to replicate in these experiments. As mentioned in Section 2, because these replication failures may or may not be true negatives, we will discuss them in detail in Section 7 to attempt to achieve a more accurate replication rate. The second pattern to note is that out of the eleven 3-condition and 4-condition designs, three were either non-significant or marginal. Without a larger sample it is difficult to draw any firm conclusions, but this does raise the possibility that 3- and 4-condition designs may have a lower replication rate than 2-condition designs. This is not entirely unexpected, as factorial ANOVAs (used in the 4-condition designs), which look for an interaction between two (or more) factors, are well-known to have lower statistical power than simple effects tests (because the main effects in the design can explain much of the variance, leaving very little for the interaction term to explain). The lower statistical power of factorial ANOVAs makes these three replication failures prime candidates to be false negatives, an issue that we will discuss in more detail in Section 7.
6. Experiment 2: Yes–no
6.1 Participants
Two hundred participants completed the yes–no experiment (40 participants in each of five sub-experiments). Participants were once again recruited online using the Amazon Mechanical Turk (AMT) marketplace (see Sprouse Reference Sprouse2011a), and paid $2.00 for their participation. Participant selection criteria were identical to those of Experiment 1. Three participants answered ‘no’ to one or both of the language history questions and were therefore excluded from the analysis.
6.2 Materials
Adger (Reference Adger2003) follows a practice that is common in linguistics textbooks: several of the example tokens were obviously constructed to maintain the attention of undergraduate and graduate students, rather than present semantically and pragmatically neutral examples of the syntactic structures in question. As such, we made minor changes to 107 of the 250 existence tokens prior to running them in the yes–no experiments. We changed proper names (usually Greek mythological figures) in 68 sentences to common US proper names; we changed the lexical items in 66 sentences to eliminate references to violent, fictional, or otherwise implausible items (e.g., executioners, gorgons); finally, we added antecedent clauses to nine sentences to make certain pragmatically restricted constructions, such as ellipsis and topicalization, more plausible in a single sentence. In all 107 cases, the structural properties of the sentences were maintained. The materials for Experiment 2 are listed in Appendix B.
The 250 existence tokens were distributed into five separate lists. Four lists contained 50 acceptable target items and 50 unacceptable filler items. The fifth list contained 47 acceptable target items, three unacceptable target items, 47 unacceptable filler items, and three acceptable filler items. The unacceptable filler items were taken from the material of Experiment 1 to ensure that the filler items varied in both acceptability and content, so as not to unduly bias the results of Experiment 2. Each list was 100 items long, with a ratio of acceptable items to unacceptable items of 1:1, and a ratio of target items to filler items of 1:1. Four versions of each list were created to counterbalance the order of presentation: original order, reversed order, transposition of the first and second half, and reversed order of the transposed halves.
6.3 Task and presentation
The task was a standard two-choice yes–no task. Participants were asked to click radio buttons that were labeled YES or NO. The surveys were advertised on the Amazon Mechanical Turk website (see Sprouse Reference Sprouse2011a), and presented as web-based surveys using an HTML template that is available on the first author's website. Participants completed the surveys at their own pace.
6.4 Results
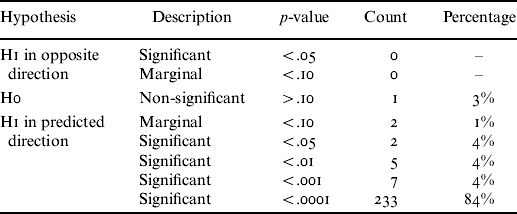
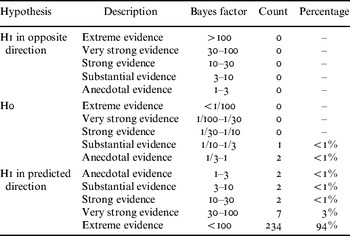
A full list of the responses to each sentence is available in Appendix B. Because participants only rated one token of each condition, participant and item were confounded, eliminating the possibility of using linear mixed-effects models as we did for Experiment 1. Therefore the results of Experiment 2 were analyzed in only two ways: (i) using the traditional sign-test (with two-tailed p-values), and (ii) using the Bayes factor calculation for binomial responses made available by Jeff Rouder on his website: http://pcl.missouri.edu/bayesfactor. Table 6 reports the results according to sign-tests, and Table 7 reports the results according to binomial Bayes factor analyses.
Results of Experiment 2 (yes–no) according to sign-tests. There were 250 phenomena.
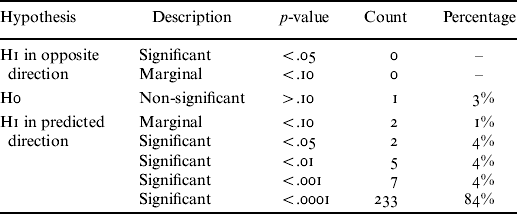
Results of Experiment 2 (yes–no) according to binomial Bayes factor analyses. There were 250 phenomena.

6.5 Discussion
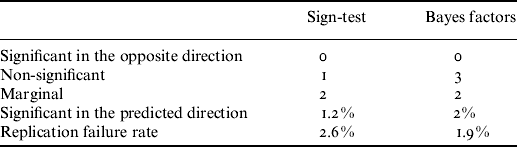
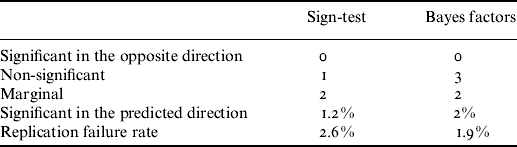
The sign-tests yielded 247 replications, two marginal replications (p=.054, p=.077), and one replication failure (p=.44). Again, in order to derive a maximum replication failure rate, we equated marginal replications as replications failures, resulting in a maximum replication failure rate of 1.2% (3/250). From the perspective of Bayes factor analysis, 245 replications yielded substantial to extreme evidence for H1, two yielded only anecdotal evidence for H1, two yielded anecdotal evidence for H0, and one yielded strong evidence for H0. Again, in order to derive a maximum replication failure rate for Bayes factor analysis, we counted anecdotal evidence for H1 as a replication failure, as well as any evidence for H0, resulting in a maximum replication failure rate under Bayes factor analysis of 2% (5/250). Taken together, the replication failure rate for the yes–no experiments was in the range of 1.2%–2%. Table 8 summarizes these counts. As with Experiment 1, a detailed discussion of the replication failure in Experiment 2 will be presented in Section 7 in order to better determine whether they are in fact true negatives, or whether they may be false negatives.
Counts of the replications and failures for the yes–no experiments. The failure rate includes marginal results as replication failures to derive a maximum failure rate.
7. A closer look at the non-significant and marginal results
Before combining the results from the two experiments to derive comprehensive replication rates for Adger (Reference Adger2003) (see Section 8), it may be useful to take a closer look at the negative results to better evaluate whether they are likely to be true negatives, or whether they are likely to be false negatives arising from either lack of statistical power in the formal experiments, or some other task-related confound. In either case, the results may reveal properties of formal experiments that syntacticians should consider when constructing a formal experiment (Table 9).
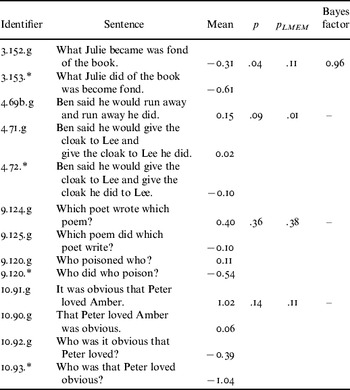
Non-significant and marginal results from the magnitude estimation experiment (Experiment 1). Condition identifiers are relative the text of Adger (Reference Adger2003) and are in the format chapter.example.judgment.

Turning first to the magnitude estimation experiment (Experiment 1), the first negative result in Table 8 is a 2-condition phenomenon from Chapter 3 designed to demonstrate that [become fond] is not a constituent to the exclusion of [of the book]; or to put it another way, [fond of the book] is itself a constituent that forms a larger constituent with become as [become fond of the book]. As the mean ratings and significant p-value for the t-test indicate, there does indeed seem to be a difference between these two conditions. This suggests that non-significant p-value for the linear mixed-effects model may simply be a case of insufficient statistical power for this particular phenomenon. The anecdotal Bayes factor may also be a power issue, as Bayes factors are known to be more conservative than p-values, often requiring very large sample sizes to reach substantive levels of support for small effects. This is because Bayes factors are a measure of the strength of the evidence for a hypothesis; therefore it makes sense that small effects would require very large samples to register as substantial evidence (Rouder et al. Reference Rouder, Speckman, Sun, Morey and Iverson2009).
The second negative result is a 3-condition phenomenon from Chapter 4 that was again designed to evaluate constituency. The first condition is intended to establish that VP-preposing is possible with clear constituents such as [run away]; the second condition is intended to demonstrate that both of the objects in a ditransitive construction can undergo VP-preposing simultaneously, suggesting that all three form a constituent as [give the cloak to Lee]; the third (starred) condition is intended to demonstrate that the verb and first object [give the cloak] cannot form a constituent to the exclusion of the second object [to Lee], which suggests that a binary branching analysis of ditransitives may be incorrect. We analyzed this paradigm as a one-way ANOVA, which in essence means that we tested whether the difference between condition 1 and condition 2 was equal to or different than the difference between conditions 2 and 3, with our prediction being that the former is smaller than the latter. Although the ANOVA p-value is marginal (.09) and the LMEM p-value is significant (.01), the mean ratings suggest that this effect may actually be trending in the opposite direction of our prediction, as the difference between conditions 1 and 2 (0.13 z-units) is slightly larger than the difference between conditions 2 and 3 (0.12 z-units). Interpreting this result is difficult: on the one hand, we were perhaps hasty in attributing this particular prediction to Adger (Reference Adger2003), as he actually says nothing about the size of the difference between condition 1 and condition 2 (intransitive versus ditransitive verbs) in the text, and there is clearly an extra difference between condition 1 and condition 2 (i.e., the type of verb) that is not present between condition 2 and condition 3; on the other hand, it is surprising to us to see that the difference between two putatively grammatical sentences (condition 1 and condition 2) is equal to or larger than the difference between a putatively grammatical sentence (condition 2) and a putatively ungrammatical construction (condition 3). This is a good example of the complexity involved in interpreting experimental results: experimenters must take into consideration both the level of detail of the predictions (e.g., Does the theory actually say anything about the sizes of the differences?) and structure of the conditions (e.g., How many types of differences, or factors, are at play?) rather than simply trusting the results of a statistical test to reveal the true status of the phenomenon.
The third example (from Chapter 9) is the classic paradigm demonstrating that the Superiority effect (a preference for subject wh-words to appear before object wh-words in multiple wh-questions) is substantially smaller for D-linked wh-phrases (e.g., Pesetsky Reference Pesetsky, Reuland and ter Meulen1987). In this case, the interaction did not reach significance. Given that this particular paradigm has been demonstrated in at least three different formal experiments (Featherston 2005b, Sprouse 2007a, Hofmeister, Jaegea, Arnon, Sag & Snider Reference Hofmeister, Jaeger, Arnon, Sag and Sniderin press), we are fairly confident that this is a false negative. Exactly what caused this discrepancy is unclear, although it should be noted that the Adger (Reference Adger2003) materials differed from previous studies in that the Adger materials are matrix wh-questions, resulting in a do-support difference between the Superiority-violating and Superiority-respecting conditions, whereas previous studies used embedded wh-questions to eliminate do-support entirely. Whatever the cause, this is another example of the complexity involved in interpreting negative results, as experimenters must take both the current results and any previous results into consideration when evaluating a negative result.
The final example from Experiment 1 is a factorial paradigm from Chapter 10 designed to illustrate Subject island effects. Like the previous example, the interaction terms from the ANOVA and linear mixed-effects models both failed to reach significance; and like the previous example, given that there are several instances of Subject islands that have been experimentally confirmed in the literature (see Sprouse Reference Sprouse and Almeida2011 and Sprouse et al. Reference Sprouse, Almeida, Grohmann and Boeckx2012 for simple Subject islands), we believe that this is likely a false negative. From the mean ratings it appears that participants rated both condition 2 (a CP subject sentence) and condition 3 (wh-extraction from the embedded clause) lower than might have been expected, indicating some sort of dispreference for these conditions (perhaps because they are presented without context in these experiments). Whatever the cause of this false negative, it is another useful example of the complexity involved in interpreting negatives results (Table 10).
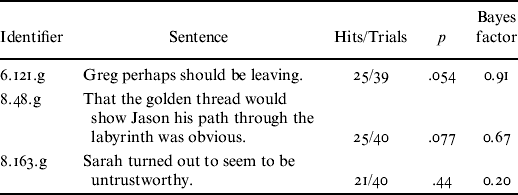
Non-significant and marginal results from the yes–no experiment (Experiment 2). Condition identifiers are relative the text of Adger (Reference Adger2003) and are in the format chapter.example.judgment.
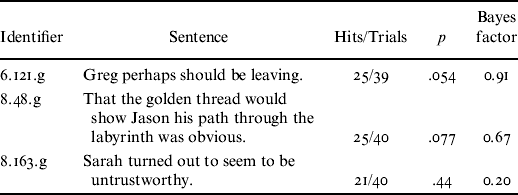
Turning now to the three marginal and non-significant results of the yes–no experiment (Experiment 2), we see a similar situation. The first example is nearly significant based on the (non-directional) sign-test (p=.054), suggesting that this could simply be a marginal result due to insufficient statistical power. The second example is again marginal by (non-directional) sign-test (p=.077), and in this case, may have been influenced by the general implausibility of the scenario being described (i.e., golden threads and labyrinths). The only phenomenon that appears to be a strong candidate for a true negative in Experiment 2 is example three, which is an example designed to demonstrate the possibility of stacking subject-raising verbs. The participants in this experiment were nearly equally split between accepting and rejecting this sentence. As one anonymous JL referee mentioned, this is not the precise lexicalization that is presented in Adger (Reference Adger2003) : instead, Adger presents the following lexicalization: Hephaestus appears to have turned out to have left. We changed the verbs slightly (placing turned out first) because we felt that the lexical ambiguity of turned out between a raising verb and a transitive verb would be minimized if turned out were the first verb (i.e. two raising verbs in sequence is likely very infrequent, therefore if a participant encountered turned out as the second verb, they may be inclined to try to interpret it as a transitive in order to avoid the unlikely double-raising construction). However, to ensure that this lexicalization change did not influence the results we ran a second experiment with the original lexicalization (plus a name change for the subject of the sentence): Sarah appears to have turned out to have left. The results for this example are in fact in the opposite direction than predicted: 11/39, p=.005 by sign-test. The reversal in this follow-up may confirm that our original worry was correct: the low likelihood of two raising verbs in sequence may bias participants to interpret turned out as a transitive verb, which would then be ungrammatical because the required object is missing. At the very least, this follow-up confirms that participants are not inclined to accept this particular construction, perhaps because of the complex scenario required to accommodate the meaning of two subject-raising verbs. Since this is an existence condition, it may be useful to compare these results to a corpus study in the future to determine how often these double-raising constructions arise in spontaneous speech or writing.
There were a total of seven negative results from Experiments 1 and 2. Of these seven results, three were potential instances of insufficient statistical power (see Sprouse & Almeida Reference Sprouse and Almeida2011 for an investigation of statistical power in acceptability judgment experiments), two were very likely instances of false negatives given previous formal experimental confirmation of the phenomena, and two may have involved complexities in the conditions that obscured the results. Obviously, a conclusive investigation of each of these phenomena requires additional experiments (and possibly corpus studies), therefore in the general discussion to follow we will simply assume that they are all in fact true negatives. Not only is this is the most conservative assumption that we can make (resulting in the lowest possible replication rate), it is also in line with the assumptions of some critics, who have tended to interpret the negative results of formal experiments as true negatives without further investigation or discussion (e.g., Gibson & Fedorenko Reference Gibson and Fedorenkoin press). However, it is our hope that the seven phenomena discussed here illustrate that such an assumption is much too strong, and should not be adopted by syntacticians who wish to run formal experiments. Experiments are not truth-discovery machines. Experiments provide one type of evidence toward a conclusion, but it is up to the experimenter to interpret that evidence relative to all of the other knowledge she has (theoretical knowledge, previous results, estimates of statistical power, etc.).
8. General discussion
At this point, deriving a minimum replication rate is relatively straightforward: for each type of statistical test (standard frequentist, linear mixed-effects, Bayes factor), we can compare the number of replications to the total number of phenomena tested. For standard frequentist tests out of 365 phenomena tested, 359 were clearly significant (i.e., six were either non-significant or marginal), resulting in a replication rate of over 98%. For linear mixed-effects models, we only tested 115 phenomena; however, 112 of those phenomena were clearly significant, for a replication rate of over 97%. For Bayes factor analyses, we tested 354 phenomena, and 347 were clearly significant, for a replication rate of 98%. Note that these are minimum replication rates: we are assuming that the negative results reported above are in fact true negatives – in other words, spurious false positives introduced in the literature due to the use of the traditional methods – though as we saw in Section 7, this assumption is likely too strong. Furthermore, we adopted non-directional versions of the statistical tests; if instead we used Adger's results as a directional hypothesis, all of the marginal results would be significant. Taken as a whole, these results suggest that the minimum replication rate for the data in Adger (Reference Adger2003) is 98%.
The question, of course, is what can we conclude from these results. It seems to us that the weakest possible conclusion is that there is a coherent set of 469 sentence types (forming 365 phenomena) that are at least 98% replicable. This means that any critic who wishes to claim that syntactic data is unreliable must simultaneously provide an account that explains the reliability of this data set. One obvious way to do that is to present additional replication failures. For example, if one assumes that a false positive rate of 10%–15% would suggest a substantial reliability problem (see e.g., Gibson & Fedorenko Reference Gibson and Fedorenko2010, Gibson, Piantadosi & Fedorenko Reference Gibson, Piantadosi and Fedorenko2011), then a critic would need to demonstrate 35–50 phenomena from the syntactic literature that are false positives in order to achieve a 10%–15% false positives relative to the 359 phenomena that replicated in this study. That is an order of magnitude larger than any currently published critical article.
Stronger conclusions are also possible; however, they all hinge on additional assumptions about the data set in Adger (Reference Adger2003) that individual researchers may or may not be comfortable making. For example, one could argue that the fact that Adger (Reference Adger2003) covers nine topics in syntax means that it is a fairly representative sampling of data points in the field in general, and as such it can be used as an estimate of the reliability of all data in the field. This may be a bit of a stretch given the conscious editing that goes into textbook construction (some topics are left out, others are given more or less space, etc.). However, it is clear that 469 sentence types is a relatively large sample, therefore the replication rate for the entire field could only diverge drastically if one assumes that Adger (Reference Adger2003) is particularly unrepresentative of the field. We find that assumption very unlikely to be true, as any textbook must attempt to give a reasonable introduction to the field.
One could also make the argument that because Adger (Reference Adger2003) is a textbook, the data set that it contains is in some ways more important to the field than other data sets of similar size because this particular data set is (at least partially) sufficient to construct the theory from the ground up. Ultimately, criticisms of syntactic data are criticisms of syntactic theories. If the data is unreliable, then the theory itself is also unreliable. The fact that the entire data set used by Adger to construct a syntactic theory is reliable at a minimum suggests that current incarnations of syntactic theory can be constructed from reliable data. This, of course, in no way guarantees that the resulting theories are correct; instead, it simply means that if the theories are incorrect, it is not the result of unreliable data, but rather the result of incorrect theorizing. This seems to us to be the general assumption within the field of syntax itself: while there are many different syntactic theories (Categorial Grammar, Cognitive Grammar, Construction Grammar, Government and Binding, Head-driven Phrase Structure Grammar, Lexical-Functional Grammar, Minimalism, Role and Reference Grammar, Tree-Adjoining Grammar, Word Grammar, etc.), the differences between theories are rarely based on different data sets. Instead, most theories attempt to explain the same basic data set using (sometimes radically) different syntactic mechanisms. This suggests that syntacticians believe that the problems facing the field are theoretical in nature, not empirical, contrary to the claims of some critics.
The role that these results will play in the ongoing methodological debates within syntactic theory primarily depends on the responses of critics to the data presented here. Some responses to an early draft of this paper suggest that critics may want to see data from journal articles rather than textbooks (e.g., Gibson et al. Reference Gibson, Piantadosi and Fedorenko2011). This response is interesting in several ways. First, the examples that have been used by critics thus far have primarily not been taken from journal articles: for example, Wasow & Arnold (Reference Wasow and Arnold2005) tested claims from a book (The logical structure of linguistic theory, Chomsky Reference Chomsky1955/1975), while Gibson & Fedorenko (Reference Gibson and Fedorenkoin press) tested one claim from a dissertation (Gibson Reference Gibson1991), one claim from a book (Barriers, Chomsky Reference Chomsky1986), and one claim from a journal article (Kayne Reference Kayne1983). Second, textbook data was most likely journal data at some point in the past, therefore the distinction between textbook data and journal data is a temporal distinction, not a methodological distinction. Finally, if the distinction is indeed temporal, then this type of response suggests that critics believe that the field is able to correctly distinguish reliable data from unreliable data over time, such that the reliable data is placed in textbooks, and the unreliable data is not. It seems to us that this changes the debate considerably: instead of being concerned that unreliable data is misleading the field into the construction of incorrect theories, this would suggest that the field has a mechanism of some sort to identify and remove spurious data, at least over time (most likely extensive replication given how easy it is to collect acceptability judgments, see also Phillips (Reference Phillips, Iwasaki, Hoji, Clancy and Sohn2009) for a similar claim, but see Sprouse & Almeida (Reference Sprouse and Almeida2011) for evidence that traditional acceptability judgment experiments are actually comparatively powerful experiments to begin with). Instead of a debate about the reliability of the data underlying syntactic theories, this would suggest that the debate is about which method is most efficient at excluding unreliable data points from the empirical landscape of the field.
The role that these results will play in the everyday practice of syntacticians is relatively straightforward. Choosing the appropriate methodology (in any field) requires the researcher to balance the costs and benefits of different methodologies relative to their specific research question. The benefits of the traditional methods over formal experiments are well known: (i) traditional methods are cheaper – formal experiments cost $2.20–$3.30 per participant on AMT; (ii) traditional methods are faster, at least with respect to participant recruitment – although AMT has diminished this advantage significantly (e.g., Sprouse Reference Sprouse2011a reports a recruitment rate of 80 participants per hour on AMT); and (iii) the tasks used in traditional methods, such as the forced-choice and yes–no tasks, do not require large numbers of participants the way that the numerical rating tasks in formal experiments do – this often makes traditional experiments the only option for languages with few speakers (Culicover & Jackendoff Reference Culicover and Jackendoff2010) or for studies of variation between individuals (den Dikken et al. Reference den Dikken, Bernstein, Tortora and Zanuttini2007). In response to these benefits, critics of traditional methods have suggested two potentially serious costs: (i) traditional methods may lead to (intolerably) more false positives than formal experiments (Wasow & Arnold Reference Wasow and Arnold2005, Gibson & Fedorenko Reference Gibson and Fedorenkoin press), and (ii) traditional methods may lead to (intolerably) more false negatives (Keller Reference Keller2000, Featherston Reference Featherston2007). The data in this article directly bear on (i), suggesting that at least for these 469 sentence types, there is no evidence that traditional methods lead to substantially more false positives. The data in this article only indirectly bear on (ii): if some of the negative results in the experiments turn out to be false negatives, then this could be evidence that formal experiments do not necessarily lead to substantially fewer false negatives. A more comprehensive investigation of false negatives (in the form of statistical power) is undertaken in Sprouse & Almeida (Reference Sprouse and Almeida2011), the results of which suggest that traditional methods may actually be more powerful (i.e., result in fewer false negatives) than formal experiments, at least at the sample sizes that are typical for each method.
To be absolutely clear, we are not suggesting that traditional methods should be universally preferred to formal experiments. We are, in fact, strong supporters of formal experimental research. This is because there are very real benefits to formal experiments. For example, the numerical rating tasks typically used in formal experiments provide more information than the forced-choice and yes–no tasks used in traditional methods, such as the size of the difference between conditions (Sprouse & Almeida Reference Sprouse, Almeida, Grohmann and Boeckx2012, Schütze & Sprouse Reference Schütze, Sprouse, Sharma and Podesvain press, though, as Myers Reference Myers2009 points out, non-numerical tasks can be used to approximate size measurements if necessary). Furthermore, if one wishes to construct a complete theory of the gradient nature of acceptability judgments, an enterprise which has gained in popularity over the past decade (e.g., Keller Reference Keller2000, Featherston Reference Featherston2005b) then one will clearly need numerical ratings of acceptability.Footnote 3 Nonetheless, these results also suggest that traditional methods are a highly reliable method in their own right; and given their well-established benefits mentioned in the previous paragraph, traditional methods should continue to be an available option for syntacticians. The bottom line is that there is no single correct answer when it comes to choosing a methodology. Syntacticians (and indeed all researchers) must be aware of the relative costs and benefits of each methodology with respect to their research questions, and be allowed to make the decision for themselves. Science cannot be reduced to a simple recipe.
9. Conclusion
In an effort to address concerns about the unreliability of data in syntactic theory, we tested every unique, US-English acceptability judgment in a popular syntactic textbook (Adger Reference Adger2003). The results suggest that there are 469 sentence types that form 365 thematically coherent phenomena that are at least 98% replicable. At a minimum, this suggests that any future claims that data in syntactic theory are unreliable must somehow explain the overwhelming reliability of this data set. One possibility would be to provide additional examples of false positives (35–50 false positives would support a 10%–15% false positive rate). Another possibility would be to admit that there is a mechanism for weeding out unreliable data (resulting in very reliable textbooks), thereby shifting the debate to the relative efficiency of the two kinds of methods rather than their comparative reliability. Because these sentence types form the complete data set of a textbook that covers nine topics in syntactic theory, it may be possible to make stronger claims, depending on how one views the choice of topics in the textbook. For example, these results could be interpreted as suggesting that syntactic theory is constructed upon sound data since the textbook does attempt to construct a complete theory (note that this does not ensure that the theory is correct, just built on reliable data). Similarly, because textbook data should be relatively representative of the field (or at least not unrepresentative), these results could suggest that overall replication rate in syntax will not be too different from 98%.
The actual impact of these results on current methodological debates remains to be seen; nonetheless, we believe that the practical implications are clear: the number of replication failures that have been reported in the literature are relatively small compared to the number of replications, therefore there is no reason to favor formal experiments over traditional methods solely out of a concern about false positives. This is not to say that traditional methods should always be preferred over formal experiments: formal experiments are clearly a useful tool for some questions in syntax, but there is no evidence that they are a necessary tool for every question. In the end, each methodology offers its own set of costs and benefits, and syntacticians should be free to weigh those costs and benefits relative to the goals of their research.
APPENDIX A
Example materials and mean ratings for Experiment 1 (magnitude estimation)

APPENDIX B
Materials and responses for Experiment 2 (yes–no)