


1. Introduction
During snowfall, atmospherically grown ice crystals settle on the ground and form a snowpack in which originally isolated snow crystals are hard to discern, in accordance with the common perception of a fast transition from powder-like to a compacted and well-connected material. The fastest changes occur within 24 hours immediately after snowfall (Reference Judson and DoeskenJudson and Doesken, 1999). In this stage, snow is subject to high densification rates, which are attributed to structural changes caused by destructive snow metamorphism (Reference De QuervainDe Quervain, 1958; Reference Anderson, Benson and KingeryAnderson and Benson, 1963).
Visco-plastic deformation of snow under its own weight, accompanied by surface-energy-induced metamorphism, is relevant for all densities ranging from low-density snow (Reference Maeno and EbinumaMaeno and Ebinuma, 1983; Reference Löwe, Spiegel and SchneebeliLöwe and others, 2011) to firn (Reference Arnaud, Barnola, Duval and HondohArnaud and others, 2000) and is therefore of fundamental interest. The densification of new snow is also of practical interest. The operational avalanche forecast in Switzerland is based on the IMIS (Intercantonal Measurement and Information System) network of automatic measurement stations (Reference Lehning, Bartelt, Brown, Russi, Stöckli and ZimmerliLehning and others, 1999). IMIS stations are powered by solar cells and generally lack precipitation gauges due to energy constraints, so only snow height is measured continuously. In contrast, the prediction of avalanche hazard usually requires estimates of new snow mass, in order to assess, for example, the increase of stress due to precipitation. For operational avalanche forecasts it is therefore necessary to establish a link between snow height changes and new snow mass via densification modeling with operational snowpack models such as SNOWPACK (Reference Bartelt and LehningBartelt and Lehning, 2002), CROCUS (Reference Brun, Martin, Simon, Gendre and ColéouBrun and others, 1989) and SNTHERM (Reference JordanJordan, 1991). These rely on a suitable constitutive equation which relates stresses to strain rates via a ‘compactive viscosity’ (Reference BaderBader, 1960) to predict new snow densification. All processes which contribute to the densification are lumped into parameterizations for the viscosity. However, these parameterizations are based on empirical microstructural indices (Reference Lehning, Bartelt, Brown, Fierz and SatyawaliLehning and others, 2002; Reference DomineDomine and others, 2008), which cannot be measured unambiguously. To formulate new constitutive laws in terms of objective parameters, it is necessary to conduct measurements for the simultaneous evolution of density and microstructural parameters, such as the specific surface area (SSA).
Studies of snow metamorphism are commonly based on the SSA, as the key objective quantity to avoid empirical indices. Decrease of the SSA is the most prominent indicator of snow metamorphism and has been studied for isothermal metamorphism by various researchers (Reference Flin, Brzoska, Lesaffre, Coléou and PieritzFlin and others, 2004; Reference Legagneux and DomineLegagneux and Domine, 2005; Reference Kaempfer and SchneebeliKaempfer and Schneebeli, 2007; Reference Löwe, Spiegel and SchneebeliLöwe and others, 2011), who focused on long timescales of weeks, months or years. While long experiments allow for robust conclusions about the SSA decrease (Reference Legagneux and DomineLegagneux and Domine, 2005), they are very time-consuming. To improve our general understanding of SSA evolution it would be desirable if robust results could also be obtained from short-term measurements by increasing experimental accuracy.
Though the SSA has become a key parameter to characterize snow metamorphism, dedicated experiments for the simultaneous evolution of density and SSA for new snow have not yet been conducted. This is partly because experimental difficulties arise from the tenuous structure of new snow. Fragile new snow samples usually prevent techniques of casting samples in the field (Reference Heggli, Frei and SchneebeliHeggli and others, 2009). In addition, microstructural processes are sensitive to highly fluctuating meteorological conditions, leading to great variability in snow densities obtained from field measurements (Reference McGurk, Azuma, Kattelmann and ShaferMcGurk and others, 1988; Reference Judson and DoeskenJudson and Doesken, 1999; Reference Roebber, Bruening, Schultz and CortinasRoebber and others, 2003). During the past 10 years the X-ray micro-computertomograph (μ-CT) has become a fast, non-destructive standard instrument to analyze snow metamorphism (Reference Coléou, Lesaffre, Brzoska, Ludwig and BollerColéou and others, 2001; Reference Flin, Brzoska, Lesaffre, Coléou and PieritzFlin and others, 2004; Reference Kaempfer and SchneebeliKaempfer and Schneebeli, 2007). Besides the possibility of visualizing snow microstructure, it allows multiple laboratory experiments to be conducted on the same sample, in order to monitor changes in density and SSA of snow with high precision. However, new snow has not yet been addressed with μ-CT measurements.
Here we investigate the capability of μ-CT measurements to observe new snow densification and contribute to the understanding of the coupled evolution of density and SSA in general. We have restricted ourselves to isothermal conditions at T = −20°C. On the one hand, the evolution is sufficiently slow at low temperatures that the structure remains invariant during the time (∼2 hours) required for a single μ-CT scan. On the other hand, the evolution is fast enough to monitor significant changes in the structure during 2 days at high temporal resolution. Conditions are thus primarily chosen for experimental convenience to ensure high-quality μ-CT scans. We also avoid the experimental difficulties of casting field samples and focus on generating samples from ‘new snow’ crystals, grown in the laboratory to reduce sample-to-sample variability. Note that we use the term new snow for low-density snow with high SSA. We outline the particularities of μ-CT measurements in reference to the common continuum description of snow densification. This allows us to deduce the strain evolution from density measurements. Thereby our results for new snow can be compared with previous results of the material behavior of denser snow and ice. Our simultaneous density and SSA measurements during creep experiments enable us to suggest the relevance of SSA in constitutive modeling of new snow. The impact of our results on ‘natural’ snowfall conditions at higher temperatures and the feasibility of μ-CT experiments in these conditions are discussed.
The paper is organized as follows. After a brief summary of the theoretical background and the connection of μ-CT experiments to continuum modeling (Section 2), we describe our experimental method of preparing samples of new snow from ice crystals grown in the laboratory (Section 3). Section 4 is dedicated to the description of μ- CT measurements and the evaluation of the retrieved data. The results are presented in Section 5. We show that Lagrangian and Eulerian densification rates coincide, enabling us to deduce the strain evolution for different stresses. The influence on the SSA decrease is addressed subsequently. Then the results of densification and metamorphism for a set of experiments with samples of varying initial densities are presented. A summary and conclusions are presented in Section 6.
2. Theoretical Background
2.1. Snow densification
To show how we relate μ-CT experiments to the material behavior of snow, we summarize here the main aspects of snow densification modeling. Based on the work of Reference BaderBader (1960), snow is generally treated as a quasi-one-dimensional, purely viscous material in a state of uniaxial (vertical) compression (Reference Brun, Martin, Simon, Gendre and ColéouBrun and others, 1989; Reference JordanJordan, 1991; Reference Bartelt and LehningBartelt and Lehning, 2002). In a Eulerian frame of reference, the evolution of the density, ρ(z, t), at position z and time t is governed by conservation laws. Mass conservation can be written as

in terms of the vertical velocity field, v, which is related to the vertical strain rate,  . For slow snow deformation, the momentum conservation reduces to the force balance

for the stress σ(z, t), where g denotes the gravitational constant. These equations govern the compaction of a selfdensifying snow column. The continuum starting point (Eqns (1) and (2)) is identical for seasonal snow (Reference BaderBader, 1960) and firn (Reference WinghamWingham, 2000). The difference between snow types enters only via the constitutive law which is required to close the equations. The constitutive law relates stresses to strains and strain rates. For slow densification under its own weight, snow is commonly regarded as a purely viscous material with a constitutive law of the form

A simplified view relates the strain rate,  , and the stress, σ, directly by a fluid-like law

and lumps any dependence on microstructural details into a compactive viscosity, η. The viscosity is commonly assumed to depend on density, ρ (Reference Lehning, Bartelt, Brown, Fierz and SatyawaliLehning and others, 2002; Reference DomineDomine and others, 2008), to capture the reduced compliance at higher volume fractions. The microstructure is commonly incorporated by parameterizations in terms of grain and bond size (Reference Lehning, Bartelt, Brown, Fierz and SatyawaliLehning and others, 2002), which can be difficult to define for a continuous microstructure or irregularly shaped crystals. A stress dependence is sometimes considered (Reference Scapozza and BarteltScapozza and Bartelt, 2003), in order to capture the underlying transitions in the creep mechanisms of ice. The accompanying visco-plastic deformation of ice complicates the situation, since it may give rise to an explicit time dependence of the strain or strain rates, due to transient creep, also referred to as primary creep (Reference Petrenko and WhitworthPetrenko and Whitworth, 1999). Transient creep is commonly evaluated in terms of a power law

with a prefactor, A. If the exponent takes the value β = 1/3, Eqn (5) is known as Andrade creep in dense polycrystalline ice (Reference Petrenko and WhitworthPetrenko and Whitworth, 1999).
The continuum description (Eqns (1–3)) is valid on length scales large compared with the microstructural scales. This can be regarded as the definition of a representative elementary volume (REV), which is in the order of millimeters (Reference Kaempfer, Schneebeli and SokratovKaempfer and others, 2005). A cube of snow of a few millimeters side length, which is the size typically analyzed by μ-CT experiments, represents the smallest unit to which the above continuum description can be applied. A μ-CT scan can be thought of as taking a snapshot of the snow structure in the control volume between the X-ray tube and a sensor at a fixed vertical position, z, in the laboratory frame of reference. A μ-CT scan thus measures the Eulerian density and densification rate, ∂p/∂t. According to Eqn (1) this comprises two contributions, (1) an advective contribution, v∂p/∂z, due to new material entering or leaving the control volume and (2) the strain-rate contribution,  , due to intrinsic material deformation. Only the latter is related to the constitutive equation via Eqn (3).
This has to be contrasted to a Lagrangian measurement, where the densification is measured in a frame of reference attached to a material element. In a Lagrangian frame of reference, mass conservation (Eqn (1)) simply reads

in terms of the material derivative, D/Dt = ∂/∂t + v∂/∂z. A Lagrangian measurement of density, ρ, and densification rate, Dρ/Dt, is directly related to the strain rate,  , which allows us to address properties of the constitutive law through Eqn (3).
2.2. Isothermal metamorphism
In parallel with visco-plastic deformation, snow undergoes metamorphism. The driving force for isothermal metamorphism is the differences in surface energy between different parts of the snow structure. This induces mass transfer, which is commonly (Reference Legagneux, Taillandier and DomineLegagneux and others, 2004; Reference Legagneux and DomineLegagneux and Domine, 2005; Reference Kaempfer and SchneebeliKaempfer and Schneebeli, 2007; Reference Löwe, Spiegel and SchneebeliLöwe and others, 2011) interpreted in the manner of classical Ostwald ripening, as explained by the Lifshitz–Slyozov–Wagner (LSW) theory (Reference Lifshitz and SlyozovLifshitz and Slyozov, 1961; Reference WagnerWagner, 1961) for an assembly of spheres. While the sphere case can be solved analytically, this is not possible for a bicontinuous structure such as snow. In analogy to the increase of the average sphere radius in the LSW theory, isothermal snow ripening is generally analyzed by the decrease in SSA, as the simplest indicator for the complicated processes during metamorphism. It has been widely confirmed (Reference Legagneux and DomineLegagneux and Domine, 2005; Reference Kaempfer and SchneebeliKaempfer and Schneebeli, 2007) that the decrease of the SSA can be well characterized phenomenologically by a decay law of the form

where τ and n are parameters of the model. Monte Carlo simulations that take into account pore diffusion and surface diffusion are also highly compatible with this relation (Reference Vetter, Sigg, Singer, Kadau, Herrmann and SchneebeliVetter and others, 2010). Exponent n is expected to signal the dominant process of underlying mass transport (Reference Legagneux, Taillandier and DomineLegagneux and others, 2004; Reference Legagneux and DomineLegagneux and Domine, 2005; Reference Kaempfer and SchneebeliKaempfer and Schneebeli, 2007; Reference Löwe, Spiegel and SchneebeliLöwe and others, 2011). This power-law regime can be observed after the crossover time, τ, which is, however, difficult to reach experimentally (Reference Legagneux and DomineLegagneux and Domine, 2005). The inverse quantity, 1/τ, defines a characteristic rate of SSA decrease, which is expected to depend on snow density (Reference Legagneux and DomineLegagneux and Domine, 2005), due to an enhanced mass transfer for a denser arrangement of grains. This density dependence is analogous to the effect of volume fraction on the coarsening rate in the LSW theory (Reference Ratke and VoorheesRatke and Voorhees, 2002).
3. Sample Preparation
In order to investigate the impact of external mechanical stresses on new snow settlement it is particularly important to prepare snow samples with identical structural characteristics. Experiments have to be reproducible and this requires careful sample preparation, because of the fragile structure of new snow. Since new snow has large natural variations in the microstructure and it is inherently difficult to collect well-defined new snow samples in the field, we used artificial snow that mimics natural snow but is grown in the laboratory. This was done using a snowmaker (in a similar way to Reference NakamuraNakamura, 1978). In a cold laboratory at an ambient temperature of −25°C, a box of water is heated to +30°C. A fan blows cold air over the warm water surface to produce a flow of supersaturated air. The air then rises through a net of nylon wires, promoting nucleation. Under these temperature conditions dendritic ice crystals grow, and these are broken off by shaking the wire and fall as snow. (For further details see Reference Löwe, Spiegel and SchneebeliLöwe and others, 2011.) The fresh snow was collected and put into a cooler at −60°C. At this temperature metamorphism is minimized (Reference Kaempfer and SchneebeliKaempfer and Schneebeli, 2007) and is hardly detectable, and the microstructure of the new snow was thus preserved until we prepared the samples for the creep experiments.
Generally the snowmaker produces snow that also contains large directionally grown ice crystals, which are rather unrealistic for naturally fallen snow. They may lead to different material properties when compared with natural snow if sieved directly in the sample holders (Reference Gergely, Schneebeli and RothGergely and others, 2010). To avoid this we employed a pre-sieving procedure through a sequence of vibrating meshes with decreasing mesh size, down to 500 μm, for ∼30 min. Thus, larger ice crystals were discarded and we obtained grain sizes typical of natural snow (Reference FierzFierz and others, 2009). By keeping only finer snow, a smaller REV was obtained. In this way, snow densities of ∼100 kg m−3 were produced, which fit well with the 10 : 1 forecasting rule of thumb, which states that new snow height is ten times the snow water equivalent (Reference McGurk, Azuma, Kattelmann and ShaferMcGurk and others, 1988; Reference Judson and DoeskenJudson and Doesken, 1999; Reference Roebber, Bruening, Schultz and CortinasRoebber and others, 2003). To mimic snowfall conditions the pre-sieved snow was manually sieved into the μ-CT sample holders. A rotating table allowed uniform filling and preparation of multiple samples at the same time. The μ-CT sample holders were polyetherimide (PEI) cylinders of ∼18 mm diameter (Fig. 1). As shown below, this procedure gave rise to very similar values of initial densities and SSA.
Schematic of the snow-filled sample holder with a weight on the top of the snow layer.

In addition, we were interested in varying the initial density without damaging the structure under otherwise identical conditions. This was achieved by placing the samples on a vibrating plate for 0.5–1.5 min directly after sieving. Snow crystals are only poorly sintered at this stage and the vibrations enabled particle rearrangements, which resulted in a higher packing density, similar to dry granular media (Reference Richard, Philippe, Barbe, Bourlès, Thibault and BideauRichard and others, 2003). Though it was not possible to adjust the density to prescribed values, this procedure allowed us to study the main influence of the initial density.
For all samples, filling levels of snow in the sample holders were adjusted by carefully removing snow with a center bit that fits the 18 mm inner diameter of the sample holder. In this way identical filling levels of 15 mm height were attained for all samples without compacting them. All samples were sealed with a cap to disable sublimation and stored in a box at −60°C to preserve the state until measurement. To avoid temperature fluctuations when taking out individual samples, the storage box was insulated by several-centimeter-thick styrofoam walls and also contained a steel plate at the bottom.
4. X-Ray Micro-Computertomograph Measurements
One hour before starting a m-CT measurement the appropriate sample was taken out of the −60°C cooler and put in a cold laboratory that was kept at constant temperature of −20°C, to allow thermal equilibration. To simulate varying depths of the sample in the snowpack, different loads were applied, by placing weights on top of the snow layer before sealing the sample holder. The weights were steel or aluminum cylinders of 18 mm diameter. We calculated a nominal stress from the cross-sectional area and the applied load. The resulting nominal stresses applied on top of the snow were 0, 133, 215 and 318 Pa. For a density of ∼100 kg m−3 this corresponds to burial depths of 0, 10, 20 and 30 cm, all of which are reasonable values for common snowfall events. Using weights instead of real snow enabled us to keep sample heights small and thereby limit perturbation from the contact area of the sample with the boundary. In contrast to the gradual stress increase found in natural conditions during snowfall, the stress was applied instantaneously. If the weight was placed carefully an immediate collapse-like compaction of the sample was avoided. We compared the density profile before and after inserting the weight to confirm that local grain rearrangement only occurred in the vicinity of the weight. Since the diameter of the weight is slightly smaller than the inner diameter of the sample holder, air permeability is allowed and thus the potential influence of moist air compression is eliminated. To capture sample fluctuations and assess reproducibility, two experiments were conducted under identical conditions for each stress. For the sample with a stress of 133 Pa we conducted only one experiment due to scanning problems. (The later experiments, with varying initial densities, were performed on a separate set of samples, where a stress of 215 Pa was always applied.)
The measurements were made using a micro-computertomograph from SCANCO Medical AG (μ-CT 80). We used 45 keVp X-rays and a nominal resolution of 10 mm voxel size. In total, 630 slices of the whole sample diameter were scanned, yielding an observed snow height of 6.3 mm. The scanned region was at a fixed position in the laboratory frame, located vertically in the middle of the snow samples (Fig. 1). A single measurement took ∼2 hours, and 16 measurements were taken with a time-step of 3 hours, leading to a total observation time of 48 hours. The fixed time-step between the measurements guaranteed identical conditions in the μ-CT to avoid measurement bias (e.g. by differences in the X-ray tube temperature). The heat generated by the X-ray tube also perturbed the desired isothermal conditions for the sample. A fan was used to compensate for this. Temperature measurements with a sensor (iButton TMEX) placed in a sample holder confirmed that the temperature increase is <1°C during a measurement. We assumed that these small temperature fluctuations had no significant influence on the snow evolution. In all samples, mass loss by evaporation was strictly avoided by the sealing.
For evaluation of the μ-CT raw data, a cubic volume of 6.3 mm edge length was extracted from the scan region. The size of the cube is sufficiently large to meet the REV requirements found by Reference Kaempfer, Schneebeli and SokratovKaempfer and others (2005) and Reference Coléou, Lesaffre, Brzoska, Ludwig and BollerColéou and others (2001). The position of the cube was chosen between the boundary and the center to minimize potential influences of the lateral boundary and center artifacts in the rotation center of the μ-CT.
To reduce measurement noise, grayscale images were Gaussian-filtered. They were then segmented into binary images of the evaluated volume containing only ice and air. Unfortunately, for new snow it is not possible to determine the threshold by analyzing the histograms of the grayscale images. The ice matrix contains very fine structures of size in the order of the resolution of the μ-CT, which results in a smooth transition between the adsorption coefficients of ice and air. For our snow the density changed almost linearly with variation of the threshold. Different threshold values were used and volume fractions were derived and compared with those obtained from mass and volume measurements of the entire sample. Eventually we maintained a constant threshold for all measurements. With the fitted threshold value we obtained three-dimensional images of new snow, as shown in Figure 2.
Three-dimensional image of a new snow sample. Cube edge length 6.3 mm.

Figure 3 shows a close-up of the image, in which the complex structure of new snow becomes apparent. It is easy to identify structural features at the end of 2 days of measurements, even though they are at a lower position in the scanned volume, due to densification. With the naked eye no major differences between the two images in Figure 3 are visible, but with the μ-CT a more precise analysis is possible.
Zoomed-in image of the new snow structure. Top: structure at the beginning of a series of measurements at t = 0 with SSA0 (top-left edge of Fig. 2). Bottom: same structure for the last scan at t = 45 hours (at a deeper position in the scanned volume).

From the segmented binary image, ice volume fractions were calculated by counting voxels and using triangulation (Reference GuilakGuilak, 1994) to obtain the snow density. Comparison of the two methods reveals that volume fractions obtained by triangulation are always smaller with a constant offset. Henceforth, we use the volume fractions obtained from triangulation. The snow density was obtained by multiplying this with the ice density, ρ ice = 919.7 kg m−3 for T snow = −20°C. The SSA was calculated by dividing the triangulated surface area of the ice matrix by the ice volume. The time series of densities and SSA for each sample were obtained by assigning the respective values to the beginning of each scanning time-step of 3 hours. The initial time, t = 0, was set to the beginning of the first μ-CT scan, which was started exactly 1 hour after putting the sample into the isothermal conditions of the cold laboratory, and 30 min after applying the stress.
To determine the accuracy of the μ-CT measurements it would be necessary to compare multiple scans of an invariant sample. Since this is not possible with our new snow samples, we used an experiment with a different snow type, in which the density of ∼100 kg m−3 remains constant during 2 days of measurements. This series of measurements has a standard deviation of 0.2 kg m−3, which we take as an estimate for our instrumental accuracy. Note that there might be a much higher offset, of up to 5%, for the absolute value of the density, due to the uncertainty of the threshold determination. But, since we focus here on density changes with time, an almost constant offset is not essential for our results.
5. Results and Discussion
5.1. Lagrangian and Eulerian densification
First we address the homogeneous nature of the densification and potential differences between Lagrangian and Eulerian densification rates.
As explained in Section 4, the standard μ-CT scanning and evaluation monitors the densification in a cube fixed in the Eulerian (laboratory) frame of reference. The evaluation cube contains different material at each scanning time. This is displayed in Figure 4, in which horizontally averaged density profiles at three different time-steps are shown as a function of vertical position for an experiment at an applied stress of 215 Pa. The displacement of characteristic maxima and minima of the density profile is easily identified at different times (arrows in Fig. 4), which indicates the advective component of the densification ‘flow’. Thereby mass enters the μ-CT control volume from the top while other mass leaves it at the bottom. The snow inside the cube is advected as a whole; at the same time the structure is strained during 2 days of densification. In order to separate the two effects, we computed the densification in a Lagrangian frame of reference by image registration. To this end, we tagged two horizontal slices (top and bottom of the evaluation cube) at t = 0 and followed their z position in the laboratory frame with time. The vertical displacement was found by computing the maximum cross-correlation of a slice with neighboring slices at a lower position in later scans. The sub-volume bounded by the two slices contains identical parts of the material, i.e. it represents a Lagrangian material element. The densification computed from the sub-volume reduction thus yields the Lagrangian density. The resulting values are shown in Figure 5, where they are compared with the Eulerian measurements, and are shown to be in good agreement. This implies that the sample is homogeneous and the density gradient in the advection term in Eqn (1) can be neglected.
Evolution of the horizontally averaged density profile of one sample in the evaluation window (z-axis oriented downwards).

Density evolution of one experiment with an applied stress of 215 Pa, showing the coincidence of Eulerian (green) and Lagrangian (black) density evolution.

This homogeneity was also confirmed by analyzing the grayscale images, which are the raw data of the reconstructed absorption coefficients before extraction, filtering and segmentation. The time series of the mean gray values at fixed vertical position shows a clear increasing trend of continuous densification. In contrast, the vertical grayscale profile for one measurement shows no density trend with depth. This holds true even for the last measurements with the highest applied stresses.
Both results confirm a homogeneous density distribution in the scanned region at any time during the experiments and the absence of a macroscopic density gradient in the system. Lagrangian and Eulerian densification coincided for the size chosen for the experiment. Consequently, the material derivative in Eqn (6) can be replaced by a conventional time derivative, yielding

This has two important implications: (1) strain rates can be calculated from measured Eulerian densification rates via Eqn (8); and (2) any purely viscous constitutive equation of the form  yields an ordinary differential equation for the densification of a material element. Thus existing parameterizations, η(ρ), can be explicitly compared with our experiments.
5.2. Influence of stress on densification rates
Next we assess the influence of applied stress under otherwise identical conditions. Figure 6 shows increments of the density, ρ – ρ(0), for all measurements for stresses of 0, 133, 215 and 318 Pa. The densities increased continuously with a strongly decreasing rate for the first 20 hours. Except for the 133 Pa applied stress, each series of measurements was made twice. For identical stresses the initial density varied <5% and the densification was very similar. The maximum deviations of the repeated experiments increased with higher stresses. The initial densities for all experiments differed only in a range 102–109 kg m−3. The potential influence of such differences in the initial density on the densification rate is discussed below; here we carry out a comparison which refers to the applied stress.
Rate of densification for different stresses. Except for 133 Pa, two series of measurements were conducted, which are plotted as filled and unfilled symbols. The initial densities ranged from 102 to 109 kg m−3.

As expected, the densification rate increased with applied stress from ∼10% up to ∼15%. But also without any stress a densification of ∼3% was attained. In earlier work the densification during isothermal metamorphism in the absence of an external stress was attributed to a sintering stress (Reference Kaempfer and SchneebeliKaempfer and Schneebeli, 2007), i.e. an isotropic mechanism where the snow grains contract in the vertical and lateral directions, independent of gravity. In contrast, simulations (Reference Vetter, Sigg, Singer, Kadau, Herrmann and SchneebeliVetter and others, 2010) indicate an anisotropic densification mechanism, where crystals are disaggregated by metamorphism and fall due to gravity. To further assess the nature of the densification, we address the case without applied stress. In this case the stress is close to zero and the remaining overburden stress caused by the small overlying snow layer on top of the scanned region can be estimated to be ∼5 Pa. For this case we analyzed a larger cylindrical cut-out that contained the whole scanned region (Fig. 1) up to the inner diameter of the sample holder. Thereby we ruled out mass entering the evaluation cube from lateral boundaries. The same densification rate was observed in this case, so density changes can be attributed solely to a squeeze of the structure in the vertical direction, i.e. to axial strains.
Though we cannot directly confirm the details of the mechanism proposed by Reference Vetter, Sigg, Singer, Kadau, Herrmann and SchneebeliVetter and others (2010), we can confirm the anisotropic nature of the densification. Strictly, this contradicts the concept of a sintering stress as an isotropic shrinkage mechanism as observed in metal powders, (e.g. Reference Kim, Gillia and BouvardKim and others, 2003). Even though the impact of metamorphism cannot be strictly captured by an isotropic sintering stress, our results confirm that a phenomenological constitutive law should comprise two terms, an overburden term and a metamorphism term, as suggested by Reference JordanJordan (1991). That is, densification can also be achieved in the absence of an overburden stress.
5.3. Influence of stress on strain evolution
In addition to densification rates, which have an immediate interpretation for the application, we also employ the equivalence of Lagrangian and Eulerian densification (Section 5.1) to calculate strains, which are easier to assess from a mechanistic point of view. To this end, we integrate Eqn (8) over time and compute the strain as ε(t) = In[ρ(t)/ρ(0)]. The results are shown in Figure 7. Corresponding values from the two measurements are averaged for one case of applied stress. Similarly to the density, the strain shows typical transient creep behavior, i.e. strain rate decreasing with time. Such transient creep (also called primary creep) is well known from polycrystalline ice itself (Reference Petrenko and WhitworthPetrenko and Whitworth, 1999; Reference Schulson and DuvalSchulson and Duval, 2009). Likewise, transient creep has been observed for seasonal snow at higher densities (Reference ScapozzaScapozza, 2004; Reference Theile, Löwe, Theile and SchneebeliTheile and others, 2011). Fitting the creep law (Eqn (5)) to our results for each stress gives very good agreement only for the series of measurements with 133 Pa, as shown in Figure 7 with parameters β = 0.67 and A = 0.007. For the other series, there are deviations from a straight line in the log–log plot, though a power law with β ≈ 0.7 is admissible for all measurements. The prefactor, A, depends on the stress and takes values in the range A ≈ 0.001–0.01. However, a power law with an exponent β ≈ 1/3 (plotted as dashed line in Fig. 7), as reported for Andrade creep in dense polycrystalline ice (Reference Petrenko and WhitworthPetrenko and Whitworth, 1999), is not compatible within the range of our observations. A similarly low value of β ≈ 0.4 has also been reported for denser, round-grained snow (Reference Theile, Löwe, Theile and SchneebeliTheile and others, 2011). However, this Andrade-like creep was not attained until after 3 days. It is important that the creep analysis of new snow is extended to longer timescales, to investigate the presence or absence of Andrade-like creep.
Strain evolution for different stresses. Single plot for 133 Pa and averaged results for 0, 215 and 318 Pa. A fit of type ε(t) = Atβ is plotted for 133 Pa with parameters A = 0.007 and β = 0.67 to allow comparison with Andrade creep, which is plotted as a dashed line.

Finally, by averaging the strain rate over the total experiment time of 2 days, we can provide an estimate for the average compactive viscosity, using Eqn (4). Assuming an additional stress of 5 Pa for the weight of the overlying snow within the samples, the obtained values of the viscosity are given in Table 1, together with the final densities after the 2 days of settling. The results are in the same order of magnitude as values in the literature. Reference Bartelt and von MoosBartelt and von Moos (2000) obtained values of ∼109 Pa s at densities of ∼200 kg m−3 and Reference MellorMellor (1975) lists values between 107 and 1010 Pa s in our density range, but at higher temperatures. For a more precise calculation, particularly for the samples without external stress, an additional initial stress term is necessary (Reference DomineDomine and others, 2008), which cannot be determined from our data.
Stress (weight + 5 Pa snow weight), σ, averaged final density after 2 days of settlement,  and viscosity, η, calculated from the strain rate, after Figure 7

5.4. Influence of stress on SSA decrease
To characterize isothermal metamorphism of the samples during the experiments, we monitored the evolution of the SSA. To analyze the influence of the different stress conditions on the SSA evolution, all time series are plotted together in Figure 8. The initial values of SSA were ∼66 mm−1 and varied only by ∼3.5%. This demonstrates that our method of sample preparation leads to highly reproducible snow samples, with regard to the effective particle size in the snow microstructure. Remaining differences of the initial SSA are correlated neither with the initial densities nor with the order in which the particular series of measurements were started. Thus, after sample storage of up to 3 weeks at −60°C, no SSA changes could be observed.
Figure 8 shows an important result, that all samples exhibit the same rate of decrease in SSA: ∼10% over 2 days. To compare the SSA decrease with values in the literature, we fitted Eqn (7) to our data. The fit for the series of measurements at 133 Pa is plotted in Figure 8, and the estimated parameters of the averaged values for all stresses are listed in Table 2. All estimated timescales, τ, are in the order of the total duration of the experiment. Thus durations considered here are not long enough to reliably estimate both the parameters in Eqn (7). Within the range of our observations a fit obtained for one series is likewise compatible with a different series, though the parameters, τ and n, appear to vary significantly. Our estimated n takes generally higher values than found by Reference Legagneux, Taillandier and DomineLegagneux and others (2004), who reported values in the range 3.4–5.0 at −15°C, and by Reference Vetter, Sigg, Singer, Kadau, Herrmann and SchneebeliVetter and others (2010), who estimated n = 2.9 at −19°C.

Parameters τ and n for fits obtained with Eqn (7). The averaged values of the initial SSA are taken from the first measurement of each series
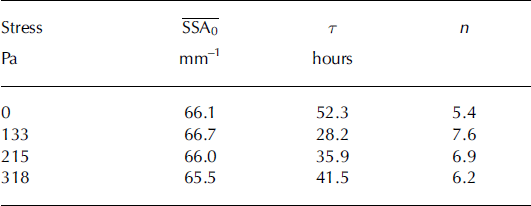
Even for both stress extremes, of σ = 0 and 318 Pa, we find exactly the same SSA evolution over 2 days. Since stresses in the ice matrix are low, a direct influence of the applied stress on the free energy and the coarsening dynamics, as observed in polar ice (Reference Maeno and EbinumaMaeno and Ebinuma, 1983), can be excluded. In our case, the observed independence of metamorphism of external stress translates to coarsening rates which are independent of snow density, as previously hypothesized by Reference Löwe, Spiegel and SchneebeliLöwe and others (2011). This contradicts the theoretical model for isothermal metamorphism derived by Reference Legagneux and DomineLegagneux and Domine (2005), which includes a dependence of the coarsening rates on the density. Such an influence of density is clearly missing in our case. As a consequence of this finding, the following interpretation is suggested. For highly irregular particle shapes, as in the present case, mass fluxes are essentially driven by intra-particle curvature differences. Under the influence of such a local driving force, the inter-particle distance to neighboring grains is of minor importance. However, at a later stage, where crystals evolve to nearly rounded shapes, intra-particle curvature differences vanish and mass fluxes must be driven by inter-particle differences. At this stage a dependence of the SSA decrease on volume fraction might reappear.
5.5. Influence of initial density on densification rates
To study the influence of initial density on densification, we analyzed the time series of eight samples with initial densities adjusted by vibration, as described in Section 3. The results are shown in Figure 9. Initial densities ranged from ∼80 to 123 kg m−3. For all series of measurements, except that with initial density 123 kg m−3 (cyan), initial values varied only by ∼10 kg m−3, and densification rates ranged from 12% to 16% over the 2 day observation period. No systematic effect of the initial density on subsequent densification can be observed. Note that the time series with initial densities 85.8 and 85.2 kg m−3 (red, green) and that with initial density 85.6 kg m−3 (magenta) in Figure 9 have similar initial density and SSA. However, their respective density evolutions differ, which demonstrates that density and SSA alone are insufficient to characterize the snow viscosity.
Density evolution for different initial values. For all samples a stress of 215 Pa was applied.

Only the sample with initial density 123 kg m−3 (cyan) was strongly affected by the vibration, leading to its significantly higher initial density. Its densification rate of 6% in 2 days was well below that of the other samples. The dependence of densification rates on initial density is well known for cohesive granular assemblies under tapping (Reference Fiscina, Lumay, Ludewig and VandewalleFiscina and others, 2010), which reflects the underlying free-volume mechanism. For this sample it seems that the free volume was significantly reduced by the vibrations, which reduced the ease of material rearrangement.
5.6. Influence of initial density on SSA decrease
The influence of initial density on the evolution of the SSA is shown in Figure 10. Initial SSA values were 69–70 mm−1 and did not vary substantially, except for the last two measurements which had slightly lower initial values of 68.2 and 67.5 mm−1, coinciding with the longest storage times of the respective samples. This suggests that these samples are subject to metamorphism even at storage temperatures of −60°C. Note that for the sample with the highest initial density (cyan), the initial SSA did not differ from that of the other samples. This shows that sample shaking led to denser packing, while leaving the SSA invariant.
SSA evolution for samples with different values of initial density.

Again, the rate of decrease of the SSA was always the same and independent of the initial density. This is consistent with the findings reported in Section 5.4 for varying stresses (Fig. 8), where density differences were not imposed initially but develop due to different stresses. Only the sample in Figure 10 with initial density 79.7 kg m−3 (black) shows a slightly slower decrease, which is likely due to the lower initial SSA. We note that storage times in the snowmaker prior to sample preparation could not be monitored precisely, because a single snow-production run took up to 1 day and the snow used was a mixture of old and new crystals. This implies an uncertainty in the initial time which can be demonstrated by taking the SSA evolution from all experiments and shifting the time axis such that all curves coincide at SSA = 64 mm−1, with the first value set to t = 0. This is shown in Figure 11, where nearly all the curves fall onto a single master curve. This nicely demonstrates that all samples can be considered as taken from a unique SSA decrease curve valid for the particular (snowmaker) snow type. This SSA decrease is affected neither by rapid densification from vibration (initial density) nor by slow densification during creep. The uncertainty in the offsets is, for example, caused by the metamorphism which begins in the snowmaker. The duration of this pre-coarsening stage cannot presently be controlled precisely. Using all data, a more reliable fit to Eqn (7) yields parameters n = 3:9 and τ = 61:3. This is the same exponent deduced by Reference Löwe, Spiegel and SchneebeliLöwe and others (2011) for the SSA decay during a year for snowmaker samples at −18°C. Figure 11 also constitutes a striking counter-example for the approach (Reference Domine, Taillandier and SimpsonDomine and others, 2007; Reference JacobiJacobi, 2010) that models the SSA decrease solely as a function of density.
SSA evolution for all samples considered here, including various densities. The time axes were shifted such that all curves coincide at SSA = 64 mm−1 and the first value is set to t = 0. A fit according to Eqn (7) with parameters n = 3:9 and τ = 61.3 is shown in black.

6. Summary and Conclusions
A μ-CT analysis was applied to the densification of new snow in a cold laboratory at −20°C for a single snow type (dendritic new snow). The snow samples were produced by sieving crystals grown in the laboratory to generate numerous samples with reproducible values of initial density and SSA. This enables us to study the concurrent evolution of density and SSA, the most important objective microstructural parameters of snow. Our results provide a first experimental basis which should help to replace empirical indices by objective quantities in constitutive laws of snow.
We addressed the influence of applied external stress and variations in the initial density on densification. Not surprisingly, densification increases with higher external stress and lower initial densities. Interestingly, three of our samples have practically identical values of initial density and SSA but show clear differences in densification. This suggests that density and SSA are insufficient to characterize snow densification and at least one additional, as yet unknown, parameter is required.
We have shown that Lagrangian and Eulerian densification rates measured in the μ-CT coincide, which allows us to deduce strain and strain rates from Eulerian density measurements. We have identified a transient creep behavior that is significantly different to that in denser snow or polycrystalline ice, where Andrade creep is normally observed.
Our results within the simultaneous evolution of SSA and density allow us to assess in greater detail the relevance of the SSA in constitutive modeling of new snow. We have shown that for the utilized snow type the isothermal evolution of the SSA on timescales of 2 days is affected neither by the initial density nor by densification during creep for any of the applied stresses between 0 and 318 Pa. Hence, the effect of densification on the SSA decrease can be neglected. This is an important conceptual advantage for a snowpack model, since the evolution equation for the SSA can be formulated independent of densification modeling. Conversely, the SSA decrease clearly contributes to the densification in the absence of an externally applied overburden stress, σ. The densification of millimeter-sized samples in the absence of an overburden stress is anisotropic and must be caused by gravity effects. It seems important to develop a constitutive law which comprises both an overburden term and a metamorphism term, to account for densification at almost zero overburden.
Our results motivate further improvement of laboratory-based snow-production methods. By empirically correcting for existing uncertainties in the age of the snow crystals produced we have obtained a highly consistent picture of SSA decrease. These data can be consistently fitted to the common empirical evolution law to deduce a reliable exponent for the SSA decrease after only 2 days. This exponent coincides with the findings of a previous experiment under the same conditions, in which its value could be estimated only after several weeks. This suggests that details of the SSA decrease can be similarly investigated from carefully prepared experiments of short duration, which are much more convenient to conduct.
The generalization of our results to different snow types and higher temperatures is still speculative. Higher temperatures imply both a faster decrease of SSA and faster visco-plastic deformation. A variation of temperature can, for example, prove that the densification rate at zero overburden is related to the SSA decrease if both processes are governed by identical Arrhenius factors. Our results at low temperatures have guided specific ideas concerning the interplay between densification and SSA decrease that will be investigated further for higher temperatures and different crystal types. This will require some experimental adaptation, in order to cope with relatively fast changes of the structure close to the melting point.
Acknowledgements
This work was funded by the Swiss National Science Foundation (SNSF) through grant No. 200021_132549. We thank M. Schneebeli and two anonymous reviewers for helpful comments and discussions on the manuscript.



