

Introduction
In February 2021, after a yearlong inquiry, the key Australian gaming regulator deemed Crown Resorts unfit to hold a license for its new luxury facility, Sydney’s Barangaroo tower. The report focused on allegations of money laundering and links with international criminal syndicates, particularly through the activities of former executive chairman James Packer. Even after Packer stepped down from the top job, his investment company Consolidated Press Holdings (CPH), which held a substantial portion of Crown shares, was given regular business updates about the firm’s activities, and Packer acted as a de facto director after leaving his executive role. Packer was enabled through several directors who were nominated to represent CPH on the Crown board, and who released confidential financial figures without the knowledge of Crown shareholders. Interlocks based on cross-ownership, in this case, meant “lines of reporting were blurred, risks were not properly identified, and conflicts and potential conflicts were not recognized.”Footnote 1
Interlocking directorates—connections between firms based on shared board members—have the potential to create substantial governance and ethical issues for corporations. Collusion, corruption, resource capture, poor monitoring, and the stagnation of ideas can result from directors who are too closely tied to one another.Footnote 2 As we will see later, as many as 30 percent of all top board seats have been occupied by an interlocked director in Australia, and yet high-profile cases of corruption such as Crown Resorts are relatively rare. The vast majority of interlocks are fairly benign, with members developing trust, sharing expertise, and forming professional communities of practice. The key question is: What separates helpful interlocks from harmful ones?
Research has identified the contingent nature of interlocking directorates, with outcomes dependent on the nature of the tie and the context in which it was formed. Thus, to fully understand the impact of interlocks for governance and business strategy, we need to understand the foundations on which they were built. Internationally, there have been substantial efforts to understand the creation of director networks over the twentieth and early twenty-first centuries. Interlocking directorates are said to stem from attempts by banks to control industrial companies; companies’ attempts to obtain necessary skills and resources; the class cohesion of members; control by the state; or practical restrictions of geography. In Australia, research on the cause of interlocking directorates is disconnected, addressing particular moments in time or assuming networks were largely determined by the economy-wide logic of Australian capitalism. This is the first systematic, longitudinal analysis of the antecedents of interlocking directorates in Australia, contributing to these important global conversations.
This article will progress as follows: the next section reviews the relevant literature on interlocking directorates, particularly insights regarding their antecedents. The third section outlines the method used to visualize Australia’s interlocking directorates over time and to assess the various explanations for their cause. The fourth and fifth sections examine the empirical material, with the sixth section concluding that Australia’s director network has been characterized by a relatively consistent long-run level of interconnection, but substantial variation in the factors responsible for interlocks. Rather than responding to the broader logic of Australian capitalism, interlocking directorates were instead dependent on the practicalities of board member work. Corporate governance regulations, the progress of professions, banking and prudential standards, and the form of large organizations encouraged ties that were built on professional expertise and proximity within major Australian economic hubs. Some distinctive firm behavior occurred in the 1980s, with the movement of money and directors within business groups contributing to a substantial proportion of ties based on market control. These findings can inform policy makers, regulatory bodies, and scholars, highlighting the importance of understanding the contingency and foundations of interlocks when assessing their potential for harm.
Literature and Theoretical Framework
Interlocking directorates has been a vibrant area of research since the U.S. Clayton Act of 1914, which prevented interlocks between firms in the same industry, sparked public and scholarly interest as to their nature and impact.Footnote 3 Interlocking directorates are said to stem from a range of firm and individual motivations, with positive impacts including the diffusion of innovation, reduction of environmental uncertainty, access to finance or resources, and improvements in prestige or reputation. On the other hand, interlocks, particularly very dense networks, have been found to contribute to collusion and market control, the power of financial institutions, resource capture by the state, or the stagnation of ideas and practices.Footnote 4 The vast majority of research is contemporary, examining the structure, causes, and consequences of director networks over a short duration. Up to 75 percent of the literature focuses on North America, with interest in cases in Asia, Europe, and Latin America following over the past two decades.Footnote 5 This comparative literature has highlighted the contingent nature of interlocking directorates, in which the institutional, sociopolitical context and cultural foundations of the corporate sector influence the type and shape of director networks.Footnote 6 Contemporary Australian research has primarily focused on network structure, with limited and disconnected attempts to understand their cause or impact.Footnote 7 A generation ago, Carroll and Alexander compared the director networks in Australia and Canada, attributing differences primarily to sociopolitical context rather than regulations or corporate governance.Footnote 8 As such, Australia has, so far, been bypassed by the recent geographic expansion and comparative approach of interlocking directorates research.
Internationally, historical research on interlocking directorates has examined structure, causes, and impacts on firm strategy, observing changes in networks over time.Footnote 9 Rather than continuous data, which are prohibitively laborious to examine, scholars generally examine firms at various benchmarks. Historical research has, much like the contemporary literature, primarily examined the United States and Europe. Arguably the most prominent historical work in this area is by Mizruchi, who documented the long stability of the director network in the United States from the early twentieth century through to the 1970s and the decline or unraveling of these connections since the 1980s.Footnote 10 Others have adopted a comparative approach to determine whether the U.S. experience applies elsewhere, with mixed results.Footnote 11 Some have examined the evolution of a global, Atlantic, British Empire, or transnational corporate elite from the nineteenth century to the present, in some cases confirming the presence of an emerging global corporate community.Footnote 12 A recent comparative project adopted a broader geographic scope, with contributions on various countries in Europe, North and South America, and Asia.Footnote 13 Chapters examined the evolution of director networks in various countries across the twentieth century, highlighting the contingency of interlocks based on macro (political and economic environment), meso (social structure of the network), and micro (individual stakeholders) factors. As with the contemporary literature, Australia has not yet been included in these conversations, with business historians often mentioning interlocks alongside other forms of firm connections, but with no systematic, longitudinal appraisal of their creation.
The literature, as it stands, presents the following opportunities to contribute. Research on interlocking directorates has identified the importance of comparative research, with the nature of ties dependent on the institutional, sociopolitical, and cultural foundations of the corporate sector. Historical research has reaffirmed the importance of a contingent approach, highlighting the role of macro, meso and micro factors that have shaped interlocking directorates in various countries across the twentieth century. Australia has largely been left out of the contemporary and historical comparative work on director networks, with most examining the structure of networks over a short duration rather than a systematic, contextual appraisal of their creation over time. As the first longitudinal and contextual analysis of the foundations of interlocking directorates in Australia, this article contributes to our understanding of Australian business history and to important global discussions on this topic.
The antecedents of interlocking directorates include both the firm’s motivations to connect with others and the individual directors’ motivations to expand their reach. From the firm’s perspective, interest in interlocking directorates began, in part, through fear of the power of banks in the corporate sector in the early twentieth century.Footnote 14 The financial hegemony perspective has argued that interlocking directorates follow the contours of the banking sector and its clients, with bankers sitting on the boards of debtors to monitor the firm’s financial position and degree of risk. In the 1980s, Mintz and Schwartz found that banks and insurance companies in the United States controlled the flow of capital, and therefore banking directors constituted the broad balance of power in the corporate sector.Footnote 15 Some research has found similar centrality for financial institutions.Footnote 16 However, others have found that the control of banks represents a particular stage of capitalist development, with a more reciprocal relationship between banks and industrial firms in other places and other points in time.Footnote 17 For Australia, Rolfe found some support for financial hegemony in the 1960s, and Etheridge in the 2000s, though it is unclear whether these insights apply consistently over time.Footnote 18
Interlocking directorates may also be part of the firm’s resource dependence. Firms exist in various states of reliance on suppliers, competitors, financiers, and so on, and interlocks may be a formal expression of the firm’s attempt to obtain the correct resources. Business groups, for example, may send directors up or down the hierarchy to sit on other boards in the group.Footnote 19 Interlocks with suppliers can ensure compliance with contracts, and connections with banks may constitute the reciprocal flow of information.Footnote 20 Interlocks between firms in the same industry may reflect the flow of knowledge or more insidious aims such as a cartel.Footnote 21 The human capital of directors is also a resource that can guide multiple board appointments, with useful expertise improving company decision making (labor) and convincing shareholders that their investments are in safe hands (symbolic).Footnote 22 Individual directors may also seek resources from interlocks, with multiple directorships often corresponding with career progression and increased remuneration.Footnote 23
The development of interlocks may represent elite class cohesion. Recommendations from existing board members often shape recruitment, meaning those who are members of a similar social milieu are more likely to hold interlocked board positions.Footnote 24 Class cohesion may be an attempt to improve board monitoring functions, with a strongly networked elite group of board members able to exert more power over managers than if connections were dispersed. The literature has found that interlocking directorates have developed through a broad range of elite characteristics, including geographic proximity, family connections, education at prominent schools and universities, along gender or ethnic lines, and through political connections.Footnote 25 For Australia, scholars have similarly identified the importance of kinship, class, gender, ethnicity, and social connections for the structure of board ties.Footnote 26 This suggests an important role for the interpersonal factors that shape interlocking directorates.
The state may also shape interfirm connections. Governments have influence over the regulatory environment, including the “rules of the game,” such as corporate governance guidelines and legislation preventing certain types of interlocks.Footnote 27 The state can engage with the corporate sector directly through state-owned enterprises, with directors reflecting the concurrent corporate and political role of these organizations.Footnote 28 There have also been “sliding doors” between political and corporate elites, with directors often moving between public service roles, corporate lobbying, and interlocked directorships.Footnote 29
Finally, geography can influence interlocks through the location of company head offices and the distribution of production facilities.Footnote 30 Some have found a growing transnational corporate community through the prevalence of multinational firms and progressive ease of travel. In other instances, “industrial districts” remain important, with firms agglomerating to access shared infrastructure, institutions, and a pooled labor market.Footnote 31 In the case of interlocking directorates, in addition to the industrial, trade, and institutional benefits of proximity, the highly specialized nature of board membership means large firms can access pools of appropriate labor within particular corporate “hubs.” Even within a growing “global elite,” some have found that interlocking directorates are still concentrated around prominent nations, regions, and cities.Footnote 32
Interlocks can thus stem from a range of corporate and individual motivations, including attempts at bank control, obtaining necessary resources, class cohesion of members, the control of the state, or the practical restrictions of geography. This article is the first to interrogate these various causes of interlocking directorates in Australia in a longitudinal and contextual way. Through an understanding of the individuals and firms involved in each tie, it will compare the relative salience of financial hegemony, resource dependence, class cohesion, and geography as explanations for the formation of interlocks over time.
Methods
Data are based on board members of Australia’s top one hundred nonfinancial companies and the top twenty-five financial firms, ranked based on total assets, at eight benchmarks from 1910 up to the present (1910, 1930, 1952, 1964, 1986, 1997, 2007, 2018).Footnote 33This scope responds to practical considerations regarding data availability—particularly Fleming et al.’s identification of Australia’s “big end of town.”Footnote 34 Focusing on large firms also facilitates the identification of a “corporate elite” in each year, with members able to access substantially more power and influence relative to others in the corporate sector.Footnote 35The scope additionally allows comparison with international comparative research on interlocking directorates.Footnote 36 Data on board members were found in trade publications, annual reports, and records held by government regulators, with coverage of 90–95 percent in each year. Those who sat on multiple company boards within the top 125 companies in a single year were classified as part of the director network. Those firms in the sample that shared at least one director were then classified as part of the firm network.
Social network analysis was used to analyze the firm and director networks. Membership of a board indicates connections between participants—board members generally attended ten or more meetings a year, and each member likely had some form of contact with others. If a director sat on two or more top company boards, this indicates a tie between those companies, as well as ties between the relevant board members.Footnote 37 More shared board memberships, or more shared directors, indicate relatively stronger ties between firms and individuals. Selected networks have been visualized through NetDraw. NetDraw’s spring-embedding function, with Gower scaling, has been used to place nodes with more shared ties closer together and move those with fewer shared ties farther apart.Footnote 38 This means that individuals with more shared boards are visually clustered together. UCINET has been used to analyze the firm and director networks. Firm-level analysis includes the number of connected firms, the number of ties, and the number of firms in the main component (those who can access one another through one or more degrees of separation). Individual-level analysis includes the number and proportion of interlocked directors and board positions occupied by interlockers. Network density, or the proportion of ties observed relative to the maximum total ties, has been calculated for both the firm and individual networks. These measures are used to compare the overall structure of the director and firm networks over time.
Each set of ties (ties held by a single director in a single year) has been assessed against the various theoretical explanations of interlocking directorates. Firm information has been gathered through archival and company sources listed earlier as well as various secondary sources.Footnote 39 Individual information has been gathered through extensive prosopography (collective biography) research published elsewhere that details each member’s place of birth and residence, education, career trajectory, family and political connections, and social groups.Footnote 40 The firm and individual data are inherently limited to those for whom there is information. Newspapers reports and secondary sources are biased toward prominent, famous, or unorthodox firms and individuals. They also tend to present a celebratory or triumphalist view of the actors’ activities. Company archives are often very detailed but limited in their breadth of coverage, with many companies having no surviving archival materials. Although largely unavoidable, the combination of several different types of sources has been used to mitigate the extent of this bias and provide a contextual and comparative appraisal of the creation of interlocking directorates over time.
Regarding financial hegemony, ties associated with directors who sat on financial and nonfinancial firms identify the potential for bank control. Details regarding the career trajectory of interlocked directors, particularly their status as executive or career bankers, provides clarification regarding the likelihood of financial hegemony. Geographic proximity is measured through the location of company headquarters, as listed in annual reports or registration paperwork. The analysis of class cohesion is based on prosopography data, with directors classified as those with hereditary power (board memberships obtained through family members or marriage), the political and public service elite (politicians or prominent members of the public such as military leaders), or the professional middle class (professional training and career). While most clearly fell into specific designations, there was some overlap, for example, some members obtained board positions through a combination of family connections and professional training. In these cases, the directors exhibited the class markers of both the professional middle class and the hereditary corporate elite, and so were coded as both in the database.
Regarding resource dependence, ties associated with directors who connected firms in the same industry code (based on the Standard Industrial Classification [SIC] code) indicate their possible motivation to share knowledge or develop cooperative partnerships. Ties that reflected cross-ownership also represent the flow of resources. Directors’ ability to deploy relevant expertise has been an important resource for company boards, working to improve decision making and as a symbol of the firm’s trustworthiness.Footnote 41 As such, expertise may have been developed within a single industry, but a director’s established reputation and authority was subsequently useful across multiple domains. The database categorizes those who had markers of expertise relevant to corporations, regardless of the specific directorates they held in the benchmark year. This included professionals such as engineers, scientists, journalists, accountants, and lawyers, as well as those who developed expertise within companies such as founders, members of family firms, or professional managers.Footnote 42
Each set of ties has been considered together. The presence of a particular factor has been weighted by the number of ties in the set with, for example, the presence of ties with a banking firm in a set of six going further to explain interlocks in that year compared with the same in a set of two ties. The various categories have been reported as a proportion of total ties in that year, enabling the comparison of networks of different sizes. Each set of ties often included multiple explanations with, for example, membership of the elite professional class (class cohesion) co-occurring with expertise (resource dependence). While these data are limited by endogeneity, they reflect the inductive practice of observing multiple theoretical explanations in a particular event simultaneously, and the complexity and nuance of historical research.
Overall Patterns
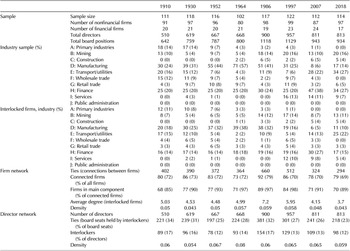
Australia’s “big end of town” has undergone substantial change since 1910. In the early twentieth century (1910 and 1930), a diverse assemblage of top firms reflected the importance of primary industries, shipping, and wholesale trade for Australia’s economy (Table 1). Through the mid-twentieth century, big business was disproportionately located in manufacturing, with higher capital needs meaning the sector comprised seventy-one (57 percent) of top companies in 1964.Footnote 43 More recently, deregulation of utilities and transport markets has increased the number of top firms in this sector (Table 1, E), comprising 22 percent and 27 percent of the group in the 2007 and 2018 benchmarks. Interlocked firms represented a similar cross section of industries. The proportion of interlocked manufacturing firms peaked in 1964, then decreased to about 10 percent of the sample in 2018. The number of interlocked financial firms was largest in 2007 (27 percent), mirroring the expansion of insurance and institutional investors following compulsory superannuation legislation from the 1980s.Footnote 44 Interlocked utilities and transport firms were greatest in the 1910 benchmark, and again in 2007 and 2018.
Sample and network structure a

a Sample based on top one hundred nonfinancial and top twenty-five financial firms. Industry classifications based on Standard Industrial Classification (SIC) code. Network metrics calculated with UCINET.
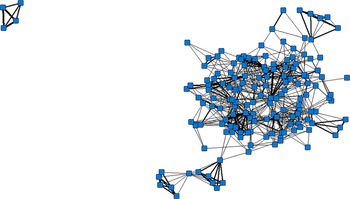
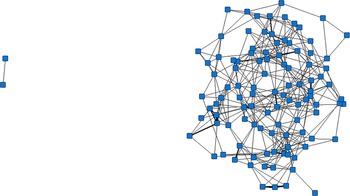
While the composition of interlocked firms changed alongside the corporate sector, the overall pattern of interlocking was reasonably consistent over time. In each benchmark, interlocks connected 70–80 percent of the sample of firms, with the vast majority (85–98 percent) tied within a single component (Table 1). Around 30 percent of board seats in each benchmark were held by interlockers, with modest variance between 23 percent in 2018 and 34 percent in 1910. The “typical” network included around two hundred board seats, with eighty to one hundred interlockers, and each firm sharing four to five directors. In 1986 and to a lesser extent 1997, there was an increase in the number of ties and actors, with the network of the 1980s including 154 directors, 381 interlocked board positions, and 7 ties per firm. The 1986 director network (Figure 1) had a main component that included all but four of the interlocked directors in that sample. Although overall network density was similar to that of other years, there were a greater number of individuals, pockets of very dense connections, and certain directors who were the main conduits to outer parts of the group. To compare with a more typical year, the 2007 director network had fewer nodes and more even coverage of ties (Figure 2).
The 1986 director network. Nodes denote interlocked directors. Ties indicate individuals sat on at least one board together, thicker ties indicate they sat on more than on board together. Network produced with NetDraw, using the spring-embedding function with Gower scaling.

The 2007 director network. Nodes denote interlocked directors. Ties indicate individuals sat on at least one board together, thicker ties indicate they sat on more than on board together. Network produced with NetDraw, using the spring-embedding function with Gower scaling.

The overall level of interlocking indicates that Australia’s interlocking directorates operated under a consistent modus operandi, with some aberrant behavior in the 1980s. This differs from generalised explanations of Australia’s interlocks, with some arguing that interfirm connections were determined through the model of family and personal capitalism before the 1970s, with deregulation through the “neoliberal” phase then contributing to a more competitive and independent sector.Footnote 45 Overseas, research on the shape of interlocking directorates attributes change similarly, with Mizruchi timing the dispersal of the U.S. director network at around 1970, due to a decline of a collective corporate vision prompted by deregulation, changes in commercial banking, and a cultural shift toward maximizing shareholder value.Footnote 46 Work on the United Kingdom, Italy, Finland, Austria, Switzerland, and Taiwan has similarly identified a period of coordination from the early twentieth century through to the postwar period and a dispersal of connections since the 1970s.Footnote 47 However, the Australian data more closely resembled those from the Netherlands, Argentina, Chile, France, and Japan, with changes in the level of interlocking occurring independent of the liberal/coordinated economy dichotomy and instead due to a range of pragmatic considerations.Footnote 48 These factors are discussed in the following sections.
Antecedents of the Director Network
On the surface, Australia’s director network was relatively stable, with long-run maintenance of a similar level of connection and an industry mix reflecting the broad contours of the corporate sector. However, assessing each set of interlocks reveals substantial changes in the factors responsible for the corporate network in each benchmark, with substitution of various factors contributing to a similarly connected network over time. Rather than being determined by changes in the economy-wide constitution of Australian capitalism, the director network was dependent on practical considerations for board member appointments and company leadership, namely trends in corporate governance, logistics, business groups, and the professions.
Financial Hegemony
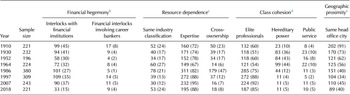
Directors consistently sat on the board of both financial and nonfinancial firms, with on average 35 percent of all interlocks occurring with a financial institution (Table 2). In some cases, interlocks created by executive bankers indicated control or monitoring of lending. For example, Sir Douglas Forbes was a key long-term manager of the Queensland National Bank and then of the National Bank of Australasia after the two banks merged. He was noted as establishing bank control over nonfinancial firms, sitting on the board of clients in the 1940s and 1950s “to manage interests acquired by the bank from clients during times of recession and drought.”Footnote 49 In the 1952 benchmark, Forbes was on the board of the National Bank and client Castlemaine Perkins, and in 1964, he was also on the board of client manufacturing firm Boral. Both likely were associated with bank monitoring from Forbes. Similarly, in 1964, R. J. Abercrombie, the general manager of the Bank of New South Wales was also on the board of the bank’s client Associated Portland Cement Manufacturers. Abercrombie’s executive banking role was likely important for the industrial firm’s access to finance.
Interlocks analysis a

a The sample size is based on ties in the director network, specifically the number of board seats occupied by interlockers (Table 1). Percentages, as a proportion of the sample in that year, are reported in parentheses. Percentages do not add up to 100: each set of interlocks may have been associated with multiple categories simultaneously, and some sets were impossible to assign to certain categories due to lack of evidence.
b “Interlocks with financial institutions” indicates ties linked to individuals who sat on the board of at least one financial and one nonfinancial firm, a small proportion of which were formed by career bankers.
c “Same industry classification” specifies ties associated with individuals who sat on boards within the same Standard Industrial Classification (SIC) code; “expertise” indicates ties associated with directors who held some form externally recognized knowledge useful to corporations; “cross-ownership” measures ties linked to individuals who sat on the board of companies that were also connected through ownership structures.
d “Class cohesion” (elite professionals, hereditary power, and public service) indicates ties associated with directors who fell into these three class categories.
e “Geographic proximity” is indicated by ties associated with individuals who sat on the board of companies that had the same head office city.
However, financial hegemony was not a foregone practice, with ties between banks and their clients often unrelated to control or monitoring. In terms of the general context, Merrett and Sykes have argued that although banks and large companies were often loyal to one another through the early and mid-twentieth century, banks rarely took equity positions in clients, lending exposures were monitored through documents and correspondence rather than through board members, cross-directorates were a fraction of the firms with whom the banks did business, and the directors did not necessarily represent the banks’ interests when doing so.Footnote 50 In the empirical data, based on the career paths of the directors, most were interlocked with banks due to their general corporate expertise and established reputations in nonfinancial firms. They were thus industry insiders rather than finance professionals and likely had very little influence over day-to-day provision of lending. For example, in 1910, only seventeen ties (8 percent) between banks and industrial firms were formed by a career or executive banker, with the remaining ties involving directors with general expertise such as accounting or those with long-standing careers with the nonfinancial partner firms (Table 2). Other benchmarks throughout the early and mid-twentieth century exhibited similar characteristics, with 1–5 percent of ties involving executive bankers creating interlocks between financial and nonfinancial firms.
As time went on, firms diversified their financial business, engaging with multiple banks simultaneously. By the 1970s and 1980s, there was increasing diversity of players in the corporate lending market in general—including finance companies, merchant banks, life insurance offices, state banks, and foreign lenders—as well as a loosening of loyalty between banks and companies.Footnote 51 The boom of the corporate sector and the creation of large, diversified business groups (see “Resource Dependence”) increased the capital needs of large companies to the point that they engaged with multiple banks simultaneously. For these “corporate raiders,” Sykes estimated that as many as thirty or forty banks were involved at any one time, each with very little knowledge of the firm’s exposure to other institutions.Footnote 52 While this information was often not made public, for those who did list their bankers, there is certainly evidence in the interlocks database of diversification. Advertiser Newspapers listed seven banks in 1986; Monier Ltd listed the Commonwealth Bank of Australia (CBA), Westpac, and foreign lender Citibank; and Southern Farmers listed the State Bank of South Australia, Australia and New Zealand Bank, Westpac, CBA, and the Bank of New Zealand. Similarly, in 2018, Sonic Healthcare listed a bewildering array of a dozen banks, including the major Australian institutions and multinational banks from Europe, Asia, and the United States. Ties between banks and industrial firms comprised around the average (35 percent) in 1997 and 2007, declining to 15 percent in 2018 (Table 2). The proportion of ties involving executive bankers was also average at around 5 percent each year. The low presence of interlocks formed by banking insiders, combined with the general diversification of banking relationships, further diluted the scope for financial hegemony in the late twentieth and early twenty-first centuries.
Resource Dependence
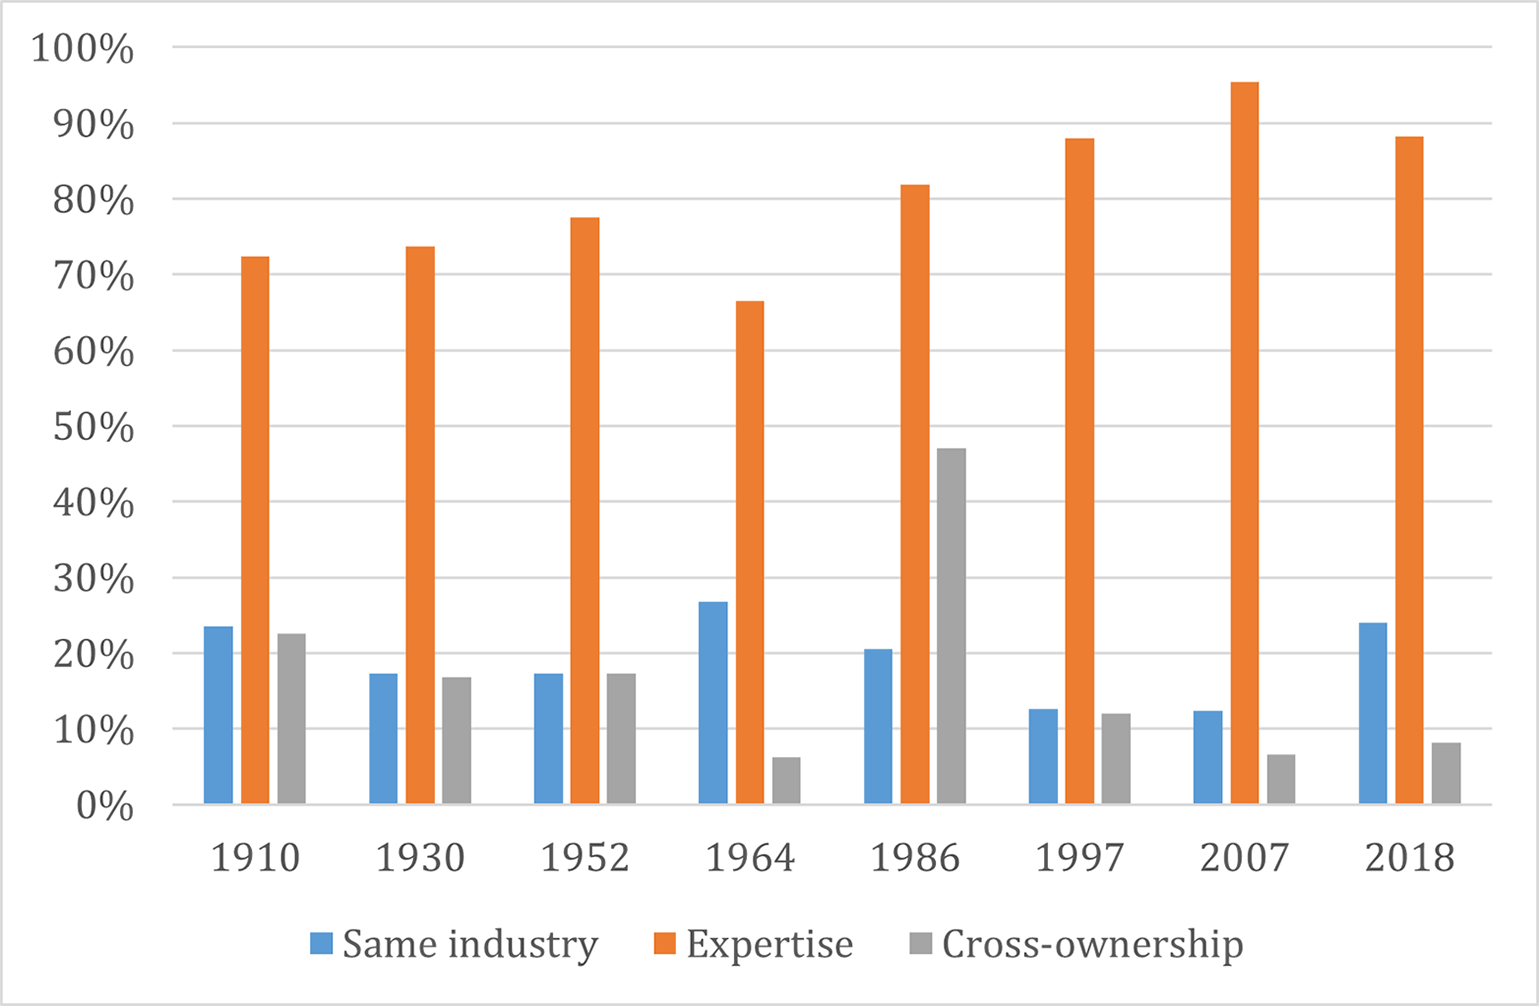
Compared with the relative unimportance of financial control, resource dependence was crucial for Australia’s director network. The deployment of expertise in particular was an important factor motivating interlocks, contributing to, on average, 80 percent of ties across benchmarks (Table 2, Figure 3). Australian corporations employed trusted professionals and businessmen since the late nineteenth century, with their knowledge improving decision making and their symbolic role giving shareholders confidence in firms where they never set foot on the farm or in the factory.Footnote 53 Over time, expertise became more important for the network, with the proportion of ties attributable to corporate knowledge increasing from an average of 73 percent from 1910 to 1964 to 88 percent from 1986 to 2018. This was in part due to changes in Australia’s occupational structure, with an increase in the number of professionals in society corresponding with a greater proportion of corporate leaders with training in key professions.Footnote 54 Expertise also became more important for corporations from the 1980s, with high-profile collapses, increased presence of institutional investors, and more comprehensive disclosure requirements necessitating trusted professionals to navigate new regulatory environments.Footnote 55 Microeconomic reform, also from the 1980s, increased competition between firms, encouraging the modernization of management, marketing, and human resource strategies and subsequently the place of these general business professionals in executive and director roles.Footnote 56 Deregulation of Australia’s banking industry also created much more complicated, global capital movements, with specialized investment bankers, stockbrokers, and finance professionals valued as part of a board’s skills matrix.Footnote 57
Resource dependence, proportion of total ties. Based on data in Table 2.

In a small number of cases (around 10 percent of all ties associated with expertise; and 25–50 percent of ties between firms in the same industry), specific operational knowledge contributed to directorates within the same industry. For example, Maurice Mawby (1964 cohort) established his expertise over the mining industry as a junior analyst on the 1921 Broken Hill technical commission of inquiry into miners’ phthisis and pneumoconiosis. He was seventeen years old. By the age of twenty, he was a company metallurgist in charge of up to eighty employees and went from there to various safety and strategic roles in Australia’s mining industry.Footnote 58 Kathryn Fagg’s (2018 cohort) expertise as a chemical engineer has translated to directorships in chemical and construction manufacturing, including Boral and Incitec Pivot. Science and engineering, as very specialized professions of use in a narrow range of operational matters, generally attracted these targeted directorships.
Far more common was the use of expertise across diverse board memberships. Accreditation and qualifications fulfilled directors’ symbolic requirements, with prominence at the top echelon of the corporate world seen to provide useful insights for company decision making, regardless of specialty. These particular markers of expertise responded to changes in the general nature of professional work across the twentieth century, from porous barriers to entry and training through an apprenticeship model, to the enclosure of professional networks and university courses, to strong hierarchical institutions in which rank-and-file members were vastly separate from elite professionals in the top echelon.Footnote 59 For example, in the accounting profession, Raymond Goward and Harry D. Giddy (1952 cohort) were trained through clerkships with key accounting firms and, in the early 1930s, were awarded the title of “chartered accountant.” To compare, toward the end of the twentieth century, corporate leaders who came through the accounting hierarchy had an undergraduate degree and professional accreditation and often worked for one of the four large multinational corporate accounting firms.Footnote 60 Other key corporate professions—law, engineering, banking, management, finance, and so on—went through a similar process of enclosure, with expectations for corporate leaders adjusting accordingly.
Useful expertise was also recognized through company founders and managers who worked through the ranks of top firms. In these cases, much like professionals, markers of expertise were developed in one industry but later leveraged through diverse directorships. For example, James Burns (1910 cohort) was the cofounder of top shipping firm Burns Philp. He then sat on boards across several industries, including banking and insurance.Footnote 61 Similarly, James Gosse (1952 cohort) started work as a clerk in top wholesaler George Wills & Co, remaining with the firm for fifty years and eventually becoming its managing director. In 1952, after his retirement, Gosse remained on as a board member, as well as serving on the boards of a range of other firms in banking, mining, and shipping.Footnote 62 More recently, Geoff Dixon’s (2007 cohort) long career with airline Qantas was leveraged to a directorship in media, and Philip Garling’s (2018 cohort) career, culminating as CEO of construction firm LendLease, translated to board memberships in construction and energy.
Although human capital, through expertise, was the most important board “resource” for most of the twentieth and early twenty-first centuries, a small number of cases (13 percent on average) represented structural ownership or business group connections (Table 2). Cross-ownership accounted for an exceptionally high number and proportion of interlocks in 1986, from 14 ties (6 percent) in 1964, 179 ties (47 percent) in 1986, and 37 ties (12 percent) in 1997. This was due to a change in form and increased importance of business groups in this decade. Leading firms engaged in unrelated diversification through speculative takeovers, prompted by the decline of their traditional industries and enabled by the newly deregulated banking system and lax auditing and regulatory requirements.Footnote 63 Several diversified business groups were in the database of top companies, and they used executive directors to solidify their control over firms further down the hierarchy. For example, conglomerate Elders IXL and associated companies Elders Finance and Elders Resources created a cluster of at least seven shared directors and twenty-two ties. The decline of cross-ownership and interlocking directorates was largely due to the collapse of most diversified business groups in the late 1980s and early 1990s. More generally, microeconomic reform, an overhaul of banking prudential regulation, and improvements in corporate governance and disclosure aimed to reduce the presence of cartels, including those that involved interlocking directorates.Footnote 64 As a result, the proportion of ties associated with cross-ownership declined to 7–12 percent.
Class
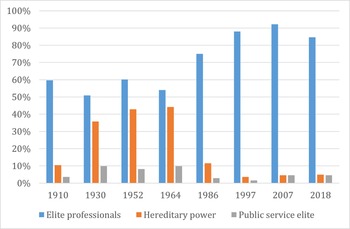
The popular conception of the corporate elite is one of intergenerational wealth and nepotism.Footnote 65 In Australia, scholars have implied “insidious forms of control exercised by elite groups of entrepreneurs and their families,” with less polemic work similarly establishing the importance of key families in big business before the 1970s.Footnote 66 While family or hereditary capitalism may have been important for Australian business more broadly in the early and mid-twentieth century, interlocking directorates have reflected, for the most part, the top rungs of the professional middle class. Those appointed to multiple top board positions, and thus with substantial power over firm decision making, generally held markers of professionalism rather than reflecting the contours of family ownership. From 1930 to 1964, an average of 40 percent of ties were associated with some form of family connection (membership of family firms, ties achieved through marriage, or intergenerational directors). Male members of prominent corporate dynasties such as the Elder, Hoskins, Baillieu, Myer, and Murdoch families held directorships of multiple companies. Marriage was important to the functioning of the director network, particularly in the mid-twentieth century when women were excluded from board membership. While marriage operated in the corporate sector in various ways, the most direct hereditary path involved appointing the son-in-law rather than the daughter to the family company board.Footnote 67 Intergenerational directors involved sons holding similar professional accreditation and working alongside their fathers or assuming positions upon their fathers’ retirement. For example, Montague Cohen (1910 and 1930 benchmarks) was a prominent Melbourne-based corporate lawyer. His only child, Harold, also trained as a lawyer, worked in the family law firm, and in 1930 sat on the same company boards as his father.Footnote 68
Although hereditary connections were relatively important in the middle decades of the twentieth century, even in these years, they were easily surpassed by the 50–60 percent of ties associated with professionals. There was some overlap between the two categories, with almost half (40 percent) of the hereditary power ties also involving membership within the professional middle class. Members of prominent families often trained in key professions and leveraged both expertise and family connections to obtain board positions. In the case of Harold Cohen, while his training as a lawyer was possibly independent of his father’s influence, his membership on several top company boards would have been less likely without his father’s standing. From the 1980s, members of the professional middle class strengthened their hold over the corporate elite, with the proportion of ties increasing from 54 percent to 75 percent between 1964 and 1986 to an average of 88 percent since the 1990s (Figure 4). The professionalization of company boards in Australia was similar to the role professionals and managers played in interlocking directorates in the Netherlands, the United States, and Switzerland.Footnote 69 While increased presence of the professional middle class has been attributed to the unraveling of director networks elsewhere, in Australia, their dominance since the 1980s has been associated with greater homogeneity in the group and the maintenance of a similar level of connection.
Class cohesion, proportion of total ties. Based on data in Table 2.

While there have been important connections between business and political elites in Australia, this was not common among interlocked directors.Footnote 70 The sample of firms excludes government enterprises, removing a likely source of connection between government and private firms that has been important elsewhere.Footnote 71 However, analysis of the sample before and after the suite of government privatizations in the 1980s and 1990s reveals very few interlocks between those former government companies and other corporations. Similarly, analysis of directors’ professional and career backgrounds shows little presence of “sliding doors” between politicians or senior public servants and corporate board positions. Members of the political or public service (including military) class accounted for, on average, 6 percent of ties (Table 2).
Geography
Geographic proximity can be a key practical consideration for interlocked directors. Proximate directors can easily attend board meetings and manage the competing time and scheduling requirements of multiple directorships. Directors can also socialize with others in the community, becoming members of similar suburbs, social groups, and sports clubs.Footnote 72 Aside from the needs of directors, large firms are also more likely to be located in national or regional hubs, as they can access shared infrastructure, institutions, and pools of labor.Footnote 73 In Australia, interlocks were directly related to the location of company headquarters, with 91 percent of ties between firms headquartered in the same city in 1910, with this declining steadily to 40 percent in 2018 (Table 2). The overwhelming importance of geographic proximity in the early twentieth century was due to time and prohibitive cost associated with transportation, ensuring that firms largely looked to local elites for their directors. Over time, transport became cheaper and easier, meaning directors could sit on the boards of firms in different cities, and firms could look farther afield for directors. However, despite reasonably easy and cost-efficient transport, 40 percent of ties in the most recent benchmark were between firms in the same city, outstripping the prominence of many other factors. As has been found for other countries and regions, key economic hubs—principally Australia’s largest cities of Sydney and Melbourne—remain important for the development of interlocking directorates.Footnote 74
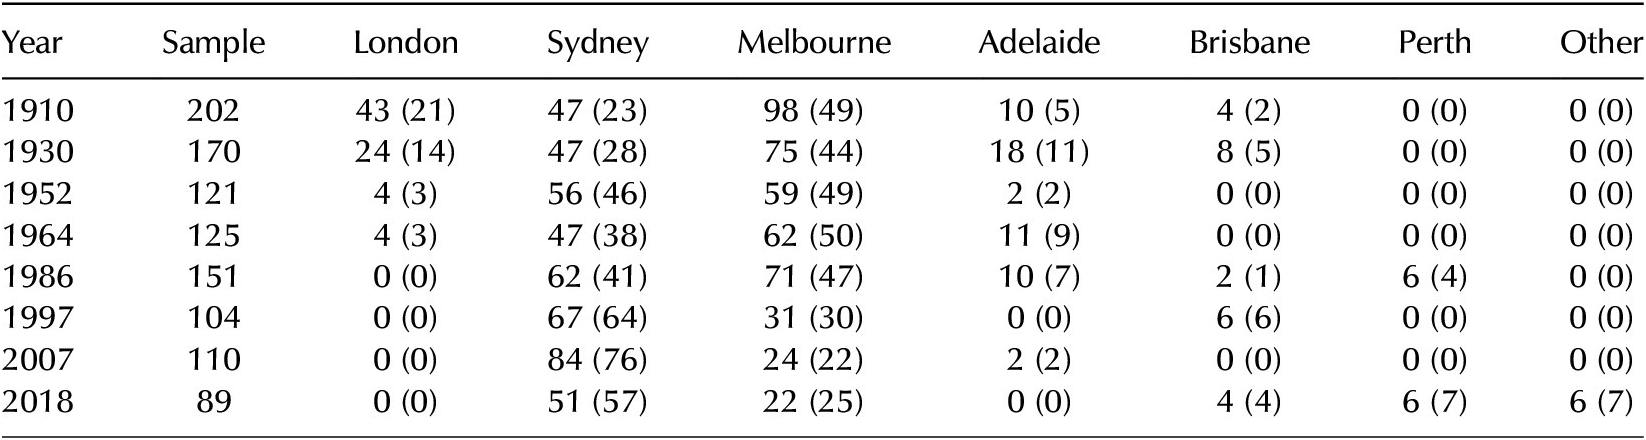
Multinational firms (MNEs) have influenced the geography of Australia’s interlocks. In the early twentieth century, many top firms were headquartered in London as “free-standing companies”—drawing on the city’s elite directorate and share investors, while maintaining operations in the antipodes.Footnote 75 In 1910, eighteen interlocked firms and twenty individuals were based in London, resulting in forty-three ties (Table 3). London-based free-standing companies became much less common throughout the twentieth century, with existing firms gradually shifting their head offices to Australian cities. British MNEs were also replaced by waves of firms from the United States, Europe, and Asia throughout the post–World War II decades.Footnote 76 The free-standing company model was largely abandoned, with MNEs required to establish Australian subsidiaries with local head offices and boards. As such, modern MNEs have their infrastructure and personnel based within major Australian hubs with, for example, the Australian subsidiary of British Petroleum based in Melbourne, U.S. firm Coca-Cola Amatil (now Coca-Cola Europacific Partners) based in Sydney, and U.S. mining firm Newmont Australia based in Perth (as of 2018).

Discussion and Conclusions
As the first longitudinal and contextual analysis of the antecedents of interlocking directorates in Australia, this article expands our understanding of Australian business history and provides important comparative insights to understand the contingent nature of director networks around the world. Australia’s director network has been characterized by a consistent long-run level of interlocks but substantial variation in the factors responsible for their formation. Interlocks were not determined by changes in the economy-wide logic of Australian capitalism, but have been, as Ville and Merrett argue for Australia’s general business environment, sans doctrines, with practical considerations of board member work overshadowing ideological considerations.Footnote 77 Geographic proximity, for example, has been a key factor determining Australian interlocks, and even with the affordances of a transnational corporate elite, 40 percent of ties in 2018 were between firms headquartered in the same city. Similarly, financial hegemony was uncommon, not necessarily from lack of appetite, but from practical considerations derived from the regulatory environment, the importance of geographic proximity, and the value of expertise. The Australian case thus more closely resembles the findings of Ginalski and colleagues for Switzerland, with a more “reciprocal” relationship between banks and industrial firms.Footnote 78
Resource dependence, particularly human capital in the form of expertise, was the most important factor responsible for Australia’s director network. Some expertise was used within a particular industry, but often training and accreditation developed in one domain established directors’ usefulness across diverse board member work. From the 1980s, expertise became more important for the network, with changes in the occupational structure, more stringent auditing and disclosure requirements, microeconomic reform, and deregulation of the banking industry prompting an increase in the recruitment of professionals. Mirroring the prominence of expertise in the corporate elite, interlocks were also dominated by the top echelons of the professional middle class. While family or hereditary ties may have been important for Australian business more broadly, this was not widespread among interlocked board members. Instead, recruitment to multiple board positions was shaped by the occupational requirements of directors and trends in corporate governance and regulation. This was similar to other locales where considerations for directors’ occupations—through professionals and managers—dominated appointment decisions.Footnote 79
Business groups and cross-ownership, a key long-standing anxiety of interlocking directorates, were unimportant overall, though their presence in the 1980s substantially increased the proportion of ties used for interfirm collusion and control. As with the example of Crown Resorts in the “Introduction,” this was a key area where interlocks were harmful to Australia’s corporate sector, with the widespread movement of people and money between entities contributing to the collapse of most of these large groups from the late 1980s, a severe recession in Australia, and criminal charges laid at the feet of those responsible.Footnote 80 While the specific mechanisms by which these interlocks operated requires more targeted research, this case highlights the importance of understanding the foundation of interlocks when assessing their potential for harm. The function and impact of director networks depends on the foundations on which they are built, and while they are not always bad, in some circumstances they can be. As such, future research could focus on a better understanding of the link between antecedents and impacts, providing more information to prevent adverse governance, monitoring, and ethical outcomes in the future.
Acknowledgment
I would like to thank Professor David Merrett and two anonymous reviewers for constructive feedback. Research supporting this article was supported by funding from Macquarie University, with research assistance from Drs. Ben Wilkie and Lauren Samuelsson.