Introduction
The health and body condition of endangered animals provide fundamental information in conservation biology. Body condition is an important indicator for evaluating habitats and the effects of anthropogenic activities and pollution (Johnson, Reference Johnson2007; Clukey et al., Reference Clukey, Lepczyk, Balazs, Work and Lynch2017; Rodriguez & Heck, Reference Rodriguez and Heck2020). Body condition has been assessed using various techniques, including haematology and plasma biochemistry (Stevenson & Woods, Reference Stevenson and Woods2006; Wang et al., Reference Wang, Li, Jiang, Chi, Cheng, Cheng, Sun and Yu2020; Kophamel et al., Reference Kophamel, Illing, Ariel, Difalco, Skerratt, Hamann, Ward, Méndez and Munns2022). The morphological body condition indices of endangered animals have been widely employed because they are easy to use and inexpensive. Various morphological condition indices have been suggested (Stevenson & Woods, Reference Stevenson and Woods2006; Peig & Green, Reference Peig and Green2010; Sönmez, Reference Sönmez2019); Fulton's condition index is one of the most common and is calculated as the bodyweight divided by the cube of body length (Ricker, Reference Ricker1975).
The body condition of sea turtles has recently become an important topic regarding their conservation as affected by marine debris (Clukey et al., Reference Clukey, Lepczyk, Balazs, Work and Lynch2017) and fibropapillomatosis prevalence (Rossi et al., Reference Rossi, Sánchez-Sarmiento, Santos, Zamana, Prioste, Gattamorta, Ochoa, Grisi-Filho and Matushima2019). Body condition indices based on morphometry have been widely used since Bjorndal et al. (Reference Bjorndal, Bolten and Chaloupka2000a) calculated Fulton's condition index for juvenile green turtles (Chelonia mydas) as bodyweight/(straight carapace length [SCL])3. In addition, the haematology and plasma biochemistry of sea turtles have also been investigated (Anderson et al., Reference Anderson, Harms, Stringer and Cluse2011; Komoroske et al., Reference Komoroske, Kewison, Seminoff, Deheyn and Dutton2011). Morphological condition indices of sea turtles include not only the Fulton's index, but also simple mass and length ratios (Patino-Martinez et al., Reference Patino-Martinez, Marco, Quiñones and Hawkes2012), relative factors incorporating mass-length relationships (Fukuoka et al., Reference Fukuoka, Narazaki and Sato2015), and residuals from the mass-length relationship (Jessop et al., Reference Jessop, Hamann and Limpus2004).
Fulton's condition index is a widely used simple metric, but it should be carefully interpreted. The index assumes isometric growth; therefore, comparing values between different size classes may be problematic (Peig & Green, Reference Peig and Green2010). Interspecific or interpopulation comparisons are also difficult when body dimensions or growth patterns differ. In sea turtles, Fulton's condition index has been widely used as a rough measure of nutritional status and health (Bjorndal et al., Reference Bjorndal, Bolten and Chaloupka2000a; Diez & van Dam, Reference Diez and van Dam2002) and values exceeding 1.2 have conventionally been interpreted to indicate a good body condition (Norton & Wyneken, Reference Norton and Wyneken2015; Maulida et al., Reference Maulida, Hadi, Imron and Reischig2017; Adnyana et al., Reference IBW, MJA, Hitipeuw and Dethmers2020). However, the threshold value may change, considering that there are interspecific and/or intraspecific differences in the body shape and growth pattern of sea turtles (Wabnitz & Pauly, Reference Wabnitz, Pauly, Palomares and Pauly2008; Álvarez-Varas et al., Reference Álvarez-Varas, Véliz, Vélez-Rubio, Fallabrino, Zárate, Heidemeyer, Godoy and Benítez2019). Additionally, the carapace length, which has been used as a representative length for calculating the index, can be measured in several ways, such as by using the SCL vs curved carapace length (CCL) (Bolten, Reference Bolten, Eckert, Bjorndal, Abreu-Grobois and Donnelly1999). Evaluating these differences is important to establish a baseline condition index for sea turtles.
In this study, we reviewed the literature on morphological condition indices in sea turtles and conducted a meta-analysis of Fulton's condition index in sea turtles. This study summarizes the prevalence of various morphological condition indices among sea turtle species to elucidate the knowledge gap regarding their health status. We then evaluated the differences in Fulton's condition index between species and size classes to establish baseline sea turtle body conditions. We also evaluated differences in the index values when different length metrics were used.
Materials and methods
Literature review
We searched for studies using Google Scholar and Web of Science with the queries ‘sea turtle’ and ‘body condition index’ or ‘Fulton index’ on 5–7 August 2020 and 12–13 April 2021. We additionally searched PubMed on 5–6 April 2022, but did not include references published after April 2021. We reviewed the references therein and retained literature on morphological condition indices.
Meta-analysis of Fulton's condition index
The average and standard deviation (SD) or standard error (SE) of Fulton's condition indices (kg cm−3 × 10⁴) calculated from the SCL in the literature were used. When the data appeared only in figures, they were extracted using Plot Digitizer 2.6.8 (Huwaldt, Reference Huwaldt2001). When the data were presented as median, maximum, minimum and/or quantile values, we estimated the average and SD using the method reported by Wan et al. (Reference Wan, Wang, Liu and Tong2014). The SCL can be measured as the length from the anterior point at the midline to the posterior notch at the midline (minimum SCL [SCLmin]) or the tip (standard SCL [SCLnt]) (Bolten, Reference Bolten, Eckert, Bjorndal, Abreu-Grobois and Donnelly1999). We could not differentiate these measurements in the following analysis as the literature sometimes did not clearly present which was used; however, we simulated the effects based on conversion equations (see below). We excluded studies that reported the body condition indices of unhealthy turtles to explore the standard baseline values for healthy turtles. Unhealthy turtles included dead and injured turtles, those noted as ‘unhealthy’ in the original texts, and those with tumours with scores (Work & Balazs, Reference Work and Balazs1999) of 2–3 or labelled as ‘developed’, ‘moderate’ or ‘severe’; however, we retained the data of turtles with ‘mild’ tumours or a tumour score of ~1. We also removed literature that may have contained data on the same individuals based on the authors, locations and study periods.
In addition to the dataset from the literature, we calculated Fulton's condition indices from the unstructurally searched literature that provided the bodyweights and SCLs of individuals. Furthermore, to complement the data of hawksbill turtle (Eretmochelys imbricata) hatchlings, we measured the bodyweight and SCL of 20 hawksbill turtle hatchlings each from 8 and 13 nests at Lankayan and Selingaan hatcheries, Sabah, Malaysia, respectively. We calculated the Fulton's condition index and its average ± SD at each rookery by randomly selecting one hatchling from one nest. A full list of literature compiled in this study is provided in Supplementary Table S1.
Fulton's condition index has mainly been reported for three species: green turtles, loggerhead turtles (Caretta caretta) and hawksbill turtles (see Results). Therefore, we focused on these three species in this study. Additionally, we categorized the data into one of three size classes: ‘hatchling and post-hatchling’, ‘small juvenile’ and ‘large juvenile and adult’. The ‘hatchling and post-hatchling’ category included hatchlings measured just after emergence from the nests and post-hatchlings that were reared for several months (SCL of ~15 cm). The ‘small juvenile’ and ‘large juvenile and adult’ categories were separated at 50 cm SCL according to Bjorndal et al. (Reference Bjorndal, Bolten and Martins2000b), Gorham et al. (Reference Gorham, Clark, Bresette, Bagley, Keske, Traxler, Witherington, Shamblin and Nairn2014) and Hamabata et al. (Reference Hamabata, Nishizawa, Kawazu, Kameda, Kamezaki and Hikida2018). The ‘small juvenile’ category included juveniles recruited to their foraging grounds after oceanic dispersal, with SCLs ranging from 20–50 cm. The ‘large juvenile and adult’ category included nesting turtles, matured males and large juveniles with SCLs larger than 50 cm. When it was difficult to clearly assign these categories to the literature because average and SD or SE values were reported from individuals including both small juveniles and large juveniles or adults, categorization was based on whether or not the average SCL exceeded 50 cm. Regional information was also adopted and categorized into ‘North Atlantic’, ‘South Atlantic’, ‘North-west Pacific’, ‘Central Pacific’ and ‘East Pacific’ based on the regional management units (RMU) in Wallace et al. (Reference Wallace, DiMatteo, Hurley, Finkbeiner, Bolten, Chaloupka, Hutchinson, Abreu-Grobois, Amorocho, Bjorndal, Bourjea, Bowen, Dueñas, Casale, Choudhury, Costa, Dutton, Fallabrino, Girard, Girondot, Godfrey, Hamann, López-Mendilaharsu, Marcovaldi, Mortimer, Musick, Nel, Pilcher, Seminoff, Troëng, Witherington and Mast2010) and distinct population segments (DPS) in Conant et al. (Reference Conant, Dutton, Eguchi, Epperly, Fahy, Godfrey, MacPherson, Possardt, Schroeder, Seminoff, Snover, Upite and Witherington2009) and Seminoff et al. (Reference Seminoff, Allen, Balazs, Dutton, Eguchi, Haas, Hargrove, Jensen, Klemm, Lauritsen, MacPherson, Opay, Possardt, Pultz, Seney, Van Houtan and Waples2015).
The differences in Fulton's condition index between species and size classes were tested by random-effects modelling using the metafor package (Viechtbauer, Reference Viechtbauer2010) in R ver 4.0.0 (R Core Team, 2020). First, we assumed a multilevel model that included regions as the upper level and studies as the lower level. We confirmed that the variance attributable to regions was small by the likelihood ratio test and variance distribution calculation using the dmetar package (Harrer et al., Reference Harrer, Cuijpers, Furukawa and Ebert2019) (see Results); thus, we estimated a single-level model that included studies as random effects. Overall averages and 95% confidence intervals (CIs) were estimated for each species and size class.
Effects of different carapace length measurement
For the simulation, we randomly generated SCLnt values (N = 100) from a uniform distribution ranging from 30–100 cm. We then estimated the ratios of SCLnt3/CCLnt3 or SCLnt3/SCLmin3 using the relationship between SCLnt and CCLnt (i.e. the CCL measured from notch to tip) and SCLnt and SCLmin based on regression analyses (Limpus, Reference Limpus1992; Teas, Reference Teas1993; Iwase & Kuroyanagi, Reference Iwase and Kuroyanagi1999; Seminoff et al., Reference Seminoff, Jones, Resendiz, Nichols and Chaloupka2003; Peckham et al., Reference Peckham, Maldonado-Diaz, Koch, Mancini, Gaos, Tinker and Nichols2008; Okamoto et al., Reference Okamoto, Ouchi, Ishihara and Kamezaki2012; Bjorndal et al., Reference Bjorndal, Schroeder, Foley, Witherington, Bresette, Clark, Herren, Arendt, Schmid, Meylan, Meylan, Provancha, Hart, Lamont, Carthy and Bolten2013, Reference Bjorndal, Chaloupka, Saba, Diez, van Dam, Krueger, Horrocks, Santos, Bellini, Marcovaldi, Nava, Willis, Godley, Gore, Hawkes, McGowan, Witt, Stringell, Sanghera, Richardson, Broderick, Phillips, Calosso, Claydon, Blumenthal, Moncada, Nodarse, Medina, Dunbar, Wood, Lagueux, Campbell, Meylan, Meylan, Burns Perez, Coleman, Strindberg, Guzmán-H, Hart, Cherkiss, Hillis-Starr, Lundgren, Boulon, Connett, Outerbridge and Bolten2016, Reference Bjorndal, Bolten, Chaloupka, Saba, Bellini, Marcovaldi, Santos, Bortolon, Meylan, Meylan, Gray, Hardy, Brost, Bresette, Gorham, Connett, Crouchley, Dawson, Hayes, Diez, van Dam, Willis, Nava, Hart, Cherkiss, Crowder, Pollock, Hillis-Starr, Muñoz Tenería, Herrera-Pavón, Labrada-Martagón, Lorences, Negrete-Philippe, Lamont, Foley, Bailey, Carthy, Scarpino, McMichael, Provancha, Brooks, Jardim, López-Mendilaharsu, González-Paredes, Estrades, Fallabrino, Martínez-Souza, Vélez-Rubio, Boulon, Collazo, Wershoven, Hernández, Stringell, Sanghera, Richardson, Broderick, Phillips, Calosso, Claydon, Metz, Gordon, Landry, Shaver, Blumenthal, Collyer, Godley, McGowan, Witt, Campbell, Lagueux, Bethel and Kenyon2017; Table 1). These ratios indicate the ratios of SCLnt-based vs CCLnt-based (or SCLnt-based vs SCLmin-based) Fulton's condition indices as follows:

Equations for converting the curved carapace length of sea turtles measured from notch to tip (CCLnt) or notch to notch straight carapace length (SCLmin) to the notch to tip straight carapace length (SCLnt)

We used three equations to convert SCLnt to CCLnt for green, loggerhead and hawksbill turtles estimated from Atlantic and Pacific data. To convert SCLmin to SCLnt, we used equations estimated from Atlantic turtles because we could not find conversion equations for Pacific turtles.
Results
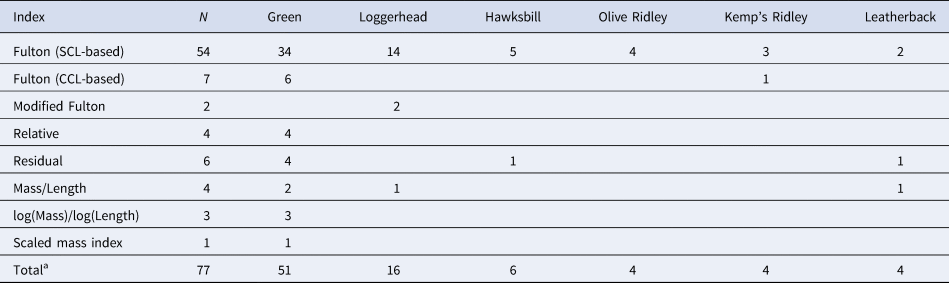
We identified 77 articles that reported morphological condition indices. Most studies focused on green (N = 51), followed by loggerhead (N = 16) and hawksbill turtles (N = 6) (Table 2, Supplementary Table S2). Fulton's condition index was calculated based on the SCL in most studies (N = 54); however, some studies reported CCL-based indices (N = 7) (Table 2, Supplementary Table S2). Two studies calculated the modified Fulton's index considering carapace length × carapace width × carapace depth, instead of (carapace length)3 (Barco et al., Reference Barco, Law, Drummond, Koopman, Trapani, Reinheimer, Rose, Swingle and Williard2016; Cammilleri et al., Reference Cammilleri, Calvaruso, Pantano, Cascio, Randisi, Macaluso, Vazzana, Caracappa, Giangrosso, Vella and Ferrantelli2017). The mass-to-length ratio (mass/SCL) has been used for hatchlings (van de Merwe et al., Reference van de Merwe, Ibrahim and Whittier2005, Reference van de Merwe, Hodge, Whittier, Ibrahim and Lee2010; Patino-Martinez et al., Reference Patino-Martinez, Marco, Quiñones and Hawkes2012) or post-hatchlings (Mansfield et al., Reference Mansfield, Wyneken, Rittschof, Walsh, Lim and Richards2012); however, Fulton's condition index has recently been applied to hatchlings (Banerjee et al., Reference Banerjee, Frey, Kurle, Perrault and Stewart2020; Fleming et al., Reference Fleming, Perrault, Stacy, Coppenrath and Gainsbury2020).
Number of studies that have reported the morphometric body condition index for each sea turtle species

a Some studies have reported indices of multiple species or multiple indices; therefore, the total numbers are different from the summation of the columns. See Supplementary Table S2 for further details.
We included studies that reported the SCL-based Fulton's index for green, loggerhead and hawksbill turtles in further meta-analyses. After removing potential duplicate data and adding the data calculated in the present study, data from 68 studies were used to evaluate the differences between species and size classes (Supplementary Table S3). The multilevel model showed that regions and studies explained 25.7 and 34.3% of the variation, respectively, and the effects of regions were not significant (likelihood ratio test: χ2 = 0.27, P = 0.603). The single-level model attributed 53.3% of the total variance to between-study heterogeneity but showed a significant effect of moderators (Q = 186.4, df = 8, P < 0.0001). A high Fulton's condition index was observed in ‘hatchling and post-hatchling’ turtles (averages for green, loggerhead and hawksbill turtles: 2.24 [95% CI: 1.87–2.61], 2.13 [1.97–2.28], 2.06 [1.82–2.30], respectively) (Figure 1). The CIs overlapped between ‘small juveniles’ and ‘large juveniles and adults’ for each species (green turtle: 1.31 [1.25–1.36] and 1.41 [1.34–1.47], loggerhead turtle: 1.59 [1.45–1.73] and 1.40 [1.33–1.48], hawksbill turtle: 1.09 [0.98–1.20] and 1.26 [1.07–1.45], respectively); however, the value of small juvenile hawksbill turtles was smaller than that of green and loggerhead turtles (Figure 1).
Forest plot of Fulton's body condition index values estimated using meta-analysis. The mean and 95% confidence interval (CI) values are shown in the right column, and the dashed line shows the value of 1.2.

The averages and ranges of estimated SCLnt3/CCLnt3 ratios of green turtles based on equations from Teas (Reference Teas1993), Bjorndal et al. (Reference Bjorndal, Bolten, Chaloupka, Saba, Bellini, Marcovaldi, Santos, Bortolon, Meylan, Meylan, Gray, Hardy, Brost, Bresette, Gorham, Connett, Crouchley, Dawson, Hayes, Diez, van Dam, Willis, Nava, Hart, Cherkiss, Crowder, Pollock, Hillis-Starr, Muñoz Tenería, Herrera-Pavón, Labrada-Martagón, Lorences, Negrete-Philippe, Lamont, Foley, Bailey, Carthy, Scarpino, McMichael, Provancha, Brooks, Jardim, López-Mendilaharsu, González-Paredes, Estrades, Fallabrino, Martínez-Souza, Vélez-Rubio, Boulon, Collazo, Wershoven, Hernández, Stringell, Sanghera, Richardson, Broderick, Phillips, Calosso, Claydon, Metz, Gordon, Landry, Shaver, Blumenthal, Collyer, Godley, McGowan, Witt, Campbell, Lagueux, Bethel and Kenyon2017), Okamoto et al. (Reference Okamoto, Ouchi, Ishihara and Kamezaki2012) and Seminoff et al. (Reference Seminoff, Jones, Resendiz, Nichols and Chaloupka2003) were 0.835 (range: 0.830–0.847), 0.887 (range: 0.865–0.897), 0.867 (range: 0.858–0.887) and 0.805 (range: 0.729–0.842), respectively. The ratios for loggerhead turtles based on equations from Teas (Reference Teas1993), Bjorndal et al. (Reference Bjorndal, Schroeder, Foley, Witherington, Bresette, Clark, Herren, Arendt, Schmid, Meylan, Meylan, Provancha, Hart, Lamont, Carthy and Bolten2013), Okamoto et al. (Reference Okamoto, Ouchi, Ishihara and Kamezaki2012) and Peckham et al. (Reference Peckham, Maldonado-Diaz, Koch, Mancini, Gaos, Tinker and Nichols2008) were 0.791 (range: 0.740–0.816), 0.790 (range: 0.758–0.806), 0.869 (range: 0.853–0.906), and 0.825 (range: 0.819–0.840), respectively. The ratios for hawksbill turtles based on equations from Teas (Reference Teas1993), Bjorndal et al. (Reference Bjorndal, Chaloupka, Saba, Diez, van Dam, Krueger, Horrocks, Santos, Bellini, Marcovaldi, Nava, Willis, Godley, Gore, Hawkes, McGowan, Witt, Stringell, Sanghera, Richardson, Broderick, Phillips, Calosso, Claydon, Blumenthal, Moncada, Nodarse, Medina, Dunbar, Wood, Lagueux, Campbell, Meylan, Meylan, Burns Perez, Coleman, Strindberg, Guzmán-H, Hart, Cherkiss, Hillis-Starr, Lundgren, Boulon, Connett, Outerbridge and Bolten2016), Iwase and Kuroyanagi (Reference Iwase and Kuroyanagi1999), and Limpus (Reference Limpus1992) were 0.861 (range: 0.853–0.865), 0.831 (range: 0.822–0.849), 0.863 (range: 0.825–0.948) and 0.837 (range: 0.829–0.855), respectively. The estimated SCLnt3/SCLmin3 ratios for green, loggerhead and hawksbill turtles were 1.055 (range: 1.049–1.067), 1.061 (range: 1.040–1.114) and 1.016 (range: 1.013–1.023), respectively.
Discussion
Fulton's condition index has been widely applied in sea turtle studies, excluding flatback turtles (Natator depressus). Values of Fulton's condition index based on SCLs ≥1.2 have been interpreted to indicate a relatively good body condition for sea turtles (Norton & Wyneken, Reference Norton and Wyneken2015; Maulida et al., Reference Maulida, Hadi, Imron and Reischig2017; Adnyana et al., Reference IBW, MJA, Hitipeuw and Dethmers2020). Although index values ≥1.3 were generally observed in large green and loggerhead turtles, the meta-analysis in this study supported the adequacy of this threshold for juvenile and adult green turtles and large juvenile and adult loggerhead turtles. This study also indicated further differences in Fulton's condition index between species and size classes; thus, it should be carefully applied on body condition evaluation.
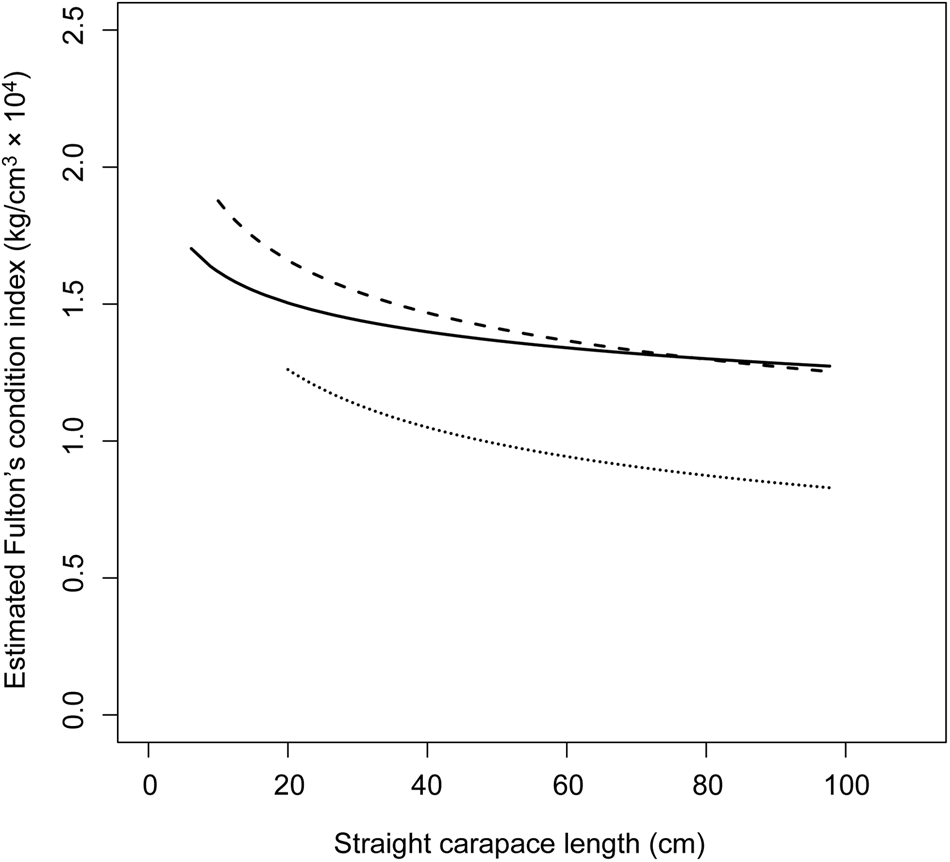
The meta-analysis indicated high Fulton's condition index values for hatchlings and post-hatchlings of all three species. This is to be expected because the bodyweight of sea turtles is not proportional to SCL3, but SCL2.7–SCL2.9 (Wabnitz & Pauly, Reference Wabnitz, Pauly, Palomares and Pauly2008), resulting in a decrease in Fulton's condition index as bodyweight increases (Figure 2). The relationship between bodyweight and SCL also supports the finding that Fulton's condition index of small loggerhead juveniles was lower than that of hatchlings and post-hatchlings, but slightly higher than that of large juveniles and adults. This tendency was not observed in green and hawksbill turtles, which may be because the index values from foraging grounds included both small juveniles and large juveniles or adults, and the categorization was based on the average SCL. Evaluating hatchling and post-hatchling sea turtles using Fulton's condition index requires caution. Additionally, a threshold higher than 1.2 is more suitable to indicate the good body condition of small juvenile loggerhead turtles.
The relationship between Fulton's body condition index and straight carapace length (SCL) estimated from the relationships between bodyweight and SCL in green (Bodyweight = 0.000206 SCL2.895), loggerhead (Bodyweight = 0.000282 SCL2.823) and hawksbill turtles (Bodyweight = 0.000278 SCL2.736) (Wabnitz & Pauly, Reference Wabnitz, Pauly, Palomares and Pauly2008). Green, loggerhead and hawksbill turtles are illustrated by solid, dashed and dotted lines, respectively.

A lower Fulton's condition index was observed for hawksbill turtles, particularly small juveniles. The relationships between the bodyweight and SCL (Wabnitz & Pauly, Reference Wabnitz, Pauly, Palomares and Pauly2008) indicated that the bodyweight of hawksbill turtles in relation to SCL (i.e. Fulton's condition index) is lower than that of green and loggerhead turtles (Figure 2). This difference is likely due to the relatively depressed plastron of hawksbill turtles, which is supported by the relationship between body depth and SCL (van Dam & Diez, Reference van Dam and Diez1998), when compared with loggerhead turtles (Marn et al., Reference Marn, Klanjscek, Stokes and Jusup2015). In addition, carapace widening is observed in juvenile green and loggerhead turtles (Salmon & Scholl, Reference Salmon and Scholl2014), but not in juvenile hawksbill turtles (Salmon et al., Reference Salmon, Coppenrath and Higgins2018), possibly resulting in lower bodyweights of juvenile hawksbill turtles in relation to SCL. Considering the differences in body proportion and the results of the meta-analysis, Fulton's condition index of values of ~1.0 rather than 1.2 could be a threshold for indicating good body condition in juvenile and adult hawksbill turtles.
SCL has been used as the representative body length for calculating Fulton's condition index in sea turtles, as used by Bjorndal et al. (Reference Bjorndal, Bolten and Chaloupka2000a). Some studies measured the CCL but converted it to SCL to calculate the SCL-based Fulton's condition factor (López-Mendilaharsu et al., Reference López-Mendilaharsu, Vélez-Rubio, Lezama, Aisenberg, Bauzá, Berrondo, Calvo, Caraccio, Estrades, Hernández, Laporta, Martínez-Souza, Morales, Quirici, Ríos and Fallabrino2016; Rossi et al., Reference Rossi, Sánchez-Sarmiento, Santos, Zamana, Prioste, Gattamorta, Ochoa, Grisi-Filho and Matushima2019; Lamont & Johnson, Reference Lamont and Johnson2021). We found seven studies that calculated Fulton's condition factor directly using CCL. Fulton's condition index values calculated from the CCL were ~0.81–0.89 times lower than those calculated using the SCL in green and hawksbill turtles. Therefore, an SCL-based index value of 1.2 is equivalent to a CCL-based index value of 1.0. Moreover, CCL-based values were lower in Atlantic loggerhead turtles (0.79 × SCL-based values). There may be a regional difference in the relationship between SCL and CCL for Atlantic and Pacific loggerhead turtles that results in differences in the CCLnt-based index/SCLnt-based index ratio among conversion equations (~0.79 based on Teas, Reference Teas1993 and Bjorndal et al., Reference Bjorndal, Schroeder, Foley, Witherington, Bresette, Clark, Herren, Arendt, Schmid, Meylan, Meylan, Provancha, Hart, Lamont, Carthy and Bolten2013 vs 0.82–0.87 based on Okamoto et al., Reference Okamoto, Ouchi, Ishihara and Kamezaki2012 and Peckham et al., Reference Peckham, Maldonado-Diaz, Koch, Mancini, Gaos, Tinker and Nichols2008).
We only evaluated three species of sea turtles, i.e. green, loggerhead and hawksbill turtles, because data are scarce for the other species. Further studies are required to evaluate other sea turtle species. Kemp's Ridley turtle (Lepidochelys kempii) may have a higher Fulton's condition index than green turtles due to interspecific morphological differences (Lamont & Johnson, Reference Lamont and Johnson2021). Additionally, we did not evaluate the eastern Pacific green turtle subspecies, the black turtle (Chelonia mydas agassizii) because foraging grounds may contain both black turtle-like and ordinal green turtle-like morphotypes, and values have not been reported separately (Sielfeld et al., Reference Sielfeld, Salinas-Cisternas, Contreras, Tobar, Gallardo and Azocar2019). However, a smaller Fulton's condition index has been reported in small juveniles of black turtle-like morphotypes than in ordinary green turtles (Sampson et al., Reference Sampson, Payán, Amorocho, Seminoff and Giraldo2014).
In the present study, the effect of region was not significant; however, regional differences were possible sources of between-study heterogeneity. Fulton's condition index has not been reported equally from all regions and was tested as a random effect in this study. Further studies are necessary to explore regional differences. In addition, foraging aggregations sometimes contain turtles from various rookeries (Amorocho et al., Reference Amorocho, Abreu-Grobois, Dutton and Reina2012; Nishizawa et al., Reference Nishizawa, Naito, Suganuma, Abe, Okuyama, Hirate, Tanaka, Inoguchi, Narushima, Kobayashi, Ishii, Tanizaki, Kobayashi, Goto and Arai2013, Reference Nishizawa, Joseph, Chong, Syed Kadir, Isnain, Ganyai, Jaaman and Zhang2018), which may result in high individual differences and within-study heterogeneity in the condition index. Another factor for heterogeneity is the difference in carapace length measurement. SCL can be measured as notch-to-notch (SCLmin) or notch-to-tip (SCLnt) (Bolten, Reference Bolten, Eckert, Bjorndal, Abreu-Grobois and Donnelly1999). Calculating the index using SCLmin slightly increases the index from that based on SCLnt by 1.01–1.06 times. Defining which length is used clearly will be important for further establishing baseline body condition index values in sea turtles.
In conclusion, caution should be applied when using Fulton's condition index as a body condition indicator for sea turtles. Using Fulton's condition index for different species and size classes is problematic, as it does not consider the mass-length relationship (Peig & Green, Reference Peig and Green2010). Different threshold values for good body condition must be implemented for species and size classes. Morphometric body condition indices that incorporate mass-length relationships have been calculated for sea turtles (relative condition index: Labrada-Martagón et al., Reference Labrada-Martagón, Méndez-Rodríguez, Gardner, Cruz-Escalona and Zenteno-Savín2010, Reference Labrada-Martagón, Tenorio Rodríguez, Méndez-Rodríguez and Zenteno-Savín2011, Reference Labrada-Martagón, Méndez-Rodríguez, Mangel and Zenteno-Savín2013; Fukuoka et al., Reference Fukuoka, Narazaki and Sato2015; scaled mass index: Bell et al., Reference Bell, Meager, van de Merwe and Hof2019). Fulton's condition index is a simple metric that can be used to assess sea turtle body conditions. Because accidental errors can always occur when measuring bodyweight and length, the proposed threshold values for good body condition in this study must be carefully applied for individual body condition evaluation. Nonetheless, this study proposed baseline Fulton's condition index values for adequate sea turtle habitats and body conditions, which will be compared in future studies.
Data
The data that support the findings of this study are available from the online supplementary materials.
Supplementary material
The supplementary material for this article can be found at https://doi.org/10.1017/S0025315422000765.
Acknowledgements
We sincerely thank Sabah Parks, Sabah Wildlife Department, Reef Guardian and Lankayan Island Dive Resort for their logistical assistance during field sampling. We are grateful to the two anonymous reviewers for their constructive comments on this manuscript.
Author contributions
HN: formulating the research questions, designing the study, carrying out the study, analysing the data, interpreting the findings and writing the article. JJ: formulating the research questions, providing financial support, carrying out the study, revising the article.
Financial support
Field sampling at Lankayan and Turtle Islands Park was supported by the Malaysian Ministry of Higher Education under the Fundamental Research Grants Scheme (FRGS/1/2019/WAB09/UMS/02/2).
Conflict of interest
The authors declare no conflict of interests.
Ethical standards
Fieldwork in Sabah, Malaysia followed the guidelines and permitted under the Sabah Biodiversity Centre (SaBC) Access Licence: JKM/MBS.1000-2/2 JLD.12(23) and Sabah Parks: TTS/IP/100-6/2 JLD.11(119).