1. Introduction
Whole-rock Nd and Pb isotope data, used in conjunction with published U–Pb zircon ages, can assist in mapping the extent of crustal terranes of differing age and their commonly cryptic boundaries, augmenting understanding of the tectonic framework of a region. In contrast to U–Pb ages, which define times of igneous crystallization, whole-rock Nd and Pb isotope data provide information regarding the timing of magma extraction from the mantle. Both are needed and, in combination, provide stringent constraints on the relationship between primary extraction from the mantle and subsequent orogenic terrane amalgamation.
This communication addresses the Palaeoproterozoic Makkovik Province in eastern Labrador by providing Nd and Pb–Pb whole-rock isotopic results and lithogeochemical data for granitoid orthogneisses from the eastern Makkovik Province, where such information was largely lacking. These data are integrated with previously obtained isotopic-tracer results from further west in the Makkovik Province (Wilton, Reference Wilton1991; Kerr & Fryer, Reference Kerr and Fryer1993, Reference Kerr and Fryer1994; LaFlamme et al. Reference LaFlamme, Sylvester, Hinchey and Davis2013), and the information is used collectively to deliver a revised model for the tectonic evolution of the province.
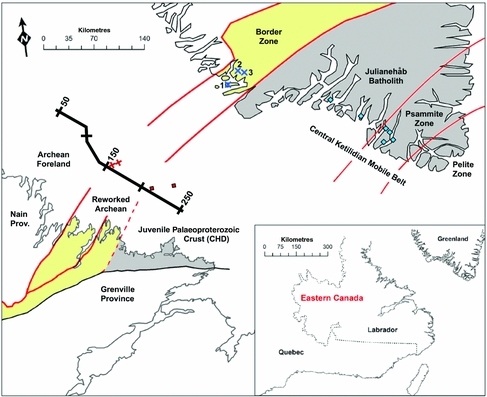
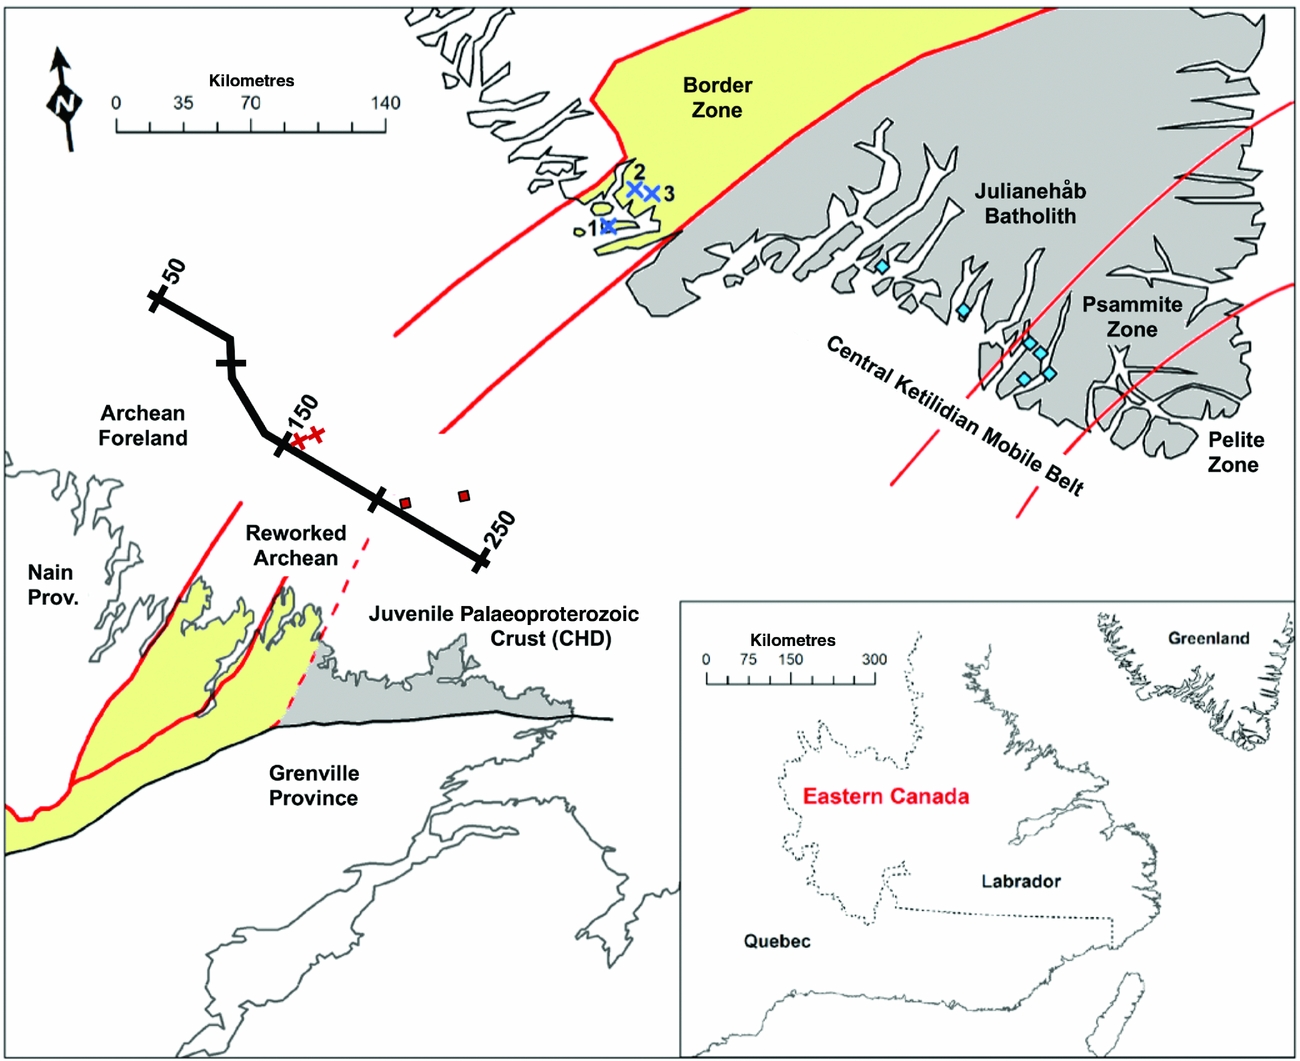
The Makkovik Province forms a small part of the Canadian Shield, situated between the Archean Nain Province to the NW and the Mesoproterozoic Grenville Province to the south (Fig. 1). It contains Palaeoproterozoic crust accreted to the southeastern margin of pre-Makkovikian Laurentia during the 1.9–1.8 Ga Makkovikian orogeny, and represents a significant period of crustal growth (Kerr & Fryer, Reference Kerr and Fryer1994). It has been interpreted to represent a former active continental margin, which first underwent juvenile arc accretion and then continental margin arc plutonism (Kerr et al. Reference Kerr, Krogh, Corfu, Schärer, Gandhi and Kwok1992; Ketchum, Culshaw & Dunning, Reference Ketchum, Culshaw and Dunning1997; Culshaw, Ketchum & Barr, Reference Culshaw, Ketchum and Barr2000; Ketchum, Culshaw & Barr, Reference Ketchum, Culshaw and Barr2002). On a broader scale, it correlates with the Ketilidian Mobile Belt of southern Greenland (e.g. Gower & Ryan, Reference Gower, Ryan and Moore1986; Ketchum, Culshaw & Barr, Reference Ketchum, Culshaw and Barr2002; Garde et al. Reference Garde, Hamilton, Chadwick, Grocott and McCaffrey2002). Integration of isotopic-tracer data from both regions is addressed here and is regarded as essential to advancing understanding of the orogen.
Map of eastern Labrador and southern Greenland showing the reworked edge of the Archean continental margin restored to its pre-Mesozoic configuration, after Kerr et al. (Reference Kerr, Hall, Wardle, Gower and Ryan1997). Reworked Archean margin (yellow shading); juvenile Palaeoproterozoic crust (grey shading). Dotted red line represents proposed Archean–Palaeoproterozoic boundary (detail, Fig. 2). Heavy black line, lithoprobe ECSOOT seismic reflection line. Published sample localities: Kalsbeek & Taylor (Reference Kalsbeek and Taylor1985) from the Border Zone (blue crosses: 1, Storø granite; 2, Quiartorfik granite; 3, Kaerne granite) and Central Ketilidian Mobile Belt (blue diamonds); Kerr & Wardle (Reference Kerr and Wardle1997) from Labradorian Shelf off-shore wells (red crosses, 2.3–2.8 Ga T DM ages; red diamonds, 2.05–2.15 Ga T DM ages).
2. Geological context
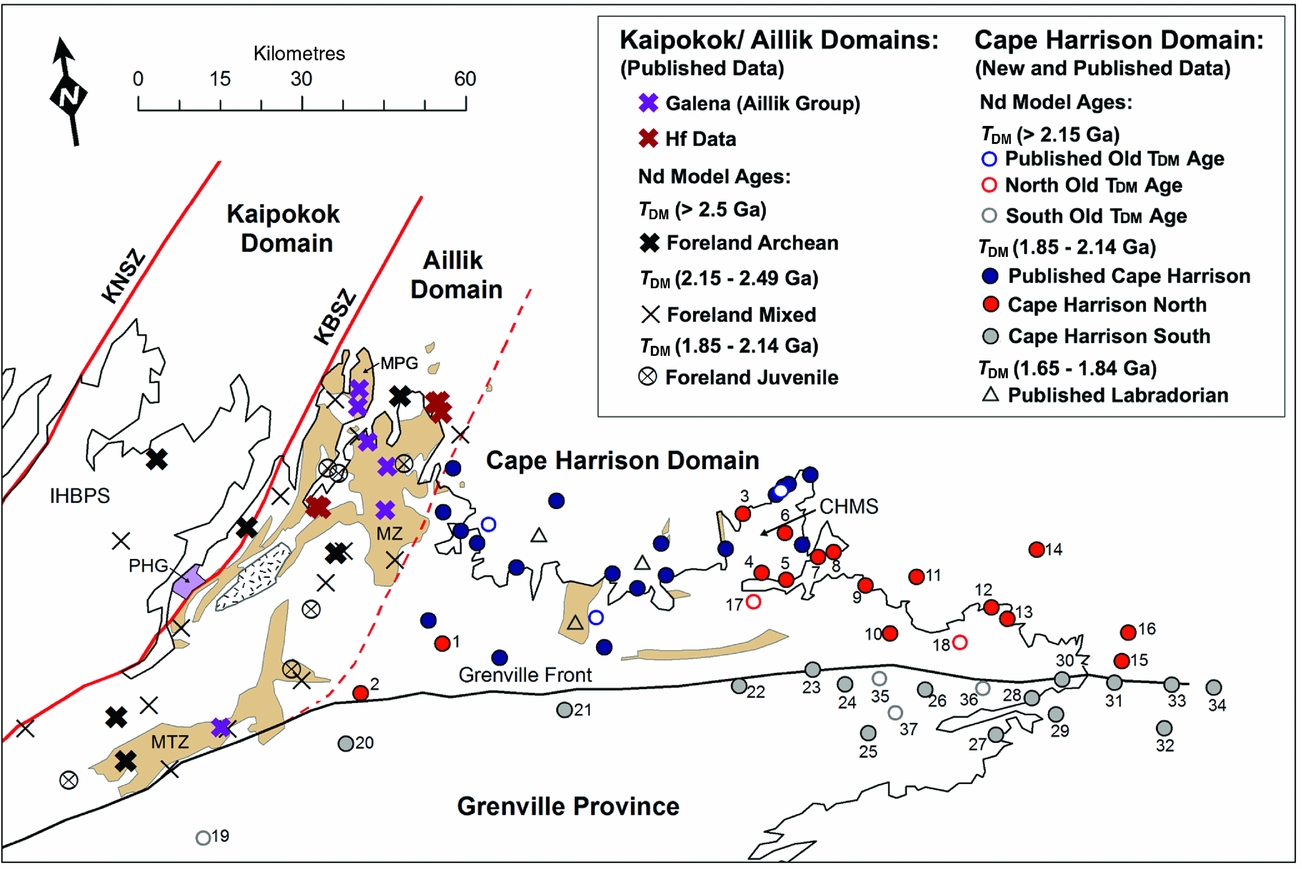
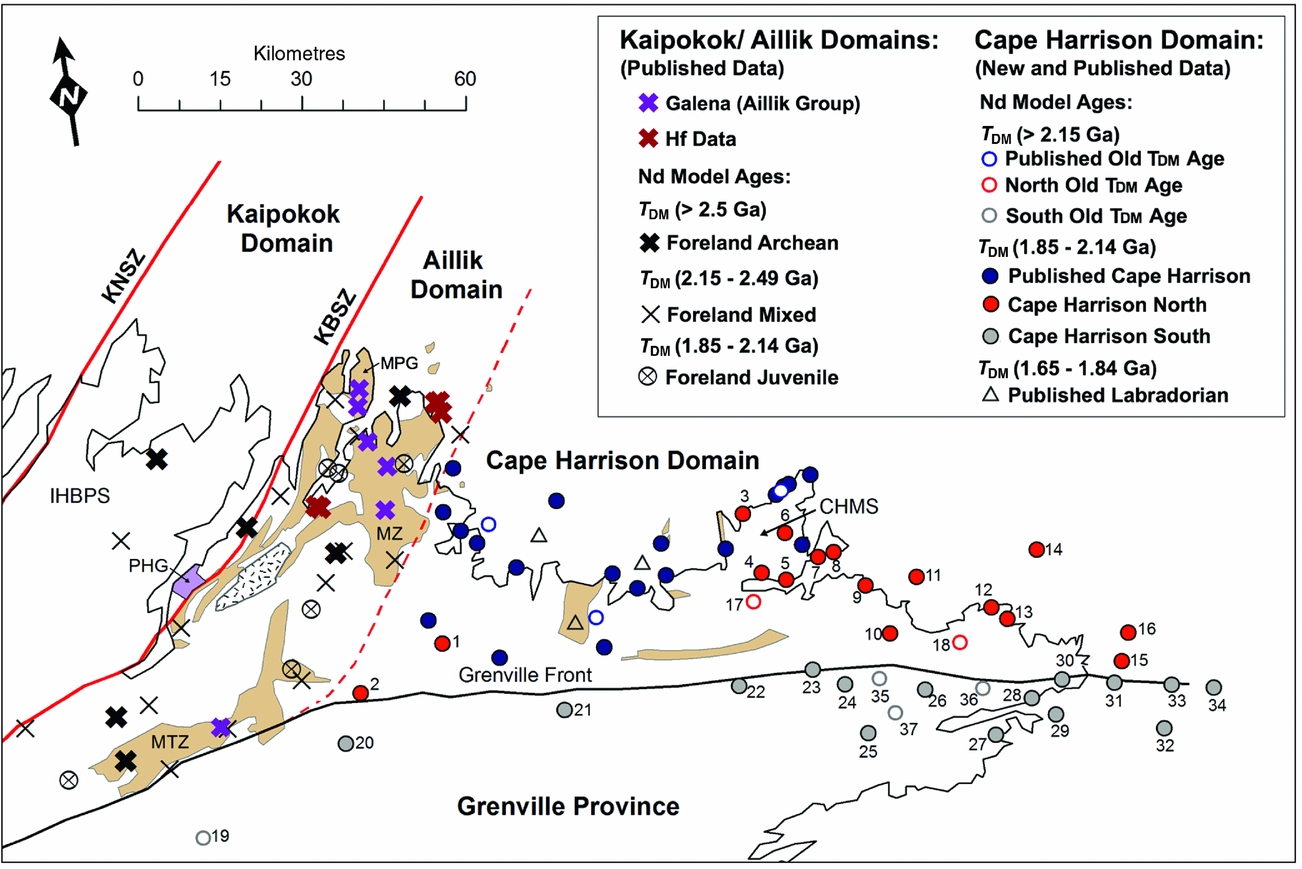
The Makkovik Province is divided into three structural entities (Fig. 2) comprising, from the west to east, the Kaipokok, Aillik and Cape Harrison domains (Kerr et al. Reference Kerr, Ryan, Gower, Wardle, Hall, Brewer and Aitkin1996).
Map of the Makkovik Province and NE Grenville Province. Boundaries: KNSZ – Kanairiktok shear zone; KBSZ – Kaipokok Bay shear zone; dotted line, Aillik – Cape Harrison boundary. Units: Archean block (stippled); PHG – Post Hill Group (purple); Aillik Group (brown): MZ – Makkovik zone; MTZ – Michelin zone; IHBPS – Island Harbour Bay plutonic suite; MPG – Measles Point granite; CHMS – Cape Harrison Metamorphic Suite. Published Nd data (unnumbered samples) from Kerr & Fryer (Reference Kerr and Fryer1994) and Ketchum, Culshaw & Barr (Reference Ketchum, Culshaw and Barr2002). Published Hf data (red crosses) and Pb (purple crosses) from LaFlamme et al. (Reference LaFlamme, Sylvester, Hinchey and Davis2013) and Wilton (Reference Wilton1991), respectively.
The Kaipokok domain comprises Archean crust, onto which Palaeoproterozoic metavolcanic and metasedimentary units of the Moran Lake Group and the Post Hill Group were unconformably deposited. Both basement and cover were tectonized during Makkovikian orogenesis, which imparted increasing deformational and metamorphic effects progressing SE (e.g. Ketchum, Culshaw & Barr, Reference Ketchum, Culshaw and Barr2002). The boundary between the Kaipokok domain and the Archean Nain Province is termed the Kanairiktok shear zone (KNSZ, Fig. 2). The Kanairiktok shear zone does not define a suture, as Archean basement is continuous from the Nain Province into the Kaipokok domain. It is, however, a deformation front, west of which Makkovikian deformation and metamorphism are very minor (Kerr et al. Reference Kerr, Hall, Wardle, Gower and Ryan1997; Culshaw, Ketchum & Barr, Reference Culshaw, Ketchum and Barr2000).
Ketchum et al. Reference Ketchum, Jackson, Culshaw and Barr(2001b) presented U–Pb data for several units from the Post Hill Group (PHG, Fig. 2). Zircons from a mafic metavolcanic rock, interpreted as a volcanic tuff, yielded a precise age of 2178±4 Ma, attributed to rift-related magmatism on a passive margin. The metavolcanic rocks are underlain by quartzite having solely Archean provenance. Overlying psammite/semipelitic rocks contain both Archean and Palaeoproterozoic zircons, one of which gave a concordant age of 2013±3 Ma. Ketchum et al. Reference Ketchum, Jackson, Culshaw and Barr(2001b) argued that this grain provides a maximum age for the deposition of the upper part of the Post Hill Group, possibly during the early stages of Makkovikian arc accretion (Ketchum, Culshaw & Barr, Reference Ketchum, Culshaw and Barr2002). Post Hill Group deposition therefore extended over a timespan of more than 165 Ma, from rifting to arc convergence. Subsequently, the Kaipokok domain recorded several episodes of Makkovikian and post-Makkovikian plutonism. The Island Harbour Bay plutonic suite provides evidence of early Makkovikian (1895–1870 Ma) calc-alkaline plutonism (Barr et al. Reference Barr, White, Culshaw and Ketchum2001). Three episodes of granitoid plutonism followed, namely (1) c. 1800 Ma (late Makkovikian – unfoliated); (2) c. 1720 Ma (post Makkovikian); and (3) c. 1650 Ma (Labradorian).
The Aillik domain to the east is characterized by thrust-bounded blocks of Palaeoproterozoic metavolcanic and metasedimentary rocks, the latter referred to as the Aillik Group. The lithology and geochemical properties of the Aillik Group suggest deposition in a shallow-marine environment within a back-arc or rifted-arc setting (e.g. Sinclair et al. Reference Sinclair, Barr, Culshaw and Ketchum2002; LaFlamme et al. Reference LaFlamme, Sylvester, Hinchey and Davis2013). The Aillik domain includes a lesser amount of early Makkovik plutonic rocks compared with the Kaipokok domain, mainly in the form of the Measles Point Granite (Fig. 2). Note that a U–Pb zircon age of 1929+10/–9 Ma for this unit (Sinclair et al. Reference Sinclair, Barr, Culshaw and Ketchum2002) has since been refuted by Hinchey & Davis (Reference Hinchey and Davis2013), who presented an age of 1873±10 Ma for the same unit on the basis of SHRIMP data. The Aillik domain also includes late- and post-Makkovikian intrusive suites, as well as Labradorian plutonic units (Barr et al. Reference Barr, White, Culshaw and Ketchum2001; LaFlamme et al. Reference LaFlamme, Sylvester, Hinchey and Davis2013).
The Aillik domain is separated from the Kaipokok domain by the Kaipokok Bay shear zone (KBSZ, Fig. 2). This shear zone was suggested by Kerr et al. (Reference Kerr, Hall, Wardle, Gower and Ryan1997) to represent the surface expression of an E-dipping suture between Archean and Palaeoproterozoic crust. At the same time, they acknowledged an Nd isotopic boundary 20–30 km further SE (identified by Kerr & Fryer, Reference Kerr and Fryer1993, Reference Kerr and Fryer1994), which they interpreted to mark the SE margin of the Archean North Atlantic craton at depth. However, a large thrust-bounded block of orthogneiss in the Aillik domain was subsequently found to be of Archean age (Ketchum, Culshaw & Barr, Reference Ketchum, Culshaw and Barr2002). This therefore weakens the interpretation of the Kaipokok Bay shear zone as the surface expression of the Archean–Proterozoic suture, as discussed in sections 3 and 4 below.
The Cape Harrison domain differs from the Aillik domain in lacking Archean crust and early Makkovikian granitoid rocks. Instead, it is mainly characterized by syn-Makkovikian granitoid rocks such as the Deus Cape and Stag Bay granitoid units (c. 1840 Ma; Kerr et al. Reference Kerr, Krogh, Corfu, Schärer, Gandhi and Kwok1992) and late syn-Makkovikian granitoid gneisses such as the Cape Harrison Metamorphic Suite, from which several 1815 Ma U–Pb ages were obtained (Ketchum, Culshaw & Barr, Reference Ketchum, Culshaw and Barr2002). Like the Aillik domain, the Cape Harrison domain also hosts post-Makkovikian (c. 1720 Ma) and Labradorian (c. 1650 Ma) intrusive suites. The Cape Harrison domain also contains felsic metavolcanic (1855 Ma) and related sedimentary rocks, but they differ from those in the Aillik domain in being much less abundant and in having lithogeochemical signatures more characteristic of a volcanic-arc setting (e.g. Ketchum, Culshaw & Barr, Reference Ketchum, Culshaw and Barr2002; Sinclair et al. Reference Sinclair, Barr, Culshaw and Ketchum2002).
The boundary between the Cape Harrison and Aillik domains is not recognized at surface, and is believed to have been masked by late Makkovikian and younger plutonism (mostly granitoid) attributed by Culshaw, Ketchum & Barr (Reference Culshaw, Ketchum and Barr2000) to the establishment of an ensialic arc on the accreted juvenile Makkovik arc crust. As such, the boundary is largely defined by the limit of major supracrustal areas to the west. However, it also corresponds approximately to the Nd isotope boundary, as discussed in Section 7 below.
In the Grenville Province to the south, the extent of rocks of Makkovikian affinity is uncertain as any present were variably affected by Labradorian (1710–1655 Ma) and Grenvillian (1080–985 Ma) orogenesis (e.g. Gower & Ryan, Reference Gower, Ryan and Moore1986; Ketchum, Culshaw & Barr, Reference Ketchum, Culshaw and Barr2002). Although granitoid gneiss over 100 km south of the Grenville Front in eastern Labrador has yielded late Makkovikian (c. 1800 Ma) U–Pb zircon ages (Gower et al. Reference Gower, Kamo, Kwok and Krogh2008), the nature of tectonic linkage with similar-aged rocks in the Makkovik Province remains unclear.
The northern border of the Labradorian orogen is usually considered to be defined by the Trans-Labrador batholith, a 600 km long granitoid belt broadly coincident with the Grenville Front (Kerr & Krogh, Reference Kerr and Krogh1990). Kerr (Reference Kerr1989) argued that the Trans-Labrador batholith in eastern Labrador comprises a series of scattered plutons rather than a single batholith. Geochemical data for the Trans-Labrador batholith of eastern Labrador support this argument by showing that the plutonic rocks of the suite are not closely related magmatically (Kerr, Reference Kerr1994).
3. Previous isotopic-tracer studies
Kerr & Fryer (Reference Kerr and Fryer1993, Reference Kerr and Fryer1994) observed an ‘inflection’ in ε Nd(t) signatures of Palaeoproterozoic granitoid rocks, corresponding approximately to the Aillik–Cape Harrison domain boundary. However, in the belief that the isotopic signatures of granitoid rocks were inherited from the lower crust, Kerr et al. (Reference Kerr, Hall, Wardle, Gower and Ryan1997) proposed that this isotopic boundary represented the intersection of the Archean–Proterozoic suture with the Moho. On the other hand, they interpreted the Kaipokok–Aillik domain boundary as the surface expression of the suture. Subsequently, Ketchum, Culshaw & Barr (Reference Ketchum, Culshaw and Barr2002) correlated the Kaipokok–Aillik domain boundary with the Kobberminebugt shear zone in Greenland, marking the boundary between the Border Zone of reworked Archean rocks and the Julianehåb Batholith to the south (Fig. 1).
A limited amount of Nd data has been determined for the Julianehåb Batholith (Patchett & Bridgewater, Reference Patchett and Bridgwater1984), showing its juvenile Palaeoproterozoic character. However, the Ketilidian Mobile Belt has been studied in more detail using whole-rock Pb–Pb data (Kalsbeek & Taylor, Reference Kalsbeek and Taylor1985). Granites from the central Ketilidian Mobile Belt (blue diamonds, Fig. 1) show radiogenic Pb signatures characteristic of juvenile Palaeoproterozoic crust. Palaeoproterozoic-aged granitoids are also seen in the Border zone to the north (blue crosses, Fig. 1), but in this segment these granitoids also showed Archean Pb isotopic signatures.
Pb–Pb data have also been obtained from mineralized veins from the Makkovik zone and Michelin zone of the Aillik Group (Wilton, Reference Wilton1991). Analysed galenas have Pb signatures characteristic of Archean crust. These signatures extend to the SE edge of the Aillik domain (Fig. 2) and show that metavolcanic and metasedimentary units in the Aillik Group received Pb that was remobilized from an Archean source. The Pb–Pb data therefore suggest that the Border Zone in Greenland is equivalent to the Aillik domain in Labrador, and that the Kobberminebugt shear zone should be correlated with the Aillik – Cape Harrison boundary rather than the Kaipokok Bay shear zone.
This evidence is supported by Hf isotope data for Aillik Group metavolcanic rocks from the easterly part of the domain (Fig. 2), some of which have Archean signatures (LaFlamme et al. Reference LaFlamme, Sylvester, Hinchey and Davis2013), again suggesting that Archean crust is extensive in the subsurface of the Aillik domain well beyond its surface exposure.
4. Seismic profile evidence
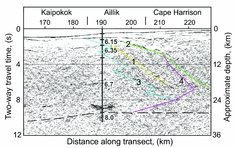
There is one more established line of evidence about relationships between the structural domains described in sections 2 and 3 above. This is the Lithoprobe Eastern Canadian Shield Onshore–Offshore Transect (ECSOOT) seismic reflection line, which was shot along the Labrador continental shelf within 100 km of the coastline (Fig. 1). This profile has significantly shaped thinking about the bounding shear zones of the Aillik domain, and therefore merits examination here before the presentation of new isotopic data. To aid this examination, a section of the reflection profile in the vicinity of the Aillik domain is reproduced in Figure 3.
Interpreted migrated, coherency-filtered, seismic reflection profile for ECSOOT south, plotted as distances (kilometres) against reflection time. Depth scale is approximate, based on a P-wave velocity of 6 km s–1. Numbers indicate alterative Kaipokok–Aillik domain boundary interpretations: 1, Hall et al. (Reference Hall, Wardle, Gower, Kerr, Coflin, Keen and Carroll1995); 2, Kerr et al. (Reference Kerr, Hall, Wardle, Gower and Ryan1997); 3 and 4, Hall et al. (Reference Hall, Louden, Funck and Deemer2002). Numbered vertical section indicates P-wave velocities based on refraction studies. Modified after Hall et al. (Reference Hall, Louden, Funck and Deemer2002).
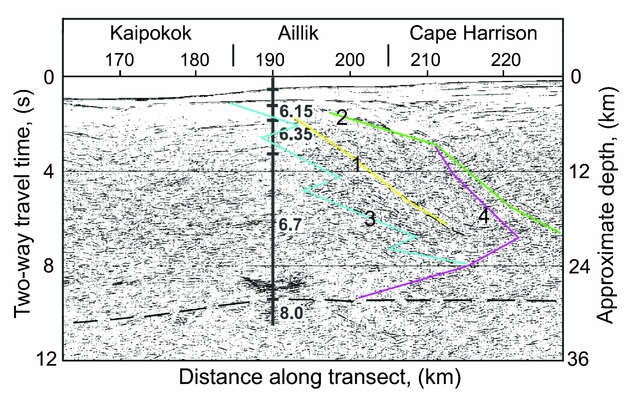
In the first discussion of these results, Hall et al. (Reference Hall, Wardle, Gower, Kerr, Coflin, Keen and Carroll1995) placed the Kaipokok Bay shear zone (Kaipokok–Aillik domain boundary) below a small sedimentary basin, and extended it to mid-crustal depths with a relatively steep dip (yellow line 1 in Fig. 3). On the other hand, Kerr et al. (Reference Kerr, Hall, Wardle, Gower and Ryan1997) proposed that the Kaipokok Bay zone is a crustal-scale suture but located somewhat further east, so that it does not reach the Moho until the 240 km distance point (green line 2 in Fig. 3). However, this proposal is difficult to reconcile with Nd data from a borehole on the continental shelf (Kerr & Wardle, Reference Kerr and Wardle1997), which yields juvenile Makkovik Nd signatures at the 210 km distance point (Fig. 1).
Hall et al. (Reference Hall, Louden, Funck and Deemer2002) made a major reinterpretation of the seismic section, suggesting that the Kaipokok–Aillik boundary is not a crustal-scale ramp but a zone of crustal interfingering with an irregular shape (blue line 3 in Fig. 3). On the other hand, they placed the Aillik–Cape Harrison boundary only 10 –15 km to the east (pink line 4 in Fig. 3) at a location corresponding to the Archean–Proterozoic Nd boundary of Kerr et al. (Reference Kerr, Hall, Wardle, Gower and Ryan1997). According to this proposal, the structural boundary on the seismic line associated with the craton edge has therefore changed from the Kaipokok shear zone to the Aillik – Cape Harrison boundary. The significance of this change for the interpretation of onshore boundaries will be discussed in Section 7 below.
5. Sampling
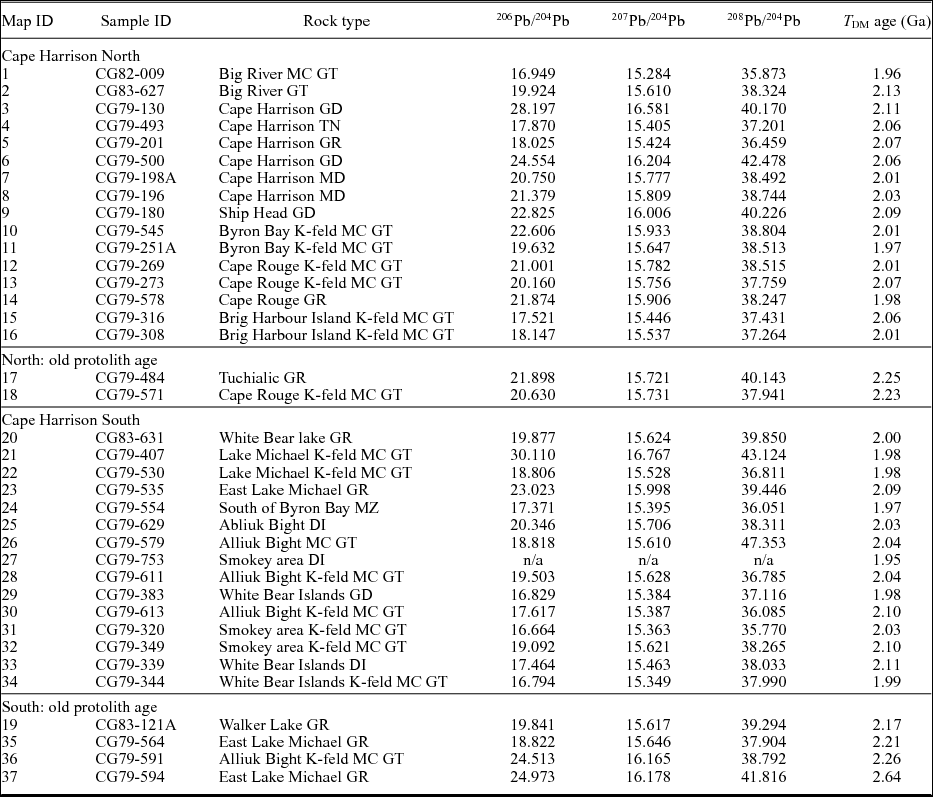
Whole-rock powders of 37 granitoid orthogneisses were provided by the Geological Survey of Newfoundland and Labrador (collected by C.F. Gower). Sampling locations are indicated in Figure 2, and are located in both the Makkovik and northernmost Grenville provinces. Grid references for sample localities are given in Table 1 (UTM, 1983 datum). Petrological descriptions of the analysed samples are summarized in Table 2. Details of the petrology are given in online Supplementary Table S1 (available at http://journals.cambridge.org/geo).
Nd isotope data for samples from the Cape Harrison domain.

Q – quartz index; P – plagioclase v. K-feldspar index (Debon & LeFort, Reference Debon and LeFort1983)
Pb isotope data for samples from the Cape Harrison domain.

Rock types: DI – diorite; GR – granite; GT – granitoid; GD – granodiorite; MC – megacrystic; MD – monzodiorite; MZ – monzonite; TN – tonalite.
Although the analysed samples have not been individually dated by the U–Pb method, they are believed from their granitoid petrology and minimal deformation to largely represent late Makkovik (1850–1800 Ma) plutonic rocks. This attribution is confirmed by Pb and Nd isotope data; these indicate a strong degree of uniformity in their protolith signatures, except for a few samples with older inherited crustal signatures and a few with younger signatures attributed to Labradorian plutonism. Previous Nd isotope studies (e.g. McNutt & Dickin, Reference McNutt and Dickin2012) showed that granitoid plutons largely inherit the protolith age of the crust into which they were emplaced, allowing the use of larger suites of undated samples to define the geographical extent of crustal terranes in conjunction with smaller suites of U–Pb-dated samples. This is the approach used in the present study.
6. Analytical methods
Sm–Nd analysis followed the procedure of Dickin & McNutt (Reference Dickin and McNutt1989). After dissolution using HF and HNO3, samples were split and one aliquot spiked with a mixed 150Nd–149Sm spike. Analysis by this technique yielded Sm/Nd = 0.2280±0.0002 for BCR-1, in agreement with Thirlwall (Reference Thirlwall1982). Standard cation and reversed-phase column separation methods were used. Nd isotope analyses were performed on a VG isomass 354 mass spectrometer at McMaster University using double filaments and a four-collector, peak-switching algorithm, and were normalized to a 146Nd/144Nd ratio of 0.7219. Average within-run precision on the samples was ±0.000014 (2σ), and an average value of 0.51185±0.00002 (2σ population) was determined for the La Jolla standard during this work, in agreement with Thirlwall (Reference Thirlwall1991). The reproducibility of 147Sm/144Nd and 143Nd/144Nd is estimated at 0.1% and 0.002% (1σ), respectively, leading to an average uncertainty on each model age of 20 Ma (2σ) on the basis of empirical experience over several years of analysing duplicate dissolutions.
Pb isotope analysis followed the procedure of Dickin (Reference Dickin1998). After Savillex ‘bomb’ dissolution in HF, HNO3 and HCl, Pb extraction followed standard techniques using anion exchange in HBr. Samples were loaded with silica gel and phosphoric acid onto single Re filaments and analysed on a VG 354 mass spectrometer at McMaster University. Average within-run precision on samples was 0.02% (1σ) with the reproducibility estimated at 0.1% (2σ). All data were fractionation corrected (average 0.12% per mass unit) on the basis of frequent analysis of the NBS 981 standard.
Major- and trace-element analysis was carried out by the Geological Survey of Newfoundland and Labrador. Major elements and selected trace elements were determined by inductively coupled plasma (ICP) optical emission spectroscopy, following a 4-acid (HF–HCl–nitric–perchloric) digestion. These data were supplemented by additional trace-element suites as new procedures became available (see online Supplementary Table S2, available at http://journals.cambridge.org/geo, for individual methods used). All methods were validated by the analysis of international reference materials.
7. Nd isotope data
New Nd isotope data from the current study are presented in Table 1 and used to calculate depleted mantle model ages (T DM) using the model of DePaolo (Reference DePaolo1981). Sample localities are represented in Figure 2 by numbered points, along with locations for published data (not numbered) from Kerr & Fryer (Reference Kerr and Fryer1994) and Ketchum, Culshaw & Barr (Reference Ketchum, Culshaw and Barr2002). Symbols plotted in Figure 2 are subdivided by lithotectonic domain and T DM model age. Samples from the Foreland zone (Kaipokok and Aillik domains) are subdivided into three groups by age: Archean model ages (>2.5 Ga) attributed to remelting of Archean crust; intermediate model ages (2.15–2.49 Ga) attributed to Makkovikian plutons with variable Archean Nd component; and Palaeoproterozoic model ages (<2.15 Ga) attributed to relatively rare examples of juvenile Makkovik magmas that escaped crustal contamination.
Samples from the Cape Harrison domain are also subdivided into three groups: solid circles, Makkovikian model ages (1.85–2.14 Ga); open symbols, model ages over 2.15 Ga; and open triangles, Labradorian model ages (1.65–1.84 Ga). On the basis of these age categories, it can be seen that samples in the Cape Harrison domain of the Makkovik Province mainly yield T DM ages in the range 1.85–2.14 Ga (red and blue circles). This implies that the majority of the crust in the Cape Harrison domain formed just prior to the Makkovikian orogeny. Most samples within the Grenville Province to the south (grey circles) also follow this trend, suggesting that they represent southerly equivalents of the Cape Harrison domain that were affected by Labradorian and/or Grenvillian metamorphism, without affecting their Nd isotope signatures. This block is therefore referred to as ‘Cape Harrison South’. This area also includes one sample with Archean provenance (#37), and three samples with Palaeoproterozoic T DM ages that may contain an Archean crustal component (grey open circles). Two samples with similar early Proterozoic T DM ages were also found in the western part of the Cape Harrison domain by Kerr & Fryer (Reference Kerr and Fryer1994).
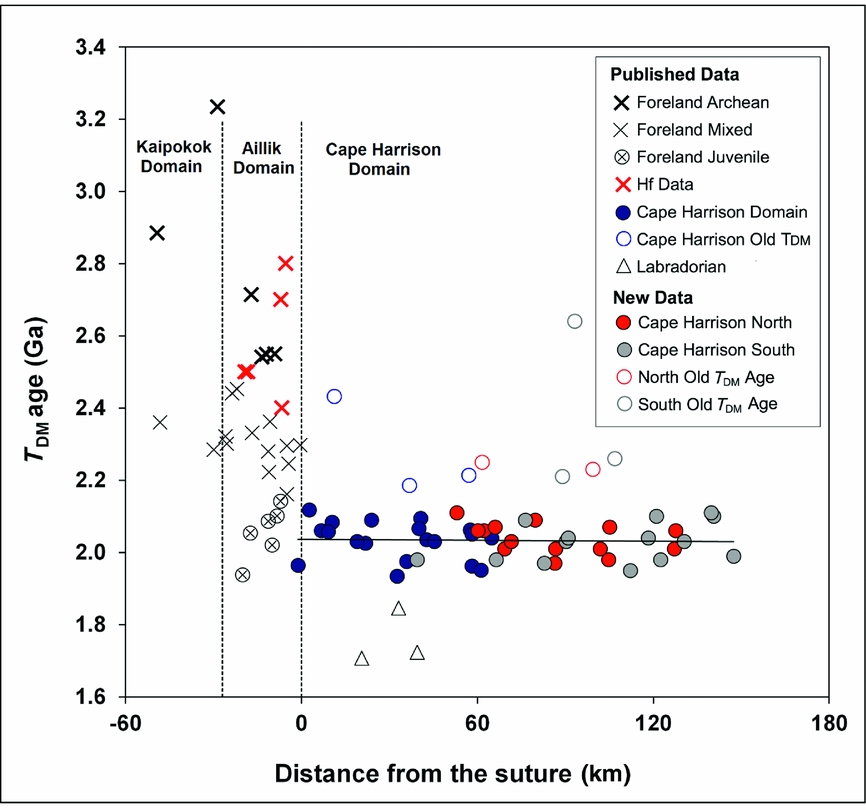
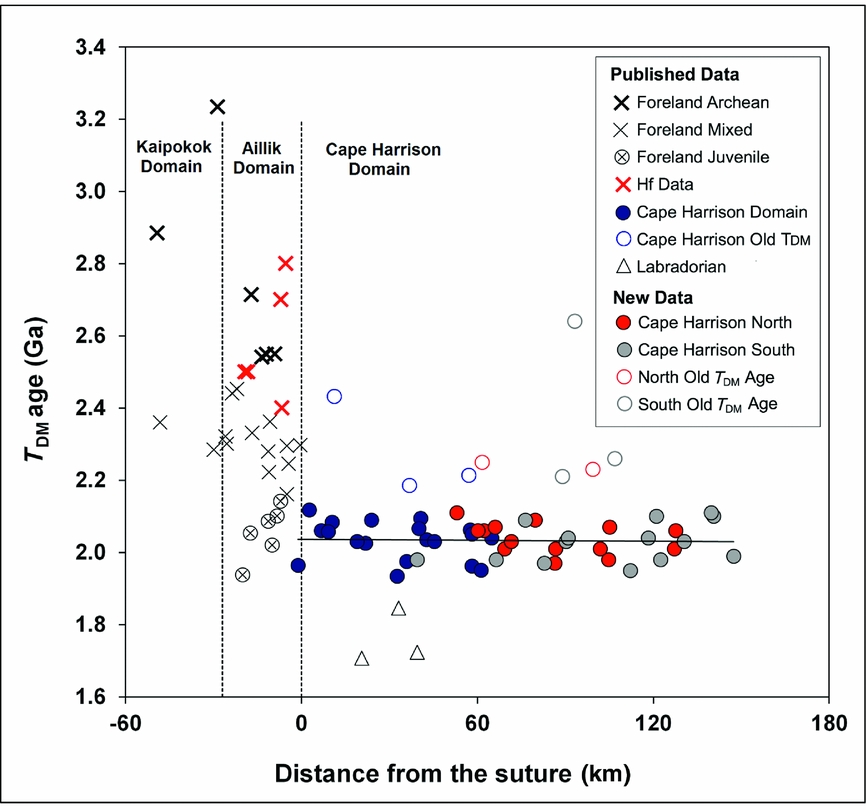
T DM model ages are plotted against the distance from the Aillik – Cape Harrison domain boundary in Figure 4, which approximately corresponds to the Archean–Proterozoic suture. A linear regression for the Cape Harrison North and South samples shows that they represent a single episode of crustal formation across the whole juvenile Makkovik Province. At the suture location (0 on the x-axis), a sharp change in T DM age is evident. In contrast, there is no observable trend of model age against distance across the Aillik domain. This suggests that the Aillik domain once consisted dominantly of Archean crust, which was later reworked with equal intensity across its width by Makkovikian ensialic arc magmatism.
Plot of T DM model age versus distance in kilometres from the Aillik – Cape Harrison domain boundary, interpreted as a collisional suture. Dashed lines, boundaries between domains. Symbols as for Figure 2, with published Nd data from Kerr & Fryer (Reference Kerr and Fryer1994) and Ketchum, Culshaw & Barr (Reference Ketchum, Culshaw and Barr2002). Published Hf model ages from LaFlamme et al. (Reference LaFlamme, Sylvester, Hinchey and Davis2013).
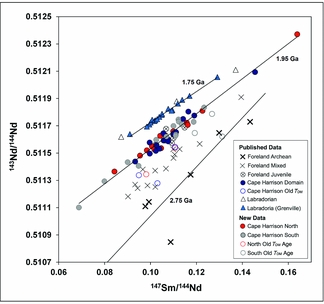
Nd data are shown on a Sm–Nd isochron diagram (Fig. 5) using the same symbols as in Figures 2–4. A majority of the newly obtained Nd analyses (#3–16 and 21–34; Cape Harrison North and Cape Harrison South) fall along a strong correlation line, consistent with previously published samples from the Cape Harrison domain (blue circles, Kerr & Fryer, Reference Kerr and Fryer1994; Ketchum, Culshaw & Barr Reference Ketchum, Culshaw and Barr2002). This array is technically an errorchron (MSWD = 10) but, after expansion of errors to encompass the geological scatter, the regression yields a relatively precise age of 1.95±0.10 Ga (2σ) which strongly supports the average 2.0 Ga T DM model age of these samples. This validates the DePaolo (Reference DePaolo1981) depleted mantle model and suggests derivation of the Cape Harrison domain as juvenile crust immediately before Makkovikian orogenesis. The data from both Figures 3 and 4 therefore suggest that the Cape Harrison domain represents the juvenile component of the Makkovik orogen, which was generated during a single crust-forming event.
Sm–Nd isochron diagram for the Makkovik Province, showing best-fit age of 1.95 Ga for the majority of analysed samples along with reference lines for 2.75 Ga and 1.75 Ga crustal extraction. Symbols as for Figure 2, including published Nd data from Kerr & Fryer (Reference Kerr and Fryer1994) and Ketchum, Culshaw & Barr (Reference Ketchum, Culshaw and Barr2002). Data from Dickin (Reference Dickin2000) for Labradoria (1.75 Ga; blue triangles) are plotted for reference.
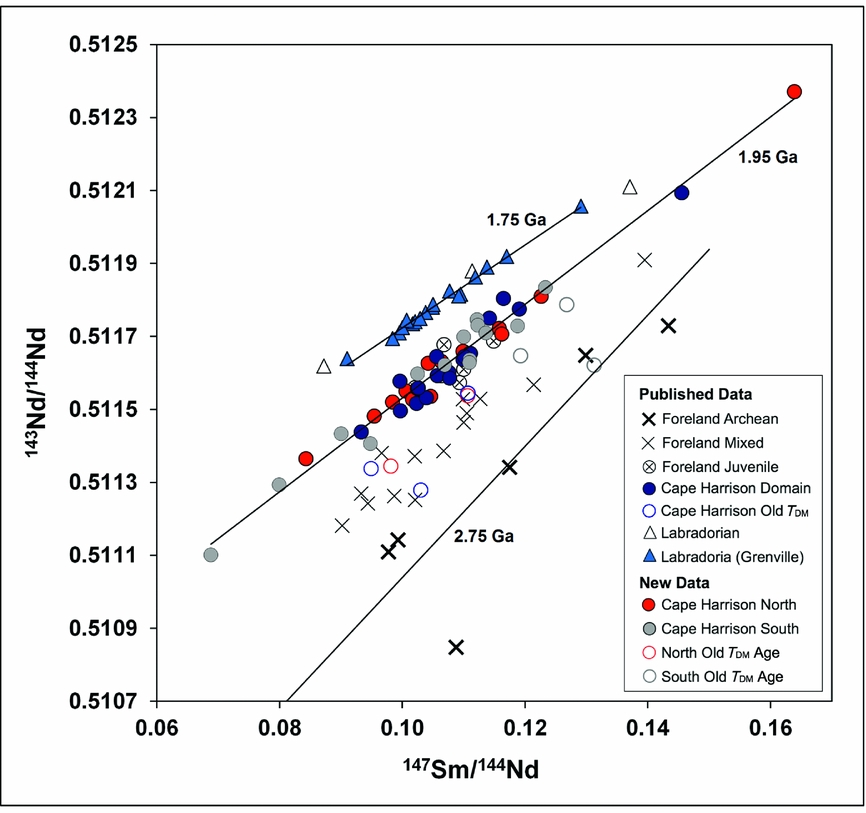
Two other episodes of crustal formation are also known in eastern Labrador, representing juvenile crust extracted from the upper mantle in late Archean and Labradorian events (represented by 2.75 and 1.75 Ga reference lines in Fig. 5). Some samples from the Foreland zone (Kaipokok–Aillik domains) with Archean model ages plot close to the 2.75 Ga reference line. These were minimally affected by Makkovikian orogenesis. Data that fall between the 1.95 Ga and 2.75 Ga arrays are mainly samples from the Foreland zone (Aillik and Kaipokok domains) with mixed Nd signatures, and represent Archean crust reworked by Makkovikian plutonism. A few Cape Harrison samples that yield older model ages (sample nos 17, 18, 35, 36) also fall between the two reference lines. These are interpreted as small pockets of pre-Makkovikian crust (at least one with Archean provenance; sample no. 37) entrapped within the juvenile Makkovikian arc.
Samples shown by open triangles (from Kerr & Fryer, Reference Kerr and Fryer1994) plot on the same 1.75 Ga line as samples from SE Labrador and adjacent eastern Quebec with juvenile Labradorian Nd isotope signatures (blue triangles, Dickin, Reference Dickin2000). These samples are interpreted as representing a younger mantle-derived component, probably related to Labradorian plutonism.
8. Pb–Pb data
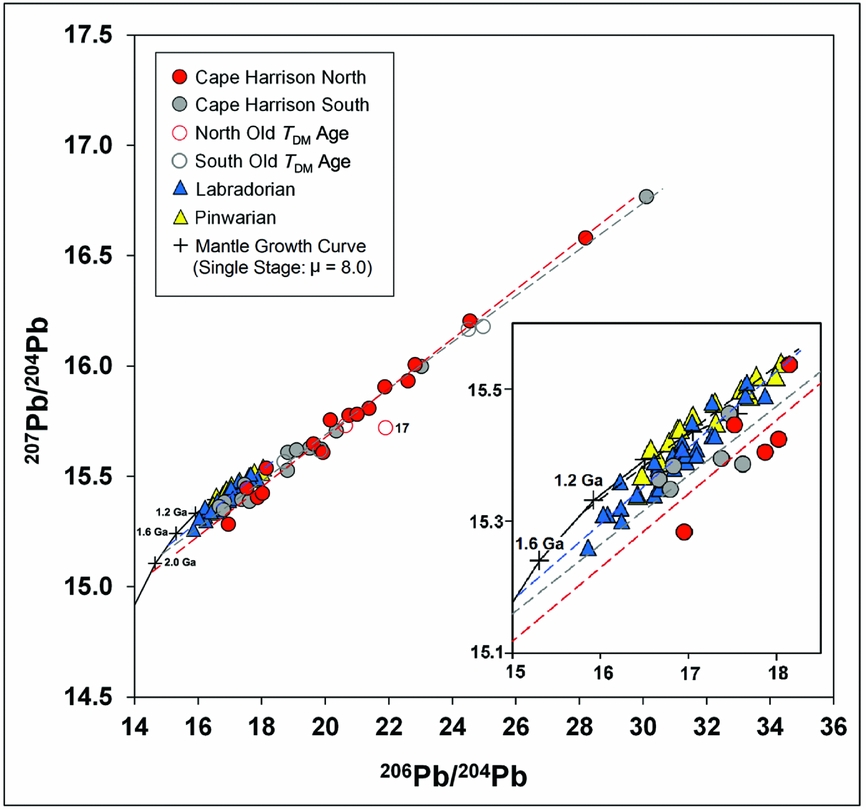
Whole-rock Pb isotope data from the Cape Harrison domain (Table 2) are plotted on a Pb–Pb isochron diagram (Fig. 6) following the same symbology established in Figure 2 (red circles, Cape Harrison North; grey circles, Cape Harrison South; open circles, Cape Harrison domain with older model ages). Published Pb isotope data from Loewy et al. (Reference Loewy, Connelly, Dalziel and Gower2003) for samples of Labradorian (1710–1655 Ma) and Pinwarian (1520–1460 Ma) age are plotted for comparison (blue and yellow triangles, respectively; Fig. 6). A single-stage Pb mantle growth curve is plotted using a μ value of 8.0 that is typically determined for the mantle source of juvenile Proterozoic rocks (e.g. Oversby, Reference Oversby1974; Kalsbeek & Taylor, Reference Kalsbeek and Taylor1985). When projected back to the growth curve, the regression line for the Labradorian array (Loewy et al. Reference Loewy, Connelly, Dalziel and Gower2003) yields a Pb model age of c. 1.8 Ga. This represents an approximate Pb–Pb crustal formation age, and is consistent with the oldest U–Pb ages from the Grenville Province of Labrador dated at c. 1.8–1.77 Ga (Gower et al. Reference Gower, Kamo, Kwok and Krogh2008).
Pb–Pb isochron diagram of samples from the Cape Harrison domain compared with published Pb–Pb data of Labradorian and Pinwarian age (Loewy et al. Reference Loewy, Connelly, Dalziel and Gower2003).
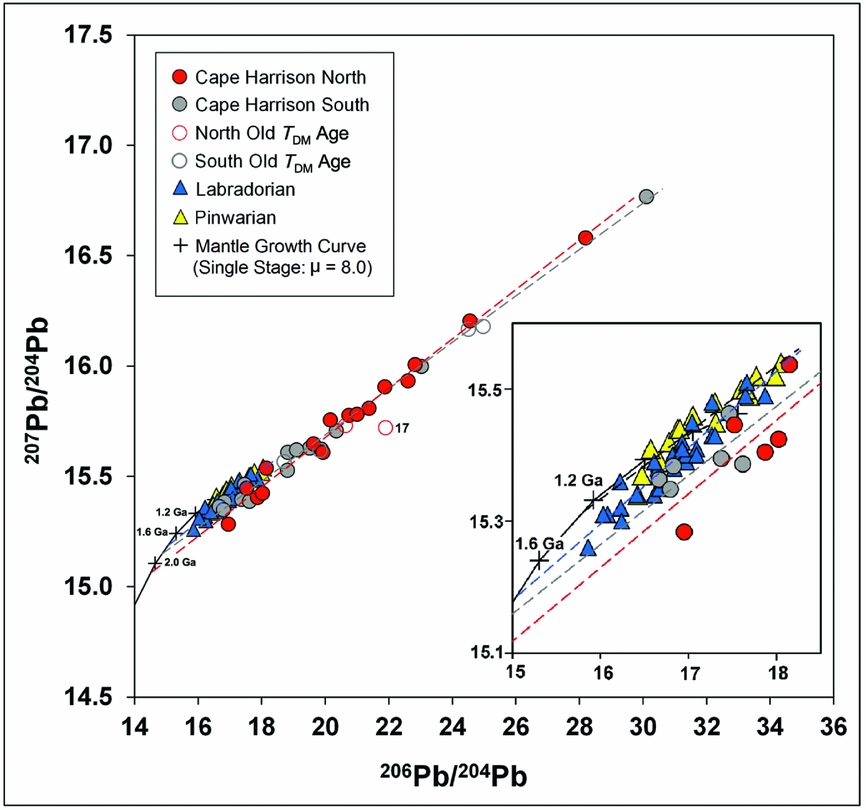
When compared to the Labradorian and Pinwarian data, most samples from the Cape Harrison North and South suites have much more radiogenic Pb isotope signatures. However, the regression lines project back to the growth curve with older Pb model ages than the Labradorian array, consistent with the average 2.0 Ga Nd model age reported in Section 7 above. The Pb–Pb slope ages of the Cape Harrison North and South arrays (assuming closed-system Pb isotope evolution) are c. 1.83 Ga and 1.71 Ga, respectively. The lower age for samples within the Grenville Province is attributed to younger reworking during Labradorian orogenesis, which would have caused samples to move towards the Labradorian Pb array. In contrast, the 1.83 Ga slope age for the Cape Harrison North array is consistent with the U–Pb age of late Makkovikian plutonism.
Cape Harrison samples that yield older Nd model ages than the surrounding rocks do not show any consistent pattern of Pb compositions. With a T DM age of 2.25 Ga, sample no. 17 lies off the Pb array; the other four samples with T DM ages above 2.15 Ga lie within error of the main array however, supporting the suggestion above that the older Nd model ages reflect the incorporation of small vestiges of older crust (possibly sediment) in the melting zone of the analysed granitoid rocks.
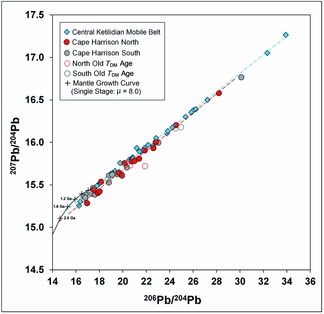
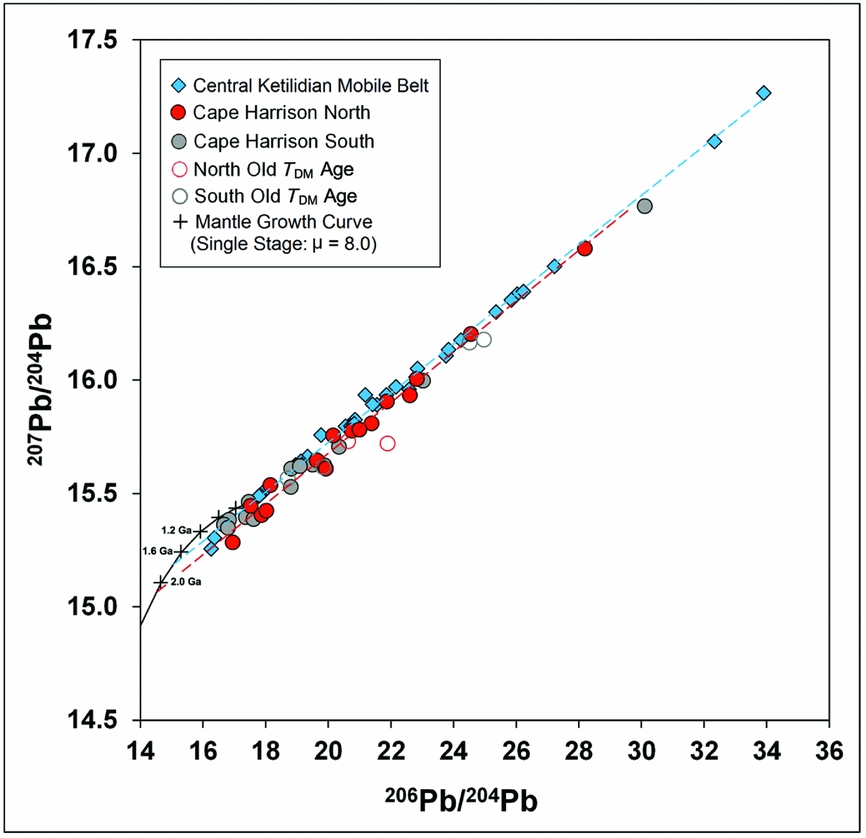
The Cape Harrison Pb–Pb data are compared in Figure 7 with published whole-rock Pb–Pb data from the central Ketilidian Mobile Belt (blue diamonds, Kalsbeek & Taylor, Reference Kalsbeek and Taylor1985). The latter suite is interpreted as juvenile Palaeoproterozoic crust, and the close similarity between the Pb arrays provides additional evidence for the juvenile character of the Cape Harrison suites.
Pb–Pb isochron diagram of samples from the Cape Harrison domain compared with published data from the central Ketilidian Mobile Belt of south Greenland. Published data from Kalsbeek & Taylor (Reference Kalsbeek and Taylor1985).
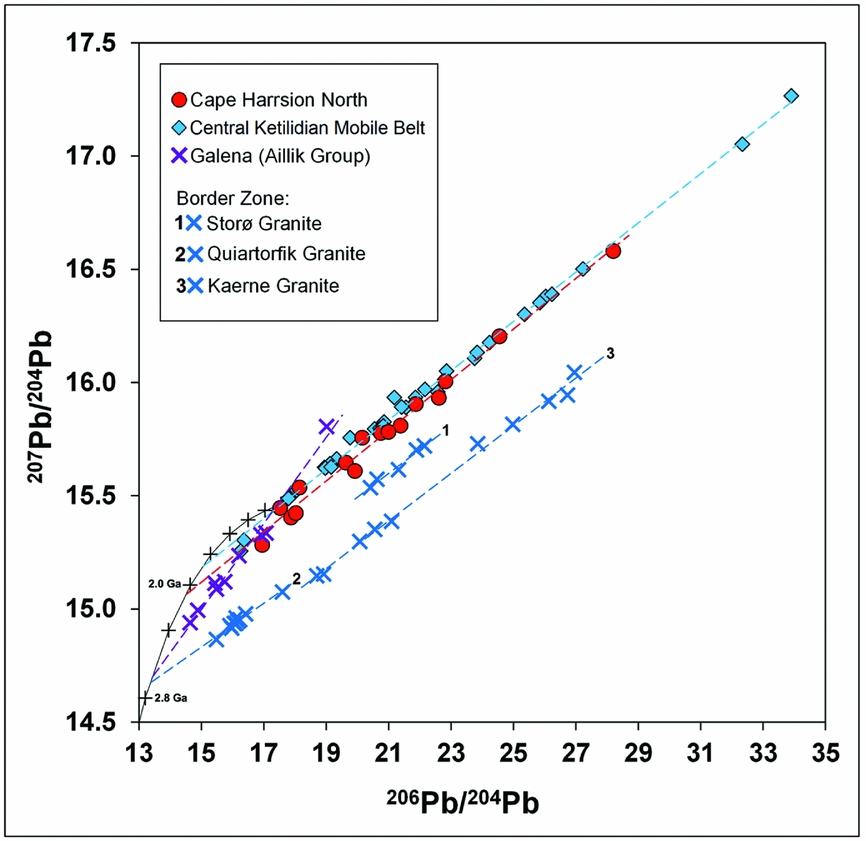
Published Pb galena analyses from uraniferous and non-uraniferous mineralized veins in the Aillik Group (Fig. 2; Wilton, Reference Wilton1991) show a steeper array relative to the Cape Harrison domain when plotted on a Pb–Pb isochron diagram (purple crosses in Fig. 8). The slope age of this array, assuming closed-system Pb isotope evolution, is c. 2.75 Ga. Likewise, the intersection of the Aillik array with a single-stage mantle growth curve (μ = 8) yields a Pb model age of c. 2.75 Ga. These observations led Wilton (Reference Wilton1991) to argue for the presence of Archean-derived Pb in the Aillik Group as well as in the Moran Lake Group located further west, indicating that the basement in these areas resembles Archean gneisses of the Nain Province. The SE continuation of the Archean foreland up to the Aillik – Cape Harrison boundary (Fig. 2) would account for the Archean signatures in the Aillik data that are clearly absent from the Cape Harrison data (Fig. 8).
Pb–Pb isochron diagram of published data from galena in the Aillik Group (Wilton, Reference Wilton1991) and granites from the border zone of south Greenland (Kalsbeek & Taylor, Reference Kalsbeek and Taylor1985) demonstrating Pb arrays that project back to the Archean. These published data are compared with data from the Cape Harrison North suite and central Ketilidian Mobile Belt (Kalsbeek & Taylor, Reference Kalsbeek and Taylor1985). Horizontal axis (206Pb/204Pb) shifted down relative to Figures 6 and 7.
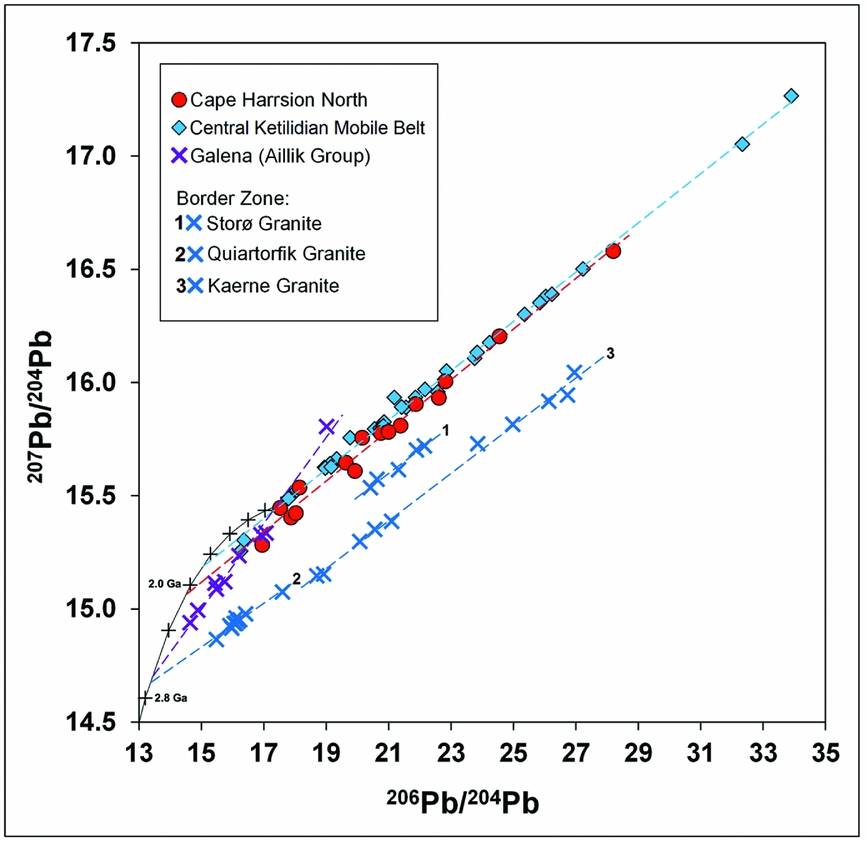
These data are compared in Figure 8 with published whole-rock Pb data for the Storø, Quiartorfik and Kaerne granites from the border zone in Greenland (blue crosses in Fig. 1). These suites yield Palaeoproterozoic Pb–Pb slope ages of c. 1.70 Ga, 1.56 Ga and 1.72 Ga, respectively (Kalsbeek & Taylor, Reference Kalsbeek and Taylor1985). However, the regression lines project back to the growth curve with largely Archean Pb model ages (c.2.4–2.8 Ga). Kalsbeek & Taylor (Reference Kalsbeek and Taylor1985) calculated low ε Nd(t) values of c. –6 to –7 for these plutons at 1.75 Ga showing that, despite their Palaeoproterozoic intrusive ages, these granites were largely derived from the anatexis of Archean crust. Kalsbeek and Taylor therefore concluded that the border zone in Greenland represents a reworked segment of the Archean foreland. The Storø granite (no. 1 in Fig. 8) has Pb signatures characteristic of a higher-μ source (7.6) than the Kaerne and Quiartorfik granites (7.2–7.3) due to variable contributions of Proterozoic mantle-derived material relative to Archean melt (Kalsbeek & Taylor, Reference Kalsbeek and Taylor1985).
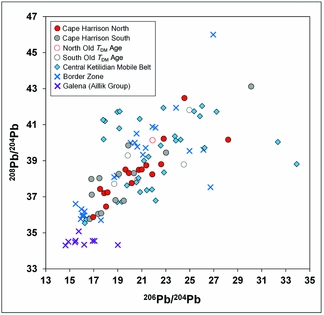
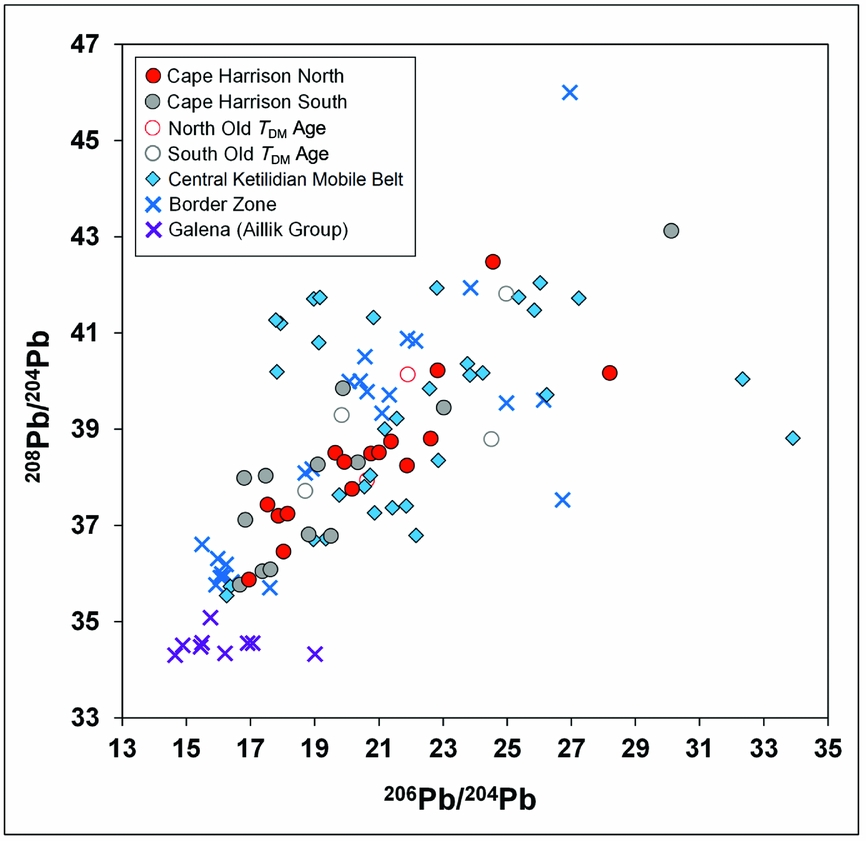
On a plot of thorogenic versus uranogenic Pb (Fig. 9) granites from the Cape Harrison domain and Ketilidian Mobile Belt (border zone and central mobile belt) show a wide distribution across thorogenic and uranogenic space with significant overlap. This is quite different from the Aillik Group galenas (Wilton, Reference Wilton1991), which show a significant depletion in thorogenic Pb. This is to be expected however, as the Aillik Group has been reported to be Th-poor (Wilton, Reference Wilton1991). The scatter in the data implies a substantial decoupling of Th and U, likely during intense magmatism and deformation.
Diagram of thorogenic versus uranogenic Pb for granites from the Cape Harrison domain compared with published data for granites from the central Ketilidian Mobile Belt and Border Zone of south Greenland (Kalsbeek & Taylor, Reference Kalsbeek and Taylor1985) and galena from the Aillik Group (Wilton, Reference Wilton1991).
9. Lithochemical data
Major- and trace-element whole-rock analyses for the Cape Harrison North and South suites were obtained by the Geological Survey of Newfoundland and Labrador, and are presented in online Supplementary Table S2 (available at http://journals.cambridge.org/geo). Major- and trace-element whole-rock analyses for the Cape Harrison domain were compared with published data from the Island Harbour Bay Plutonic Suite (IHBPS) of the Kaipokok domain (Barr et al. Reference Barr, White, Culshaw and Ketchum2001) and granitoids of the Ketilidian Mobile Belt (Kalsbeek & Taylor, Reference Kalsbeek and Taylor1985) on petrochemical discriminant diagrams in Figures 10 and 11.
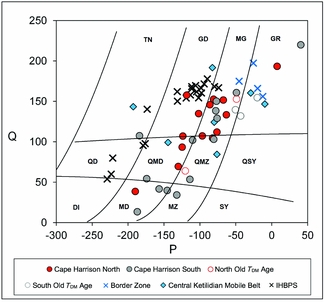
Petrochemical grid of Debon & LeFort (Reference Debon and LeFort1983) for the chemical Streckeisen classification of granitoids. Q, 1/3 Si-(K+Na+2/3Ca); P, K-(Na+Ca). TN – tonalite; GD – granodiorite; MG – monzogranite; GR – granite; QD – quartz diorite; QMD – quartz monzodiorite; QMZ – quartz monzonite; QSY – quartz syenite; DI – diorite; MD – monzodiorite; MZ – monzonite; SY – syenite. Published data from Kalsbeek & Taylor (Reference Kalsbeek and Taylor1985) and Barr et al. (Reference Barr, White, Culshaw and Ketchum2001).

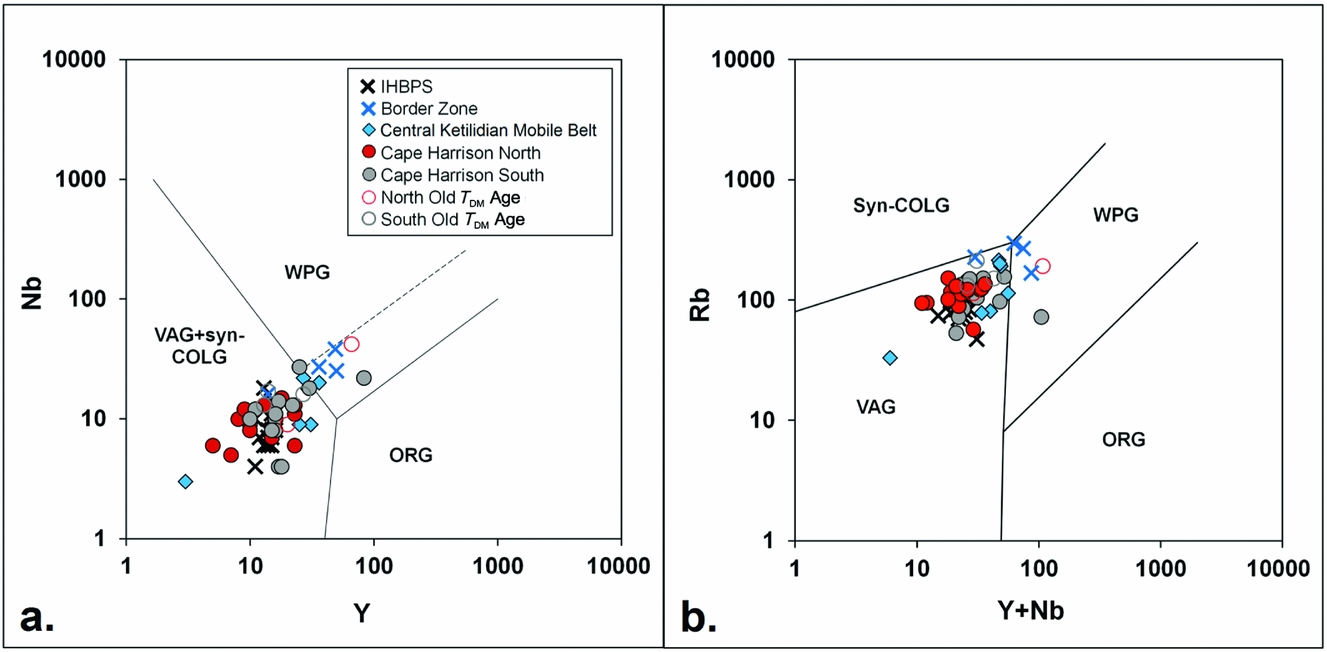
Discrimination diagrams of (a) Y v. Nb and (b) Y+Nb v. Rb after Pearce, Harris & Tindle (Reference Pearce, Harris and Tindle1984). VAG – volcanic arc granites; syn-COLG – syn-collisional granites; ORG – orogenic granites; WPG – within-plate granites. Published data from Kalsbeek & Taylor (Reference Kalsbeek and Taylor1985) and Barr et al. (Reference Barr, White, Culshaw and Ketchum2001).

Samples are first characterized using the petrochemical Streckeisen grid of Debon & LeFort (Reference Debon and LeFort1983), which aims to describe the petrological affinity of each sample using their Q (quartz content) and P (plagioclase v. K-feldspar content) indices (Fig. 10). Samples from the IHBPS trend diagonally across the left of the diagram from the quartz diorite to granodiorite field. Their low alkali contents are consistent with emplacement in relatively thin crust during the early stages of Makkovikian magmatism (Barr et al. Reference Barr, White, Culshaw and Ketchum2001). In contrast, the Cape Harrison domain (North and South suites) and Ketilidian Mobile Belt (central and border zones) show a more alkaline character and trend diagonally across the middle of the diagram. This is indicative of emplacement into a more mature continental-arc setting, consistent with the derivation of the analysed samples from the period of ensialic arc magmatism after the addition of the juvenile Makkovikian and Ketilidian arcs to the Archean continent.
Samples were additionally plotted on Y versus Nb and Y+Nb versus Rb discrimination diagrams (Pearce, Harris & Tindle, Reference Pearce, Harris and Tindle1984) in order to subdivide the granitoid suites on the basis of the tectonic setting in which they were formed. In both plots (Fig. 11a, b), samples from the Cape Harrison domain and IHBPS lie within the volcanic-arc granite field with little distinction between them. This is consistent with reworking of accreted juvenile arcs in a continental-arc setting. Samples from the central Ketilidian Mobile Belt overlap with the Cape Harrison data, whereas samples from the border zone plot along the boundary between the volcanic-arc granites and within-plate granites. This may just be a result of the granites from the border zone being more evolved relative to the more juvenile Proterozoic mantle source, as they also contain more alkalis and silica in Figure 10.
10. Tectonic interpretation
Previous studies of the Makkovik Province have delivered structural, seismic and geochronological evidence regarding the accretionary history of the Makkovik Province. The earliest concrete evidence for a Makkovikian accretionary event is provided by early Makkovikian plutonic rocks, dated to 1893±2 Ma by Kerr et al. (Reference Kerr, Krogh, Corfu, Schärer, Gandhi and Kwok1992) that cut an older foliation in the Post Hill Group.
Culshaw, Ketchum & Barr (Reference Culshaw, Ketchum and Barr2000) proposed that the (Aillik) arc accretion event caused a switch to craton-ward subduction that initiated continental-arc plutonism, after which the 1.86–1.85 Ga Aillik Group metasediments and metavolcanics were deposited in a rifted arc or back-arc basin. They then proposed a second arc-accretionary event at 1.815 Ga, on the basis of the arc-like chemistry of the Cape Harrison Metamorphic Suite. Tectonic inversion of the Aillik Group was also attributed to this second arc-accretion event. Subsequently, syn- to post-collisional granitoid plutonism occurred at 1.80 Ga and 1.74–1.7 Ga.
In contrast, the new isotopic data presented here, taken in conjunction with published isotopic data, point to a single arc-accretion model for the Makkovik orogeny. While the Aillik domain was previously included as part of the first accreted arc (Kerr et al. Reference Kerr, Hall, Wardle, Gower and Ryan1997; Culshaw, Ketchum & Barr, Reference Culshaw, Ketchum and Barr2000; Ketchum, Culshaw & Barr, Reference Ketchum, Culshaw and Barr2002), the Nd and Hf isotope evidence summarized in Figure 4 shows that the isotopic character of the crust in the Aillik and Cape Harrison domains is completely different. Both domains show a flat trend of T DM model ages against distance from the suture but, while the Aillik domain has a pervasive Archean signature, the Cape Harrison domain has a consistent Palaeoproterozoic signature except for isolated pockets of older crust.
This model is consistent with the tectonic interpretation of the ECSOOT profile by Hall et al. (Reference Hall, Louden, Funck and Deemer2002). Hall et al. proposed an irregular boundary between the Kaipokok and Aillik domains, consistent with the Allik being a magmatically reworked version of the Kaipokok domain. On the other hand, they interpreted the Aillik – Cape Harrison boundary as a sharp but inflected boundary. This resembles the results of the kinematic model of Beaumont et al. (Reference Beaumont, Ellis, Hamilton and Fullsack1996), which suggested that a collisional suture will often be bent back on itself due to back-thrusting in the accreted arc.
In this model, the Kaipokok Bay structure (KBSZ, Fig. 2) would not be regarded as the surficial outcrop of the collisional suture, but as a major shear zone that was established during the collisional event to accommodate vertical and/or transcurrent movements within the orogen. A modern example of this process might be the Cosanga Main Fault of the Ecuadorian Andes, which departs by several tens of kilometres from the Peltetec suture (Alvarado et al. Reference Alvarado, Audin, Nocquet, Jaillard, Mothes, Jarrín, Segovia, Ralandone and Cisneros2016).
By emphasizing the uniform Nd isotope signature of the Cape Harrison domain as a function of distance (Fig. 4), the new isotopic data confirm the sharpness of the Nd isotope boundary between the Aillik and Cape Harrison domains, consistent with the model of Hall et al. (Reference Hall, Louden, Funck and Deemer2002). However, the Nd isotope evidence for a single crustal formation age for the Cape Harrison domain appears to be at odds with the U–Pb evidence for two Makkovikian magmatic episodes. One way of reconciling these two lines of evidence is to envisage magma separation from the mantle at the same time (c. 2.0 Ga) in two separate arcs, which subsequently accreted to pre-Makkovikian Laurentia at different times (c. 1.9 and 1.81 Ga). However, it needs to be demonstrated that the more complex model is essential to explain the data.
The new Pb data presented here confirm that the Cape Harrison domain represents the along-strike equivalent of the Palaeoproterozoic Ketilidian Mobile Belt. The U–Pb data for the Julianehåb Batholith records plutonic activity at 1.84–1.87 Ga and 1.80–1.82 Ga (Garde et al. Reference Garde, Hamilton, Chadwick, Grocott and McCaffrey2002), similar to the two dominant plutonic episodes recorded in the Makkovik Province. However, a two-arc accretion model has not been proposed for the Ketilidian Mobile Belt. Nd isotope data for the Ketilidian Mobile Belt show that the border zone represents a relatively narrow belt of reworked Archean crust, adjacent to which the Julianehåb Batholith represents a wide zone of isotopically homogeneous but geochemically heterogeneous orthogneisses with juvenile Palaeoproterozoic T DM ages (Patchett & Bridgwater, Reference Patchett and Bridgwater1984; Kalsbeek & Taylor, Reference Kalsbeek and Taylor1985).
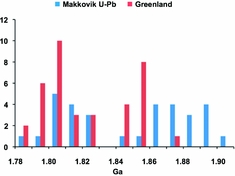
A comparison between the U–Pb distributions for the Makkovik and Ketilidian orogens is presented in Figure 12. The data indicate that plutonic activity peaked twice with approximately similar times in both segments of the orogen during this period, and that both regions experienced a period of quiescence at c. 1.83 Ga. However, the period of inactivity at 1.83 Ga does not support a secondary accretion event; rather, a brief pause in plutonic activity, which has been seen in ensialic arcs such as the Andes (Haschke et al. Reference Haschke, Siebel, Günther and Scheuber2002), is indicated.
Histogram of U–Pb data for the Makkovik orogeny (blue shading) and the Ketilidian orogeny (red shading) in Greenland. Data from Schärer & Gower (Reference Schärer and Gower1988); Kerr et al. (Reference Kerr, Krogh, Corfu, Schärer, Gandhi and Kwok1992); Wasteneys, Wardle & Krogh (Reference Wasteneys, Wardle and Krogh1996); Ketchum, Culshaw & Dunning (Reference Ketchum, Culshaw and Dunning1997); Ketchum et al. Reference Ketchum, Barr, Culshaw and White(2001a); Garde et al. (Reference Garde, Hamilton, Chadwick, Grocott and McCaffrey2002); Ketchum, Culshaw & Barr (Reference Ketchum, Culshaw and Barr2002); Hinchey & Davis (Reference Hinchey and Davis2013).

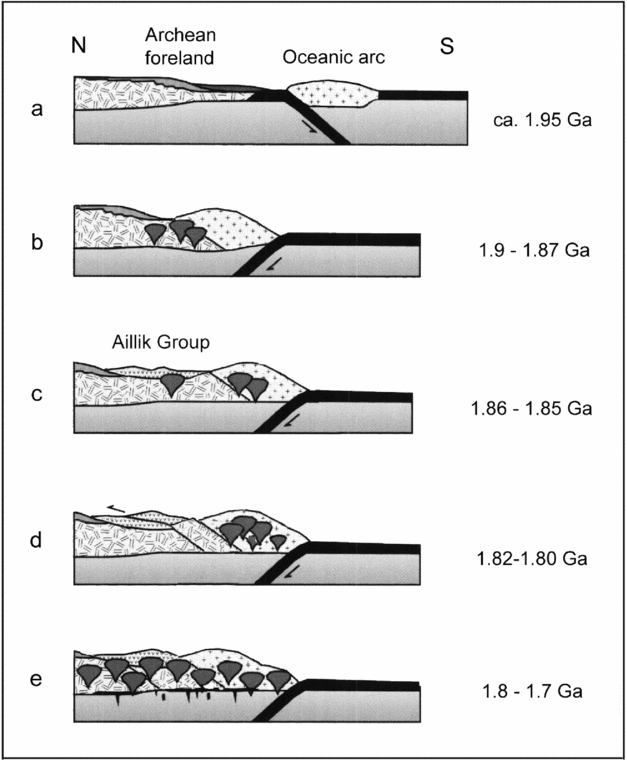
The alternative model for the Makkovik orogeny proposed here begins with an outboard arc approaching the continental margin at c. 2.0 Ga (Fig. 13a). The attempt to subduct the old continental margin under the accreted arc explains the preservation of older passive-margin supracrustal rocks on the Archean side of the suture. This is consistent with the modern analogue of arc accretion proposed by Beaumont et al. (Reference Beaumont, Ellis, Hamilton and Fullsack1996). Arc accretion led to a subduction flip towards the NW, resulting in continental-arc magmatism (Fig. 13b), with plutons dated at 1.9–1.87 Ga (e.g. Barr et al. Reference Barr, White, Culshaw and Ketchum2001).
Revised tectonic model based on data from the current study (modified after Ketchum, Culshaw & Barr, Reference Ketchum, Culshaw and Barr2002).

Deposition of supracrustal units comprising Palaeoproterozoic metavolcanic and metasedimentary rocks from the Aillik Group occurred at 1.86–1.85 Ga (Fig. 13c; e.g. Ketchum, Culshaw & Barr, Reference Ketchum, Culshaw and Barr2002; Sinclair et al. Reference Sinclair, Barr, Culshaw and Ketchum2002). As noted by Kerr et al. (Reference Kerr1994), the vast majority of Aillik Group rocks are found within the area of Archean basement to the NW of the suture (Fig. 2). This is consistent with the formation of a retro-arc foreland basin, which is the typical result of arc accretion onto a continental margin. The accreted arc would have caused loading of the margin that depressed the back-arc region. This is similar to the retro-arc basin developed behind the accretionary margin of the Canadian cordillera, forming the Alberta foreland basin (Cant & Stockmal, Reference Cant and Stockmal1989). At the same time, the continent-ward subduction that resulted from the subduction flip would have caused a temporary reduction in compressive stress across the arc, allowing the development of rift-related magmatism within the basin (Sinclair et al. Reference Sinclair, Barr, Culshaw and Ketchum2002).
The intensification of magmatic activity at c. 1.81 Ga can be explained by phenomena such as changes in subduction angle that are seen within the modern Andean arc system. This would have caused additional uplift of the continental margin, and hence back-thrusting into the foreland basin (Fig. 13d). Finally, diminishing quantities of magmatism continued to 1.72 Ga (e.g. Kerr & Fryer, Reference Kerr and Fryer1994; Culshaw, Ketchum & Barr, Reference Culshaw, Ketchum and Barr2000; Ketchum, Culshaw & Barr, Reference Ketchum, Culshaw and Barr2002), well after the Makkovik orogeny (Fig. 13e).
11. Conclusions
Nd isotope data show that juvenile Makkovikian crust originated outboard the Archean foreland in a single crust-forming event at c. 2.0 Ga, just prior to the Makkovikian orogeny. Older Nd isotopic ages present within the juvenile Palaeoproterozoic crustal zone represent small pockets of older crust that mixed with melts of juvenile mafic crust.
Whole-rock Pb isotope signatures from the Cape Harrison domain also point to a crustal component derived solely from a Palaeoproterozoic mantle-derived source. These data show a clear distinction from published Pb signatures for galena from the Aillik Group, which point to an Archean origin for the basement of the Aillik domain that is similar to the pre-Makkovikian Laurentian foreland. The Pb signatures for samples in the Cape Harrison domain with older Nd model ages plot largely collinear with the juvenile samples, suggesting that their Pb isotope signatures largely equilibrated with the surrounding juvenile crust.
The evidence of dominantly Archean basement below the Aillik domain makes it improbable that this narrow crustal segment represents part of an accreted juvenile arc complex. On the other hand, the homogeneous Palaeoproterozoic Nd and Pb signatures for the Cape Harrison domain make a strong case that this terrane was accreted in a single collisional event. This model is supported by Pb isotope data, which show strong similarities between the juvenile Palaeoproterozoic crust of the Cape Harrison domain and the central Ketilidian Mobile Belt of Greenland.
The spatial correlation of the Aillik Group with Archean basement signatures suggests that the Aillik Group represents a retro-arc foreland basin created by loading of the continental margin that resulted from juvenile arc accretion. The intensification of continent-ward subduction towards 1.8 Ga is typical of the development of Andean-type ensialic arcs, and the resulting crustal uplift can explain the inversion of the Aillik basin without further accretionary events. This revised model for the Makkovikian orogeny is consistent with the proposed development of the Ketilidian Orogen in a single accretionary event.
Acknowledgements
We acknowledge constructive criticism by the journal reviewers that helped to improve the quality of the manuscript. In addition, RM and GA acknowledge McMaster University for scholarship support.
Supplementary material
To view supplementary material for this article, please visit https://doi.org/10.1017/S0016756818000195