

INTRODUCTION
Metaphor is pervasive in human communication. We rely on metaphors not only to express abstract concepts, but also to structure and understand these concepts (Lakoff & Johnson, Reference Lakoff and Johnson1999). In this study, we focus on one such commonly used system of metaphors, namely spatial metaphors for time, and ask how early in development children understand and explain these different spatial time metaphors.
How do adult speakers think and talk about time as spatial motion?
English speakers routinely express and structure ‘time’ in terms ‘spatial motion’. That is, the metaphorical construal of time involves a mapping – both linguistic and conceptual – from the source domain of ‘motion’ to the target domain of ‘time’ (Lakoff & Johnson, Reference Lakoff and Johnson1999). For example, time is motion along a path is a frequently used metaphorical mapping in English that can give rise to a wide range of metaphorical expressions (e.g. ‘hours fly by’, ‘we head to the end of the year’, ‘days follow days’). The mapping is also built on an asymmetry between source (motion) and target (time) concepts. That is, the mapping is unidirectional – from source to target – and the source concept is defined as being more closely related to sensorimotor and/or intersubjective experiences than the target concept (Gibbs, Reference Gibbs1994; Lakoff & Johnson, Reference Lakoff and Johnson1999; see also Fauconnier & Turner, Reference Fauconnier, Turner and Gibbs2008, for a broader description of time metaphors as an emergent structure involving integration of multiple conceptual domains).
The formulation of metaphor as a mapping from more physical to more abstract domains of experience is closely tied to an embodied view of cognition, which suggests that higher-order cognitive abilities have their roots in our everyday bodily experiences (Anderson, Reference Anderson2003; Barsalou, Reference Barsalou2008; Lakoff & Johnson, Reference Lakoff and Johnson1999). In fact, recent work (Miles, Nind & Macrae, Reference Miles, Nind and Macrae2010) suggests that our sensory experiences of moving forward or backward are closely associated with our concept of time. Blindfolded adults, when asked to visualize their past or future life experiences while standing upright, showed bodily sways in line with the location of time they were visualizing. That is, when thinking about the past they swayed backward and when thinking about the future they swayed forward. Moreover, almost all studied languages of the world structure time on a back-to-front bodily axis, with the ‘past behind the body’ and ‘future in front of the body,’ suggesting once again a bodily basis for one's conceptualization of time (Casasanto, Fotakopoulou & Boroditsky, Reference Casasanto, Fotakopoulou and Boroditsky2010; Iwasaki, Reference Iwasaki2009; Moore, Reference Moore2006; Özçalışkan, Reference Özçalışkan2003).
Adult speakers of English – as well as several other languages – rely on a variety of metaphors to talk about time (e.g. time is resource, time is money, time is motion; Lakoff & Johnson, Reference Lakoff and Johnson1999); and spatial metaphors constitute one such subsystem of metaphors that structure our concept of time (Evans, Reference Evans2004; Moore, Reference Moore2000; Reference Moore2006; Iwasaki, Reference Iwasaki2009). The three most commonly used spatial metaphors for time include: (1) moving-time, in which time moves in relation to a stationary observer (e.g. ‘winter approaches’, ‘evening drifts away’); (2) moving-ego, in which observer of time (i.e. ego) moves in relation to a stationary time point (e.g. ‘we approach winter’, ‘we run away from the past’); and (3) sequence-as-relative-position-on-a-path (hereafter sequence-as-position), in which events in time move in relation to one another independent of the observer of time (e.g. ‘winter follows autumn’, ‘playtime comes after lunch’). Previous research with adult speakers suggests that these three spatial metaphors for time evoke conceptually distinct ways of thinking about time (Boroditsky, Reference Boroditsky2000; Gentner, Imai & Boroditsky, Reference Gentner, Imai and Boroditsky2002). Adult speakers are likely to interpret ambiguous time metaphors (e.g. ‘Next Wednesday's meeting has been moved forward two days’) in ways consistent with the motion primes that they observe (Boroditsky, Reference Boroditsky2000). For example, when given moving-ego primes (e.g. person moving towards flower), adults were more likely to say that the meeting had been moved to Friday; but when they were given primes consistent with the moving-time metaphor (e.g. flower moving towards person), they were more likely to say that the meeting had been moved to Monday. Similar patterns have been observed even in everyday situations: people who have recently traveled are more likely to use a moving-ego framework in interpreting similar ambiguous time metaphors than people who have not yet traveled (Boroditsky & Ramscar, Reference Boroditsky and Ramscar2002). Adults also showed increased reaction times in comprehension when presented with motion primes inconsistent with the time metaphors that they hear (e.g. flower moving towards person followed by the statement ‘we are approaching the weekend’; Gentner et al., Reference Gentner, Imai and Boroditsky2002). Overall, these results suggest that the three metaphor types trigger different ways of thinking about time in adult speakers.
How early in development do children learn to think and talk about time as spatial motion?
Previous research with adult speakers suggests that the three common spatial metaphors for time (moving-time, moving-ego, sequence-as-position) are frequently used by adult speakers of English and evoke different ways of thinking about the concept of time. However, there is no existing work examining developmental changes in children's understanding of these three different spatial time metaphors, which capture one of the most fundamental domains of human experience.
We know from previous work that metaphor comprehension and production constitute significant milestones in children's language development (Gardner, Winner, Bechhofer & Wolf, Reference Gardner, Winner, Bechhofer, Wolf and Nelson1978; Lee & Kamhi, Reference Lee and Kamhi1990; Özçalışkan, Reference Özçalışkan and Hogan2010). Children begin to understand and produce metaphors shortly after they begin to speak (Billow, Reference Billow1981; Gardner et al., Reference Gardner, Winner, Bechhofer, Wolf and Nelson1978; Özçalışkan, Goldin-Meadow, Gentner & Mylander, Reference Özçalışkan, Goldin-Meadow, Gentner and Mylander2009), and their metaphorical abilities improve with age (see Özçalışkan, Reference Özçalışkan and Hogan2010, for a review). Research has shown that children begin to spontaneously produce simple perceptual metaphors as young as two years of age (Billow, Reference Billow1981), which involve simple perceptual similarity comparisons of things that look alike or are functionally similar to one another (Billow, Reference Billow1981; Gentner, Reference Gentner1988; Özçalışkan et al., Reference Özçalışkan, Goldin-Meadow, Gentner and Mylander2009; Winner, Reference Winner1979). For example, a child might say that ‘a cherry lollipop is like a stop sign’, because both objects are red, round, and attached to a stick (Mendelsohn, Robinson, Gardner & Winner, Reference Mendelsohn, Robinson, Gardner and Winner1984). Children then progress to more complex structural mappings, in which they typically map physical terms onto abstract concepts, such as referring to someone as ‘cold as ice’ to indicate how unemotional that person is (Gardner et al., Reference Gardner, Winner, Bechhofer, Wolf and Nelson1978; Waggoner & Palermo, Reference Waggoner and Palermo1989). The emergence of these structural metaphors can even be observed as early as kindergarten age, when the source or target domains of the metaphors are more familiar to children (Keil, Reference Keil1986; Özçalışkan, Reference Özçalışkan2005). For example, five-year-old children can both understand and explain metaphors that are structured by motion (‘ideas wander through the mind’; Özçalışkan, Reference Özçalışkan2005; Reference Özçalışkan2007) – a source domain that structures a wide range of abstract concepts in English (Özçalışkan, Reference Özçalışkan2003).
Interestingly, most of the earlier developmental work on metaphor comprehension and explanation focused on metaphors that involve extensions of object properties (e.g. sweet person, warm person; Ash & Nerlove, Reference Asch, Nerlove, Kaplan and Wapner1960; Waggoner & Palermo, Reference Waggoner and Palermo1989), leaving metaphors that involve extensions of actions relatively unexplored. One exception to this is an earlier study by Özçalışkan (Reference Özçalışkan2007), which examined developmental changes in children's understanding of abstract concepts structured by spatial motion (e.g. ideas bounce in the head, illness crawls through the body). This earlier study examined three- to five-year-old children's comprehension and explanation of ‘moving-time’ metaphors in English and Turkish and found early onset of metaphorical abilities. Children – learning either English or Turkish – were able to understand the meaning of moving-time metaphors by age four and could provide explanations for the different instantiations of the moving-time metaphors by age five (e.g. “Time crawling means it is going really slowly like when I am bored”; Özçalışkan, Reference Özçalışkan2007). However, we still do not know whether children understand and explain the other two metaphor types for time – moving-ego and sequence-as-position – at an early age as well, showing a grasp of the whole system of spatial metaphors for time.
In this study, our goal is to focus on a system of spatial metaphors for time (moving-time, moving-ego, and sequence-as-position), and to determine the developmental trajectory of children's understanding of each spatial metaphor type within this system. Based on earlier work (Özçalışkan, Reference Özçalışkan2007) that showed significant improvements in children's understanding and explanation of ‘moving-time’ metaphors around age five, we predict that children's overall comprehension of each metaphor type will improve with age, with a reliable change around five years of age. Also based on earlier work with adult speakers who showed increased response times when answering questions framed in sequence-as-position metaphors as opposed to moving-ego metaphors (Gentner et al., Reference Gentner, Imai and Boroditsky2002), we predict that metaphor type will have an effect on both comprehension and explanation, with children showing better performance in understanding and explaining moving-ego and moving-time metaphors than they do for sequence-as-position metaphors.
METHODS
Participants
The participants consisted of sixty children, at the ages of three (mean age = 3;5, range = 3;1–3;11), four (mean age = 4;6, range = 4;1; 4;11), five (mean age = 5;6, range = 5;2–5;10), and six (mean age = 6;7, range = 6;3–6;11), with fifteen participants in each age group, along with fifteen adults (mean age = 22, range = 18–50), all native speakers of English. There were roughly equal numbers of males and females in each age group. Child participants were predominantly Caucasian (62%) and African American (27%); adult participants were predominantly African American (60%), Caucasian (20%), or had mixed ethnic–racial backgrounds (20%).
Data collection
Children's comprehension and explanation of spatial metaphors for time were assessed by using six short stories, each containing one of the three metaphor types for time, namely moving-time, moving-ego, and sequence-as-position, with two stories per metaphor type. Each child first participated in a metaphor comprehension task followed by a metaphor explanation task, based on each story. In the metaphor comprehension task, children were asked to answer forced-choice questions about the metaphor in each story. In the metaphor explanation task, they were asked to explain their forced-choice responses. The data collection from children involved two puppets (Elmo and Grover), which provided the answers to each question. The child's task was to choose the puppet with the correct answer and then explain the choice. The data collection from adults did not involve the use of the puppets. The puppet that provided the correct choice was counterbalanced across children within each age group, and the presentation order of the six stories was randomized across subjects in each age group (see examples 1–3; metaphors in the stories are underlined).
The stimulus stories were chosen from among a larger set of stories that were tested for their informative content without the metaphors with a group of adults (N = 83, M age = 25) to ascertain that children were providing correct choices based on their understanding of the metaphors but not because of the story context; only stories that elicited random forced-choice responses (50% correct: 50% incorrect) without the metaphors were selected and included in the study as stimulus stories after the addition of metaphors. Each of the six stories was comparable in length and complexity (i.e. mean length of utterance in words: MLUrange = 4·2–5·6); their presentation was also accompanied by simple black and white drawings of the two characters in each story.
(1) Moving-ego
Stimulus story:
This is Rob [Experimenter (E) points to picture of a child character]. This is Rob's friend Kyle [E points to picture of another child character]. Kyle tells Rob that he has a long way to go until his party. Rob is disappointed. He says “ugh”. Why is Rob disappointed?
elmo: His party is later (correct choice);
grover: His party is over (incorrect choice);
E: Why did you choose Elmo/Grover?
Children's responses:
(3;6) [incorrect choice]: ‘Because he has to go to bed’ (irrelevant explanation)
(4;10) [incorrect choice]: ‘Because he missed his party’ (irrelevant explanation)
(5;7) [correct choice]: ‘Because it is later’ (semi-relevant explanation)
(6;8) [correct choice]: ‘A long way, that means you have to wait’ (relevant explanation)
(2) Moving-time
Stimulus story:
This is Patrick [E points to picture of a child character]. This is Patrick's Mom [E points to picture of an adult character]. Patrick's mom tells him that his trip to the zoo is coming up. Patrick gets really excited! He shouts “Yeah!” Why is Patrick so excited?
elmo: His trip to the zoo is soon (correct choice);
grover: His trip to the zoo is now (incorrect choice);
E: Why did you choose Elmo/Grover?
Children's responses:
(3;4) [incorrect choice]: ‘Because he is so excited’ (irrelevant explanation)
(4;7) [incorrect choice]: ‘Because he did a good thing again’ (irrelevant explanation)
(5;4) [correct choice]: ‘Because his mother said it’ (irrelevant explanation)
(6;8) [correct choice]: ‘Because the day that you are on the zoo is coming, is almost here’ (relevant explanation)
(3) Sequence-as-position
Stimulus story:
This is Stacy [E points to picture of a child character]. This is Stacy's sister Carol [E points to picture of another child character]. Carol says that ice cream follows lunch. Stacy is excited. She's says “Yippee!” Why is Stacy excited?
elmo: Ice cream is soon (correct answer);
grover: Ice cream is now (incorrect answer);
E: Why did you choose Elmo/Grover?
Children's responses:
(3;8) [incorrect answer]: ‘Because it is trying to lick an ice cream cone’ (irrelevant explanation)
(4;7) [incorrect answer]: ‘Because ice cream is yummy’ (irrelevant explanation)
(5;8) [correct answer]: ‘Because ice cream is after lunch’ (semi-relevant explanation)
(6;7) [correct answer]: ‘Because ice cream is coming up soon’ (relevant explanation)
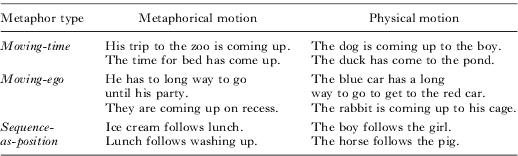
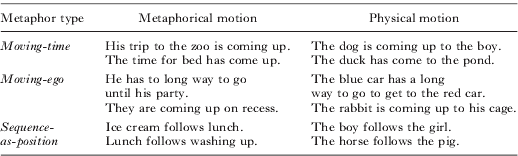
In addition, to test whether children understood the literal meanings of the terms used in the metaphorical expressions in the stories, we presented each child with six physical motion descriptions (e.g. ‘the dog is coming up to the boy’) and asked them to choose between two pictures (e.g. dog approaching boy vs. dog moving away from boy), only one of which matched the physical description. The physical motion descriptions used the same verbs and prepositions as the metaphorical descriptions in the stories, but only conveyed physical motion meaning, thus serving as non-metaphor control sentences (see Table 1 for the six metaphorical motion expressions included in the stories and the six corresponding physical motion descriptions).
Metaphorical motion statements in the metaphor comprehension task and the corresponding physical motion statements in the picture-choice task
Data analysis
Children's response to each forced-choice question in the metaphor comprehension task was assessed on a binary scale as either 0 (correct response) or 1 (incorrect response), and their explanation for each forced-choice answer in the metaphor explanation task was assessed on a 3-point scale as either 0 (irrelevant explanation), 1 (semi-relevant explanation), or 2 (relevant explanation). Reliability was assessed on 50% of all explanations with a second coder, with 85% agreement (k = 0·81, N = 32). We also assessed children's performance on the physical motion task on a binary scale as either 0 (correct match) or 1 (incorrect match), resulting in a maximum possible score of 6 across all six descriptions. Children's metaphor comprehension and metaphor explanation scores were analyzed separately, using two-way ANOVAs, with age (3-, 4-, 5-, 6-year-olds, adults) as a between-subjects factor and metaphor type (moving-time, moving-ego, sequence-as-position) as a within-subject factor. We also assessed differences from chance performance in overall metaphor comprehension scores using independent t-tests. In addition, differences in children's understanding of metaphorical motion vs. physical motion descriptions were analyzed with a two-way ANOVA, with age as a between-subjects factor and description type (metaphorical motion, physical motion) as a within-subject factor. We tested for homogeneity of variance for between group comparisons using Levene's test of equality of error variances, and found no significant differences in variance in any of the comparisons, except for main effect of age in metaphor comprehension (Levene statistic, p = 0·02). Accordingly, for metaphor comprehension analysis we used Brown-Forsythe F-ratio and Games Howell corrections for assessing main effect of age and post hoc comparisons for age, respectively. The effect sizes were computed by using partial eta-squared (hereafter pη2) for ANOVA comparisons and Cohen's d (hereafter d) for t-tests.
RESULTS
We first examined overall changes in children's metaphorical abilities across all three metaphor types, and found early comprehension. Five-year-olds performed significantly above chance in providing correct forced-choice responses (65% correct; t(14) = 3·17, p = 0·007, d = 2·15), marking the onset of metaphor comprehension at age five. In contrast, both three- and four-year-olds were at chance (48% correct, t(14) = −0·397, p = 0·7; and 57% correct, t(14) = 1·16, p = 0·4, respectively) in their responses to the questions about the metaphors in the stories.
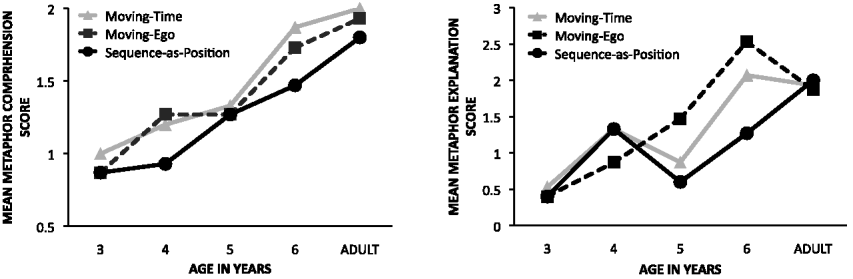
Next we asked whether children would differ in their comprehension and explanation of the different spatial metaphors for time (moving-ego, moving-time, sequence-as-position) over developmental time. Beginning with metaphor comprehension, which was measured by children's correct forced-choice responses in the story task, we found an effect of age (F(4, 54) =1 5·81, p < 0·001, pη2 = 0·47) and metaphor type (F(2, 140) = 3·24, p = 0·042, pη2 = 0·04), but no interaction (F(8, 140) = 0·419, p = 0·9). As can be seen in Figure 1A, children steadily improved their metaphor comprehension over time, with a significant change between ages five and six (M five = 3·93 [SD = 1·6] vs. M six = 5·13 [SD = 0·90], Games Howell, p = 0·04). The adults (M = 5·73 [SD = 0·45]) and six-year-olds, on the other hand, did not differ from each other in their rate of correct responses (Games Howell, p = 0·25), suggesting adult-like metaphor comprehension abilities by age six. Overall, children performed marginally worse in grasping the meaning of sequence-as-position metaphors than both moving-time (LSD, p = 0·01) and moving-ego (LSD, p = 0·09) metaphors. However, there was no reliable difference (LSD, p = 0·45) in their comprehension of moving-time and moving-ego metaphors.
Mean metaphor comprehension score (Panel A) and mean metaphor explanation score (Panel B) for moving-time (solid gray lines), moving-ego (dashed gray lines) and sequence as position metaphors (solid black lines) by child age. note: We plotted the data using line graphs for clarity of presentation even though the design was cross-sectional.

Turning next to metaphor explanation, which was measured by children's explanations for their forced-choice responses in the story task, we once again found an effect of age (F(4, 70) = 8·39, p < 0·001, pη2 = 0·32), and metaphor type, (F(2, 70) = 6·46, p = 0·003, pη2 = 0·06) as well as a significant interaction (F(6, 70) = 3·67, p = 0·001, pη2 = 0·14). Children provided better explanations for their forced-choice responses over time, with a significant change between ages five and six (M five = 2·93 [SD = 1·9] vs. M six = 5·6 [SD = 2·7], LSD, p = 0·03). And similar to the metaphor comprehension task, six-year-olds did not differ reliably from adults (M = 5·53, [SD = 2·7]) in the quality of their explanations (LSD, p = 0·94), suggesting adult-like explanation abilities by age six (see Figure 1B). One interesting difference, however, was that unlike six-year-olds, who focused their explanations on the metaphorical statements in the stories, adults tended to focus on the reasons for the emotional reactions of the characters in their explanations, which also led to lower explanation scores for the adults. Overall, participants did worse in justifying their responses to the questions about the meaning of sequence-as-position metaphors than both moving-time (LSD, p = 0·02) and moving-ego (LSD, p = 0·007) metaphors; and this pattern was particularly pronounced for the five-year-olds (moving-ego vs. sequence-as-position: LSD, p = 0·04) and the six-year-olds (moving-ego or moving-time vs. sequence-as-position: LSD, ps < = 0·01). However, children did not differ in their explanations for the moving-time and moving-ego metaphors at any age (LSD, ps = 0·1; see examples 1–3 for sample forced-choice responses in brackets and explanations provided by children for each metaphor type).
Last, we examined differences between children's understanding of the metaphorical motion descriptions in the stories and their understanding of the corresponding physical motion descriptions in the picture choice task, and found a significant effect of motion type (F(1, 56) = 90·50, p < 0·001, pη2 = 0·62), a significant effect of age (F(1, 56) = 10·47, p < 0·001, pη2 = 0·36), and a significant interaction (F(3, 56) = 2·81, p = 0·048, pη2 = 0·13). Overall, children understood the meaning of physical motion descriptions significantly better than the meaning of metaphorical motion descriptions (M physical motion = 5·57 [SD = 0·93] vs. M metaphorical motion = 3·85 [SD = 1·49]), but it was their understanding of metaphorical motion descriptions – not physical motion descriptions – that improved reliably with age. Almost all children (N = 58/60) performed at ceiling in the physical motion description task, showing that they all understood the physical meaning of the motion expressions used in the metaphors by age three, with no reliable change over time.
DISCUSSION
In this study we examined three- to six-year-old children's ability to understand and explain the different spatial metaphors for time, namely moving-time, moving-ego, and sequence-as-position, and found early onset of both metaphor comprehension and metaphor explanation abilities. Children were able to understand the meaning of spatial metaphors for time reliably above chance by age five; they also began to provide relevant explanations for the different time metaphors by age six. These findings further extend previous work on children's comprehension and explanation of moving-time metaphors (e.g. Özçalışkan Reference Özçalışkan2004; Reference Özçalışkan2007) to the other two spatial metaphors for time (moving-ego, sequence-as-position-on-a-path), but with a delay of one year in achieving each milestone. The one-year gap in children's performance between this earlier work and ours is likely to be an outcome of the difficulty associated with the sequence-as-position metaphors. Our results showed that children performed worse in both understanding and explaining sequence-as-position metaphors for time as compared to moving-ego and moving-time metaphors.
What makes sequence-as-position metaphors more difficult for children? There are several possible explanations. One possibility is that the sequence-as-position metaphor is cognitively more challenging than other spatial metaphors for time because it draws on the child's experience as an observer of time's motion through space. Indeed, previous work by Gentner et al. (Reference Gentner, Imai and Boroditsky2002), which showed longer reaction times in adults' responses to questions about sequence-as-position metaphors than to questions about moving-ego metaphors, provides support for this possibility. Gentner and colleagues argued that sequence-as-position metaphors are more difficult for adults because they typically contain a temporal relationship between two events and an implicit observer, whereas moving-ego metaphors contain just the relationship between an event and an observer.Footnote 1
A second possibility is that the moving-ego and moving-time metaphors present a more embodied conception of time. Humans have a myriad of experience with the movement of their bodies through space; and moving-ego and moving-time metaphors are based on this experience: the former frames time as moving toward or away from a stationary self, while the latter construes the self as moving toward or away from a stationary point in time. Moving-time and moving-ego metaphors thus rely only on our first person perspective, something with which all humans have considerable experience, whereas sequence-as-position metaphors rely on the observation of the relational movement of multiple events that are independent from the self, namely the ego or the observer of time. There is, in fact, a growing body of evidence that suggests that our bodily experience is an important ingredient in forming knowledge representations and that linguistic meaning is grounded in sensorimotor experience (Barsalou, Reference Barsalou2008; Glenberg & Kaschak, Reference Glenberg and Kaschak2002; Lakoff, Reference Lakoff1987). As such, metaphors couched in first person motion experience may be easier for children to comprehend, as children rely heavily on sensorimotor schemas to make sense of the world that surrounds them (Piaget, Reference Piaget1973; Mandler, Reference Mandler, Bloom, Peterson, Nadel and Garrett1999).
A third, but not mutually exclusive, possibility is that changes in children's understanding of others' minds, thus perspective taking ability, might serve as a stepping stone in grasping the meaning of time metaphors that are not framed in first person perspective. Researchers argue that changes in understanding others' mental states (at least partly) explain changes in children's metaphorical abilities (e.g. Happé, Reference Happé1993; Reference Happé1995; Martin & McDonald, Reference Martin and McDonald2004; Schnell, Reference Schnell2007). According to this view, children's understanding of others' mental states (i.e. theory of mind understanding) shows rapid progress in preschool years, and children begin to understand that others may have different beliefs than their own around ages four to five (Welman, Reference Welman1990); the age at which they also show significant improvements in their metaphor comprehension (Schnell, Reference Schnell2007). Unlike moving-time and moving-ego metaphors, sequence-as-position metaphors require a perspective outside of the child's immediate first person ‘egocentric’ experience with time (i.e. time moving towards child, child moving towards time); as such, the understanding of others' minds as separate from one's own might serve as an important social–cognitive ability that could feed into the developmental change in children's understanding of sequence-as-position metaphors.
Research on metaphor suggests early production abilities: soon after they produce their first words, children begin to spontaneously produce a range a novel perceptual metaphors highlighting similarities between objects (e.g. calling a half-peeled banana a ‘flower’, Elbers, 1988; saying ‘like ice-cream’ while pointing to a mushroom, Özçalışkan et al., Reference Özçalışkan, Goldin-Meadow, Gentner and Mylander2009). This initial period of development, rich in lexical innovations, is followed by a period marked by limited production of spontaneous metaphors in the early school years, and there is no existing work examining children's spontaneous production of more complex structural metaphors in everyday contexts. Our study focused on children's comprehension of such structural metaphors and has provided evidence that children can both understand and explain their understanding of structural metaphors for time by five to six years of age. However, the question remains as to whether the production of such structural metaphors precedes, coincides with, or follows their comprehension in development – a question that only future studies could answer. Our study also used a quasi-experimental, cross-sectional design, focusing on a subsystem of metaphors for time. Future research examining a broader range of time metaphors, using longitudinal observations in everyday contexts (e.g. parent–child interactions at home) could shed further light on how early in development children both understand and produce the different metaphors for time.
The tasks that we used in assessing children's metaphorical abilities in our study were linguistic in nature, raising the possibility that the observed changes in metaphor comprehension and explanation might simply be an artifact of more global changes in children's language abilities, particularly their metalinguistic ability (Winner, Reference Winner1979). Metaphor involves a correspondence between two semantic domains, giving rise to meanings that require both differentiation of lexical meanings within each semantic domain and integration of these meanings as a juxtaposition of the two domains (Kittay & Lehrer, Reference Kittay and Lehrer1981). For example, in order to grasp the meaning of the metaphor ‘she is a sweet person’, the child needs to differentiate the word ‘sweet’ from other taste terms (e.g. ‘sour’, ‘bitter’) against a gradient of personality types, and arrive at the metaphorical meaning by integrating his/her semantic knowledge of both of these domains. Not surprisingly, the metalinguistic ability to understand that words can simultaneously have a literal and an extended metaphorical meaning takes time to develop. As shown in previous work (e.g. Asch & Nerlove, Reference Asch, Nerlove, Kaplan and Wapner1960; Özçalışkan, Reference Özçalışkan2005), children initially focus exclusively on the source domain (i.e. literal) meaning of a metaphor in their explanations, treating metaphorical statements as if they are literally true (e.g. ‘time flies by means it flies like a bird’), and only later produce explanations that show their integrated knowledge of the source and target domain meanings (e.g. ‘time flies by means it goes by fast not giving me much time to color’; Özçalışkan, Reference Özçalışkan2005). A similar developmental trajectory might be at work here, with children initially focusing on the source domain meaning of the spatial metaphors for time, and only later developing the metalinguistic ability to reflect on the underlying meaning of these metaphorical statements based on both the source and the target semantic domains.
In our study, children were also able to verbally explain their understanding of metaphorical meanings a year later than they were able to understand the same metaphors in a non-verbal comprehension task. Similar differences have been reported in previous work: children show better metaphorical abilities in tasks that exert fewer linguistic demands (i.e. identifying meaning of a metaphor in a multiple-choice task) compared to tasks that impose greater linguistic demands (i.e. paraphrasing meaning of a metaphor; e.g. Winner, Rosentiel & Gardner, Reference Winner, Rosenstiel and Gardner1976). As such, it is possible that overall changes that we have observed in children's metaphorical abilities, particularly in their explanations, might be an outcome of their growing metalinguistic abilities that allows for explicit linguistic reflection on the part of the child. At the same time, however, beyond changes in linguistic ability as contributing to metaphor development, our findings also showed that children were better at understanding metaphors based on the movement of their own bodies than the metaphors that are less directly tied to their sensorimotor experiences, thus suggesting an effect of embodiment in metaphor development. It will be important to explore the generalizability of this effect in future studies, by comparing metaphor comprehension across a wider range of abstract domains that vary in degree of embodiment in their metaphorical construal.
In summary, our results show early understanding of spatial metaphors for time. Children can grasp the meaning of the moving-ego, moving-time, and sequence-as-position metaphors by age five and begin to verbally explain their metaphorical interpretations by age six. Children's emerging ability to understand the three spatial metaphors for time also show variability, with metaphors that structure time in relation to the observer of time being mastered earlier than metaphors that structure time without any relation to the observer of time. These findings thus lend support to the distinctive role our bodily experiences could play in our developing understanding of abstract concepts.