

Introduction
Flexibility is an important characteristic for success in dynamic – and sometimes unpredictable and hypercompetitive – environments. Those strategic discontinuities compel companies to adapt quickly to changing rules, market demands and more powerful technology (D’Aveni, Reference D’Aveni1998; Eisenhardt & Martin, Reference Eisenhardt and Martin2000; Teece, Reference Teece2007). In this scenario, flexibility is considered a crucial resource for organisations, allowing them to react to environmental challenges and crises (Grewal & Tansuhaj, Reference Grewal and Tansuhaj2001), to generate changes and to promote performance and innovation (Das & Elango, Reference Das and Elango1995; Volberda & Rutges, Reference Volberda and Rutges1999; Anand & Ward, Reference Anand and Ward2004; West & Sacramento, Reference West and Sacramento2006; Verdu & Gomez-Gras, Reference Verdu, Lorens-Montes and Garcia-Morales2009). Specifically, the literature suggests that flexibility is essential for innovation (Thurston & Runco, Reference Thurston and Runco1999; Patterson et al., Reference Patterson, West, Shackleton, Dawson, Lawthom, Maitlis, Robinson and Wallace2005) because it is expressed in (1) the use of divergent problem-solving strategies, such as redefining a criticality by adopting different perspectives or seeing ordinary things in unusual ways; (2) in adopting new methods when old ones are no longer useful; and (3) in combining existing knowledge and making connections between elements belonging to distant domains (Georgsdottir & Getz, Reference Georgsdottir and Getz2004). Research on flexibility confirms its role as an essential success factor for coping with increased market dynamism and providing rapid and innovative responses (Golden & Powell, Reference Golden and Powell2000; Koornhof, Reference Koornhof2001; Englehardt & Simmons, Reference Englehardt and Simmons2002; Friedli, Billinger, Kickuth, & Fleisch, Reference Fernandez-Perez, Fuentes-Fuentes and Bojica2004; Fernandez-Perez, Fuentes-Fuentes, & Bojica, Reference Friedli, Billinger, Kickuth and Fleisch2012).
In addition, organisations, to manage uncertainty, need reflexive processes that allow them to understand environmental conditions. In fact, reflexivity refers to ‘the extent to which group members overtly reflect on, and communicate about the group’s objectives, strategies (decision-making) and processes (communication) and adapt these to current or anticipated circumstances’ (West, Reference West2000, p. 3). Thus, organisations can activate this generative learning process to monitor and reshape their own routines and established knowledge, question methods and habits, and reframe their goals in light of new challenges. For this reason, reflexivity is considered another organisational strategy to promote innovation, even if evidence of its influence on innovation is still limited (Tjosvold, Tang, & West, Reference Tjosvold, Tang and West2004; Patterson et al., Reference Patterson, West, Shackleton, Dawson, Lawthom, Maitlis, Robinson and Wallace2005; MacCurtain, Flood, Ramamoorthy, West, & Dawson, Reference MacCurtain, Flood, Ramamoorthy, West and Dawson2010; Lee & Sukoco, Reference Lee and Sukoco2011; for a review see Farnese & Livi, Reference Farnese and Liviforthcoming).
Given this, the first aim of this study is to simultaneously investigate the specific contribution of both flexibility and reflexivity on innovation. To the best of our knowledge, only Patterson et al.’s (Reference Patterson, West, Shackleton, Dawson, Lawthom, Maitlis, Robinson and Wallace2005) study has simultaneously analysed the role of both flexibility and reflexivity on organisational innovation, showing that both factors highly influenced innovation 1 year later. In line with the seminal conceptualisation proposed by Zaltman, Duncan, and Holbeck Zaltman (Reference Zaltman, Duncan and Holbeck1973), innovation will be examined considering two different dimensions. The first is openness toward innovation, referring to the initiating phase of the innovation process, which is the degree to which the members of an organisation are willing or are resistant to change. The second dimension is the innovation adoption, which is the effective implementation of new ideas, processes or products (Damanpour & Schneider, 2006; Santos-Vijande, Lopez-Sanchez, & Gonzalez-Mieres, Reference Santos-Vijande, Lopez-Sanchez and Gonzalez-Mieres2012).
A further aim of our study is to examine not only the additive role of both flexibility and reflexivity strategies on innovation but also their interactive effect. Indeed, bearing in mind that flexibility and reflexivity are two strategies rooted on different and sometimes inconsistent mechanisms to pursue innovation, we hypothesise that they can complement each other: when one strategy becomes ineffective as a result of its specific disadvantages, the other can be adopted to respond adequately and pursue the innovation process, in this way counterbalancing the former’s disadvantages. For instance, when high exogenous environmental turbulence requires very rapid decision times, it makes the reflexive option less viable. On the other hand, when the organisation requires high formalisation (e.g., in high reliability organisations that require high control and low tolerance of errors; Roberts, Reference Roberts1990) or when the maturation stage of the lifecycle implies an increment of routines and planning rigidity (Volberda, Reference Volberda1997), flexibility becomes an infeasible option. To date, to the best of our knowledge, no study has examined this interaction between these two strategies. This hypothesis is in line with the dualism theory, suggesting that organisations should allocate their resources differently to maintain balance between rapid and divergent flexible responses, while also maintaining more cautious and exploitative reflexive practices (March, Reference March1991; Zollo & Winter, Reference Zollo and Winter2002; Sutherland & Smith, Reference Sutherland and Smith2011). Having both strategies potentially available and choosing from time to time, which is more advantageous, organisations manage to reconstruct the paradox between stability and change.
Theoretical Framework and Hypotheses
Organisational flexibility: A strategy for managing the need for change
Flexibility can be defined as the organistional capability useful to give different and speed responses to environmental uncertainty (Volberda, Reference Volberda1996). Since the first studies on organisational contexts in the 1970s (Donaldson, Reference Donaldson1971), flexibility has been conceived as an ability that discriminates high-performing from low-performing organisations in situations of uncertainty and instability (Thurston & Runco, Reference Thurston and Runco1999; Georgsdottir & Getz, Reference Georgsdottir and Getz2004; Biedenbach & Soderholm, Reference Biedenbach and Soderholm2008; Verdu & Gomez-Gras, Reference Verdu, Lorens-Montes and Garcia-Morales2009), supporting their readiness to face changes and try new ways of doing things, rather than remaining in a stagnant situation. Further studies have provided evidence that flexibility facilitates a company’s successful adaptation and enhances the need for change, above all when markets are highly competitive (Grewal & Tansuhaj, Reference Grewal and Tansuhaj2001; Anand & Ward, Reference Anand and Ward2004; Verdu & Gomez-Gras, Reference Verdu, Lorens-Montes and Garcia-Morales2009). Many authors consider it as a strategic capacity to cope with external challenges, predicting flexibility as ‘a major driver for strategic repositioning’ (Friedli et al., Reference Fernandez-Perez, Fuentes-Fuentes and Bojica2004, p. 3); ‘a strategic asset in situations in which anticipation is impossible’ (Volberda & Rutges, Reference Volberda and Rutges1999, p. 99); or even ‘the capability to turn unexpected events, including crises, into opportunities or at least restoring [sic] equilibrium quickly’ (Basadur & Gelade, Reference Basadur and Gelade2006, p. 47). According to some authors, flexibility may be considered a cultural orientation, which emphasises the worth of change, adaptation and a dynamic relationship with the environment, and usually adopted by organic structures (Quinn & Cameron, Reference Quinn and Cameron1983; Quinn & Rohrbaugh, Reference Quinn and Rohrbaugh1983). Thus, scholars clearly define flexibility as an organisational strategy enhancing the employees attitude toward innovation and their willingness to accept it. Basing on the aforementioned literature, we first aim to provide empirical support for these theoretical and research suggestions, specifically hypothesising:
Hypothesis 1: The greater the organisation’s flexibility the higher its openness towards innovation.
Literature on flexibility has also well established its influence on actual innovation. For instance, scholars found that flexibility positively influenced innovation in firms (Verdu, Lorens-Montes, & Garcia-Morales, Reference Verdu and Gomez-Gras2005; Martinez-Sanchez, Vela-Jimenez, Perez-Perez, & de-Luis-Carnicer, Reference Martinez-Sanchez, Vela-Jimenez, Perez-Perez and de-Luis-Carnicer2008) and also in the health sector (Dias & Escoval, Reference Dias and Escoval2013), and that it is significantly related to new products development (Tatikonda & Rosenthal, Reference Tatikonda and Rosenthal2000; Yi, Yuan, & Zelong, Reference Yi, Yuan and Zelong2009). Scholars identified different ways in which this strategy has been realised. For example, organisations high in flexibility have unique characteristics: (1) greater inter-functional communication and coordination that, by creating temporary disequilibria, reduces the comfort zones of single units and the consequent inertia and resistance to change and risk-taking (Auh & Menguc, Reference Auh and Menguc2005; Martinez-Sanchez et al., Reference Martinez-Sanchez, Vela-Jimenez, Perez-Perez and de-Luis-Carnicer2008); (2) a broader functional diversity that breeds diverse approaches to problem solving (Knight et al., Reference Knight, Pearce, Smith, Olian, Sims, Smith and Flood1999); (3) non-routine tasks, absence of rigid rules and more challenging jobs (van der Vegt & Janssen, Reference van der Vegt and Janssen2003); and (4) a shorter reaction time for responding to environmental changes that reduces the gap between decision and action (Eisenhardt & Tabrizi, Reference Eisenhardt and Tabrizi1995; Volberda, Reference Volberda1996), implements efficiency and responsiveness (Golden & Powell, Reference Golden and Powell2000) and accelerates learning processes (Englehardt & Simmons, Reference Englehardt and Simmons2002). Thus, we further hypothesise:
Hypothesis 2: The greater the organisation’s flexibility, the higher its adoption of innovation.
Reflexivity: A learning practice for innovation
Reflexivity is a knowledge management practice that fosters organisational innovativeness, as it is a learning process that questions habits and routines, monitors existing methodologies and operative procedures, verifies the effectiveness of goals and, consequently, promotes change and a double-loop learning process (Argyris & Schön, Reference Argyris and Schön1996; West & Anderson, Reference West and Anderson1996; West & Sacramento, Reference West and Sacramento2006; Lee & Sukoco, Reference Lee and Sukoco2011). It is a process of sense-making and construction of new shared meanings that questions the consolidated ways in which individuals give meaning to their realities (West & Anderson, Reference West and Anderson1996; Hoegl & Parboteeah, Reference Hoegl and Parboteeah2006) consistent with the organisational vision (Schippers, Den Hartog, Koopman, & van Knippenberg, Reference Schippers, Den Hartog, Koopman and van Knippenberg2008) and helpful for innovation (Fuglsand & Mattsson, Reference Fuglsand and Mattsson2011). Thus, reflexivity offers an advantage that, by contributing to reframing organisational practices, elicits awareness about the needs for change and searching for new solutions (West & Sacramento, Reference West and Sacramento2006; Wong, Tjosvold, & Su, Reference Wong, Tjosvold and Su2007). To summarise, reflexive practices enable the organisation to be more adaptive and responsive to external demands, generating discontinuous learning and employees’ ‘conceptual readiness’ for innovation (West, Reference West2002; West & Sacramento, Reference West and Sacramento2006), although not always resulting in the implementation of innovation (MacCurtain et al., Reference MacCurtain, Flood, Ramamoorthy, West and Dawson2010). In line with this assumption, we hypothesise:
Hypothesis 3: The greater the organisation’s reflexivity, the higher its openness towards innovation.
Organisations that adopt reflexive practices tend to innovate at higher rates for several reasons. First, the reflexive process requires continuous monitoring, great attention to detail, non-avoidance of potential problems, critical debate and an ability to plan for the short and medium term and to decode the complexity of environmental questions for better adaptation. In this way, reflexivity enhances an organisation’s ability to engage in the decision-making process through critical evaluation of alternative ideas or viewpoints and to avoid the risks of activating groupthink mechanisms and of operating only on consolidated procedures and routines (Schippers, Den Hartog, Koopman, & Wienk, Reference Schippers, Den Hartog, Koopman and Wienk2003; Ellis & Davidi, Reference Ellis and Davidi2005; Gartmeier, Bauer, Gruber, & Heid, Reference Gartmeier, Bauer, Gruber and Heid2008). Second, reflexivity influences the quality of interpersonal relations among group members; that is, the adoption of reflexive practices helps teammates increase communication (Gurtner, Tschan, Semmer, & Nagele, Reference Gurtner, Tschan, Semmer and Nagele2007), explore different perspectives and evaluate various options and alternatives, thereby enabling them to better manage minority dissent (Schippers et al., Reference Schippers, Den Hartog, Koopman and Wienk2003; Tjosvold, Tang, & West, Reference Tjosvold, Tang and West2004; De Dreu, Reference De Dreu2007; Hulsheger, Anderson, & Salgado, Reference Hulsheger, Anderson and Salgado2009; MacCurtain et al., Reference MacCurtain, Flood, Ramamoorthy, West and Dawson2010).
Despite the interest shown by scholars, only few studies have focused on reflexivity’s impact on innovation (see Farnese & Livi, Reference Farnese and Liviforthcoming). However, some scholars verified that reflexivity affected the abilities of teammates to use their skills and resources in innovative ways (Tjosvold, Tang, & West, Reference Tjosvold, Tang and West2004) and to generate new products and adopt new technologies and work procedures (Patterson et al., Reference Patterson, West, Shackleton, Dawson, Lawthom, Maitlis, Robinson and Wallace2005; MacCurtain et al., Reference MacCurtain, Flood, Ramamoorthy, West and Dawson2010). As previous research has been non-conclusive in this respect, we aim to verify the influence of reflexivity on innovation by hypothesising the following:
Hypothesis 4: The greater the organisation’s reflexivity, the higher its adoption of innovation.
A gap to fill: The concurrent contribution of reflexivity and flexibility to innovation
The literature summarised above highlights that, although flexibility and reflexivity are strategies that show some overlap and affinity, they are based on different mechanisms. For instance, albeit both of them enhance the organisation capability to cope with unpredictable environments and have an external focus, they apply different processes. Indeed, while flexibility is more exploration oriented and reactive to the environment’s turbulence, reflexivity is a proactive adjustment that tends to preserve organisational identity. Furthermore, even though they are both generative learning processes, flexibility discovers new solutions through a trial-and-error process that includes acting before everything is fully understood, as well as empirically testing the evolving reality (Mintzberg & Waters, Reference Mintzberg and Waters1985; Volberda & Rutges, Reference Volberda and Rutges1999); in contrast, reflexivity mainly promotes a double-loop learning (Argyris & Schön, Reference Argyris and Schön1996) through the monitoring of experience. Flexibility and reflexivity also differently contribute to the decision process. On the one hand, the speed dimension of flexibility enhances the organisation’s adaptability, sometimes putting the planning processes at risk and allowing access to a variety of options (Volberda, Reference Volberda1997). On the other hand, reflexivity is a post hoc evaluation process that suspends action (the reflection phase) so that the organisation evaluates the situation and generates new knowledge in the long run (e.g., new connections, learning from errors and different options; West, Reference West2002; Ellis & Davidi, Reference Ellis and Davidi2005; Schippers, Den Hartog, & Koopman, Reference Schippers, Den Hartog and Koopman2007). The former promotes, above all, system efficiency and the fast reallocation of resources and procedures; the latter promotes mainly system efficacy and the questioning of goals and strategies but in so doing, it does not guarantee a better performance or the effective implementation of novelties.
In addition, it is worth noting that another difference among these processes concerns their ‘dark side’, as some scholars have highlighted that their implementation could have some disadvantages. For instance, the pursuit of flexibility implies increases in economic and human costs (e.g., the unit cost of production, outcome uncertainty and increased employee stress and resistance to change), so that it cannot be considered a ‘free good’ (Carlsson, Reference Carlsson1989; Das & Elango, Reference Das and Elango1995; Golden & Powell, Reference Golden and Powell2000). Adopting flexible processes may also result in other disadvantages, such as increased mistakes (Moorman & Miner, Reference Moorman and Miner1998), overreaction and excess information (De Leeuw & Volberda, Reference De Leeuw and Volberda1996) or conflict suppression, which reduces the accuracy and complexity of the decision-making process (Englehardt & Simmons, Reference Englehardt and Simmons2002). Excessive flexibility may even result in a lack of organisational focus or even in chaos, rendering the organisational structure random and aimless (Volberda, Reference Volberda1997; Golden & Powell, Reference Golden and Powell2000; Englehardt & Simmons, Reference Englehardt and Simmons2002; Biedenbach & Soderholm, Reference Biedenbach and Soderholm2008).
Adopting reflexive practices might present some disadvantages, as well. For instance, these practices require considerable investments of time and energy, which can affect productivity and organisational efficiency (Schippers et al., Reference Schippers, Den Hartog, Koopman and Wienk2003; De Dreu, Reference De Dreu2007; Gurtner et al., Reference Gurtner, Tschan, Semmer and Nagele2007). In addition, contextual conditions sometimes make reflexivity a self-defeating practice. Unstable and unpredictable environments may make reflection useless or even impossible. For instance, March (Reference March1991) observed that exogenous environmental change makes learning from experience difficult. Gurtner et al. (Reference Gurtner, Tschan, Semmer and Nagele2007) also pointed out that the cognitive factors of inertia and time pressure tend to reduce the use of reflective practices because teams prefer to maintain certain degrees of efficiency, even if it means penalising effectiveness and the quality of their goals. Other studies demonstrated that situational uncertainty or temporal pressure enhances the need for cognitive closure, thereby reducing the ability to cope with change, promoting aversion to change and structuring hierarchies and stability of practices and procedures (Pierro, Mannetti, De Grada, Livi, & Kruglanski, Reference Pierro, Mannetti, De Grada, Livi and Kruglanski2003; Kruglanski, Pierro, Higgins, & Capozza, Reference Kruglanski, Pierro, Higgins and Capozza2007). Excessive reflexivity may even result in stagnancy making any change almost impossible.
Given the aforementioned commonalities between and disadvantages of each of them, it seems important to simultaneously analyse these two dimensions, examining how they interact in the processes leading to innovation. This is particularly relevant when considering that reflexivity and flexibility are two routes available for coping with environmental turbulence and for innovating, and that one strategy may not always be feasible. Specifically, when a strategy is not viable, the other may complement it making innovation still attainable. For instance, in situations of slow responsiveness or when high organisational reliability makes flexibility unviable, reflexivity may complement it, in this way representing a protective factor. In fact, reflexivity may foster the implementation of the organisation’s divergent learning capability, the generation of a variety of options and the reduction of the cognitive inertia that leads to organisational routinisation (Tjosvold, Tang, & West, Reference Tjosvold, Tang and West2004; Wong, Tjosvold, & Su, Reference Wong, Tjosvold and Su2007; MacCurtain et al., Reference MacCurtain, Flood, Ramamoorthy, West and Dawson2010). Conversely, in situations when unexpected events give no time for reflection, or complexity makes anticipation impossible, reflexivity is inconsistent and flexibility may complementarily support organisational innovativeness, representing a driver for strategic repositioning and the quick recovery of balance (Volberda & Rutges, Reference Volberda and Rutges1999; Friedli et al., Reference Fernandez-Perez, Fuentes-Fuentes and Bojica2004; Basadur & Gelade, Reference Basadur and Gelade2006). Within this framework, we aim to investigate whether and how flexibility and reflexivity interact to enhance the innovation process, hypothesising:
Hypothesis 5: Flexibility and reflexivity together exert an interactive effect on openness towards innovation, complementarily supporting one another in promoting openness.
Hypothesis 6: Flexibility and reflexivity together exert an interactive effect on innovation adoption, complementarily supporting each other in promoting its adoption.
Method
Participants and procedures
The sample of participants comprised 357 employees working in different private Italian organisations. To include only firms that could potentially implement processes of flexibility and/or reflexivity, we excluded public organisations, as the public administration’s bureaucracy often inhibits flexibility; while we identified organisations in the commercial sector (i.e., insurance, marketing, pharmaceutical and financial services) as they operate in a dynamic market. Finally, we focused on medium–large organisations, which tend to adopt knowledge management practices more often than do smaller organisations.
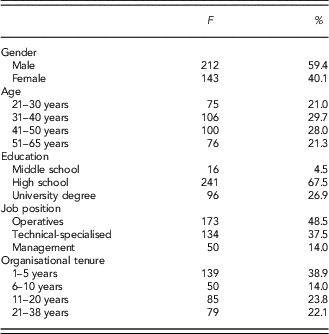
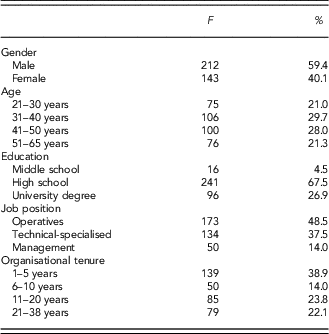
Participants from each organisation were recruited using a convenience sampling method. Data collection were conducted by directly contacting each company’s managers. Questionnaires were administered in the presence of trained researchers (12 graduating students supervised by the authors of this paper) as a part of thesis requirements. Each student contacted 20–40 employees and asked them to complete and return their questionnaire the same day. Of the 450 packages of questionnaires that were distributed, 357 were completed and returned (response rate 79%). The participants completed the questionnaire individually and did not receive any fee for their participation. Individual anonymity was ensured and collective feedback after the survey was offered. Respondents were mainly males (59.4%) representing the whole span of working age (range 19–64 years; mean=40 years, SD=10.6) with relatively high levels of education (67.5% high school, 26.9% college graduates). They held various positions (48.9% operatives, 37.5% technical-specialised, 14.0% management) and, in terms of organisational tenure, ranged 1–38 years (mean=12.2 years, SD=10.2) (see Table 1).
Participants’ sociodemographic characteristics
Measures
The anonymous self-report questionnaire included measures of flexibility, reflexivity and organisational innovation (openness towards innovation and innovation adoption).
Flexibility and reflexivity were measured by items from the Organisational Climate Measure, a multidimensional measure of organisational climate developed by Patterson et al. (Reference Patterson, West, Shackleton, Dawson, Lawthom, Maitlis, Robinson and Wallace2005). Specifically, a 5-item scale assessed flexibility; that is, the organisation’s capability to change and its speed of response (sample items are ‘This company is quick to respond when changes need to be made’; ‘Management here are quick to spot the need to do things differently’). Reflexivity was assessed by a 5-item scale concerning the group’s capability to review and reflect upon its objectives, strategies and work processes to adapt to the wider environment (sample items are ‘The methods used by this unit to get the job done are often discussed’; ‘In this unit, time is taken to review organisational objectives’). For both reflexivity and flexibility, response options followed the scale authors’ format (a 4-point Likert scale, from 1=‘mostly false’ to 4=‘definitely true’).
Organisational innovation
To capture the different facets of the innovation process, two different indicators were considered. One was related to the employees attitude towards innovation (openness to innovation) and the other measured the perceived actual implementation (innovation adoption). Openness towards innovation was assessed with a 7-item scale developed by Avallone and Paplomatas (Reference Avallone and Paplomatas2005), which measured the willingness to introduce innovations across the whole organisational system (‘This organisation is careful to …acquire new technologies’; ‘…to confront with other organisations’ experiences’; ‘…to embrace customers/users demands’; ‘…to enlarge its own competences with new ones’; ‘…to develop innovative skills in employees’: ‘…to establish collaborative relationships with other organisations’; ‘…to test new work methods’). Innovation adoption was assessed by a scale measuring the organisation’s perceived capability to implement novelties in its outcomes. A 3-item scale was used and adapted from Avlonitis, Kouremenos, & Tzokaz (Reference Avlonitis, Kouremenos and Tzokas1994) referring to the frequency with which an organisation has generated new outcomes recently introduced to the market (‘Over the last three years …we placed new products on the market’; ‘…we proposed new services for our customers’; ‘…we made changes in the design or packaging of our products’). For both scales, following authors’ recommendations, response options were rated on a 4-point Likert scale that ranged from 1=‘never’ to 4=‘often’.
Data analysis
As preliminary analysis, confirmatory factor analysis was first conducted on each scale. Afterwards, we examined the psychometric properties of the scales and correlations among all the study variables. A series of multiple hierarchical linear regression analyses were conducted to examine both the main effects of flexibility and reflexivity on openness towards innovation (respectively, Hypotheses 1 and 3) and on innovation adoption (respectively, Hypotheses 2 and 4), and their interaction effects on both of the innovation outcomes (Hypotheses 5 and 6). Job position, organisational tenure and gender were considered control variables in all the regressions. We considered these variables because the literature suggested that employees holding higher positions feel more capable of influencing the organisational climate towards innovation and the decisions that produce innovativeness (Kwasnieswka & Necka, Reference Kwasnieswka and Necka2004; Damanpour & Schneider, Reference Damanpour and Schneider2006); these individuals’ perceptions of innovation performance are also more consistent with the objective perception (Wall et al., Reference Wall, Michie, Patterson, Wood, Sheehan, Clegg and West2004; Martinez-Sanchez et al., Reference Martinez-Sanchez, Vela-Jimenez, Perez-Perez and de-Luis-Carnicer2008). Employees new to their jobs (i.e., low-tenure employees) are more receptive to innovation, whereas those more socialised tend to accept their organisation as it is and to inhibit the adoption of innovation (Damanpour & Schneider, Reference Damanpour and Schneider2006). Finally, females tend to perceive the organisation’s innovativeness less favourably than do males (Kwasnieswka & Necka, Reference Kwasnieswka and Necka2004).
Before the regressions were performed, scores for the two predictors (reflexivity and flexibility) were centred by subtracting the mean score for each variable from each score of the same variable. A multiplicative term was also created to examine the interaction effect (Aiken & West, Reference Aiken and West1991). In these regressions, independent variables were introduced into the equation in three subsequent steps: control variables in the first step, the centred main predictor variables in the second step and the interaction term (reflexivity×flexibility) in the third step. Change in R 2 would support the interaction hypotheses.
For better interpretations of the significant interactions, post hoc simple slopes analysis and graphical representation were examined. Specifically, simple slope analysis allows ‘separate group slopes (simple slopes for groups)’ (Cohen, Cohen, West, & Aiken, Reference Cohen, Cohen, West and Aiken2003, p. 381) to be obtained, thus allowing us to test ‘whether a particular variable is or is not a significant predictor of Y in each and every group’ (Cohen et al., Reference Cohen, Cohen, West and Aiken2003, p. 380). Finally, separate lines of regression were generated from this analysis.
Results
Descriptive statistics
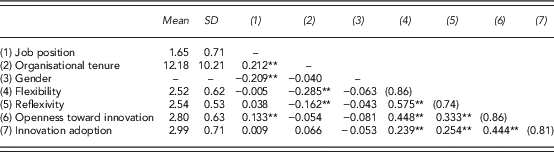
Table 2 presents means, standard deviations, Cronbach’s α coefficients and correlations for all the variables used in this study. The analysis showed that all the study variables had high internal consistency. Moreover, results showed that reflexivity and flexibility correlated with one another, and both correlated with openness towards innovation and innovation adoption. Finally, job position positively correlated with openness towards innovation, whereas organisational tenure negatively correlated with both flexibility and reflexivity.
Descriptive statistics and correlations
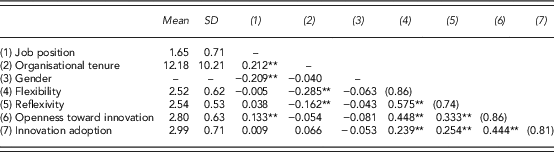
Note. *p<.05, **p<.01. Cronbach’s αs appear on the diagonal.
Regression analysis
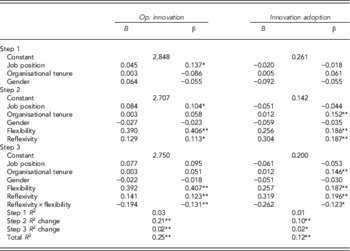
The results of the hierarchical multiple regressions are reported in Table 3. As hypothesised, flexibility, reflexivity and their interaction significantly affected both the innovation outcomes, beyond the effects of the control variables. Specifically, organisations with higher levels of flexibility had higher levels of openness towards innovation (Hypothesis 1) and of innovation adoption (Hypothesis 2). Similarly, organisations with higher levels of reflexivity had higher levels of innovation outcomes (Hypotheses 3 and 4). The results also showed a significant negative interactive effect of reflexivity and flexibility on innovation outcomes, as shown by a significant change in R 2 between steps 2 and 3.
Results of multiple hierarchical regression

Note. **p<.01, *p<.05
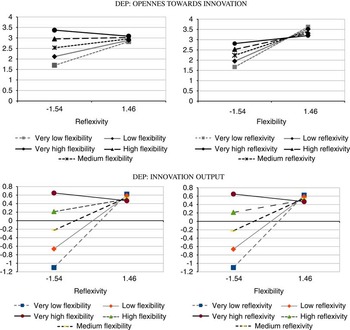
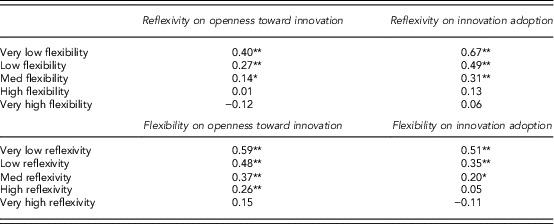
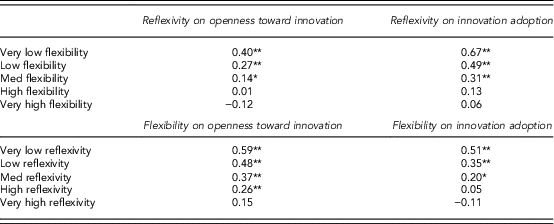
Table 4 and Figure 1 summarise the results of the post hoc simple slopes analysis, which was conducted to investigate the interactive effect of reflexivity with flexibility on the two innovation outcomes considered (openness towards innovation and innovation adoption). As predicted, results showed that both reflexivity and flexibility have a complementary effect on each other. Specifically, reflexivity had a greater impact on innovation when flexibility was low, becoming weaker in conditions of medium flexibility and insignificant in highly flexible contexts. Vice versa, flexibility exerted a higher impact on innovation when reflexivity was low, but had a weaker or non-existent effect in conditions of high reflexivity.
Reflexivity and flexibility interaction: Graphical representation of the simple slope results

Simple slope analysis
Note. **p<.01, *p<.05
Results of the third step of the regression showed that none of the control variables influenced the innovation outcomes, with the only exception being organisational tenure, which influenced innovation adoption. However, this effect necessitates further consideration, as the zero-order correlation between this variable and innovation adoption is non-significant (see Table 2). Therefore, this significant β coefficient (β=0.15, p<.001) may be at least partially attributed to the statistical suppression phenomenon (see Cohen et al., Reference Cohen, Cohen, West and Aiken2003).
Discussion
The general aim of the present study was to explore how the flexibility and reflexivity processes complementarily interact to enhance organisational innovation. We distinguished between orientation towards innovation and actual adoption in an attempt to capture how the two factors influence different steps of the innovation process (Damanpour & Schneider, Reference Damanpour and Schneider2006). In accordance with previous literature, both flexibility and reflexivity showed to be levers to foster innovation, enhancing both the willingness to accept innovations and the actual adoption of innovative outputs. Therefore, both factors confirm to represent strategic assets, outlining two possible routes to innovation, the former bypassing the traditional approach (Biedenbach & Soderholm, Reference Biedenbach and Soderholm2008) and the latter avoiding the routinisation of planning and decisional procedures (Gurtner et al., Reference Gurtner, Tschan, Semmer and Nagele2007).
Despite studies that corroborated their pivotal role, none of them, to the best of our knowledge, have analysed how these factors complement one another to promote innovation. A relevant finding of our research is that these two processes not only have an additive role in fostering innovation, but they also interact. Specifically, both flexibility and reflexivity exert compensatory and protective effects on the other: when flexibility is low, reflexive practices still allow the organisation to gain innovation and vice versa. This means that when one strategy is unfeasible or not worthwhile, the other complements it, allowing the organisation to pursue the innovation in a different way. For instance, the organisation’s investments in flexible processes may sometimes represent a choice that balances an unviable use of reflexive practices, thereby allowing the organisation to respond quickly to challenges and to pursue innovation. Furthermore, our results showed that when both factors are high, there is no interaction. Hence, when both flexibility and reflexivity are high, the level of innovativeness neither rises further nor decreases. This last result evokes the organisational capability to manage the paradox between stability and change, balancing the two factors and adopting from time to time the most fruitful one. For instance, the lack of effect of reflexivity on innovation when flexibility is high seems to imply that, if the organisation already tends to be flexible, this could constitute a sufficient condition to enhance its innovativeness (Thurston & Runco, Reference Thurston and Runco1999; Georgsdottir & Getz, Reference Georgsdottir and Getz2004). At the same time, when flexibility is high, reflexivity is less powerful in promoting innovativeness because of its costs, or is even detrimental to organisational performance, as the implementation of reflexive practices requires considerable investments in time and energy (i.e., employees’ involvement or low psychological safety; Patterson, Warr, & West, Reference Patterson, Warr and West2004; De Dreu, Reference De Dreu2007; Gurtner et al., Reference Gurtner, Tschan, Semmer and Nagele2007).
Conversely, reflexivity becomes a relevant protective factor in promoting innovation when the structure is not very flexible. This indicates that low-flexibility organisations – such as those culturally slow to react, resistant to changing routines or operating in bureaucratic sectors or slack markets, or those that cannot be very flexible, such as high reliability organisations – may find in reflexivity a generative learning process that encourages changes and innovation, thereby supporting the organisation’s orientation towards innovation and its ability to adopt innovations effectively.
Theoretical implications
This work sheds some additional light on the innovation process, adding a first piece of data to some theoretical issues. First, the interactive effect for innovation that emerged in low-flexibility conditions seems to support Moorman and Miner (Reference Moorman and Miner1998); that is, what is important for promoting innovation through organisational flexibility (in their study, improvisation) is not so much the amount of knowledge stored, but how it is used and developed. Reflexivity, in this sense, is a dynamic resource helping to preserve awareness, to question habits and routines, to generate several options and to reactivate the coping mechanisms necessary to respond to environmental challenges; in so doing, it may assist the organisation in developing its innovative ability and limiting the possible criticalities of flexibility. Then, it expresses a generative learning orientation that will lead to explorative innovation strategies (Morgan & Berthon, Reference Morgan and Berthon2008). Overall, more successful organisations tend to be those contingently capable of choosing the better balance between the two leverages for innovativeness, valuing inner resources and characteristics, given the environmental conditions within which they are operating (Eisenhartd & Martin, Reference Eisenhardt and Martin2000).
A further key theoretical implication of this paper relates to the strategic issue of balancing exploration and exploitation investments (March, Reference March1991; Zollo & Winter, Reference Zollo and Winter2002). The literature maintains that flexibility constitutes a strategic resource for organisations to better adapt to changes – especially radical or unpredictable ones – preserving the unstable balance between control and change (De Leeuw & Volberda, Reference De Leeuw and Volberda1996; Koornhof, Reference Koornhof2001; Biedenbach & Soderholm, Reference Biedenbach and Soderholm2008). However, it needs to be strongly anchored to the organisation’s vision to avoid the risk of chaos (Volberda, Reference Volberda1996, Reference Volberda1997). According to the present results, reflexivity can constitute a resource for innovation in those conditions, supporting the management to monitor and verify the coherence of flexible choices with the organisation’s goals and vision (Schippers et al., Reference Schippers, Den Hartog, Koopman and van Knippenberg2008). It may exert a positive influence on organisational innovation, supporting the process of reviewing routines and habits but at the same time preserving the strategic focus. As flexibility and speed in change might produce unwanted costs and a lack of organisational focus (Volberda, Reference Volberda1996; Englehardt & Simmons, Reference Englehardt and Simmons2002), reflexivity may then represent a learning condition that mitigates flexibility disadvantages, constituting a protective factor. Therefore, reflexive practices may be considered a learning-dynamic resource that helps flexibility achieve a balance between change and control.
Some scholars (Farjoun, Reference Farjoun2010; Sutherland & Smith, Reference Sutherland and Smith2011) suggest that the dualism paradox is not so contradictory if conceived as the need to work towards interdependent mutuality. In line with their assumptions, our results gave evidence of a complementary relation between flexibility and reflexivity, therefore furnishing some information about the so-called ‘flexibility paradox of change (vs.) preservation’ issue (Volberda, Reference Volberda1996, p. 360; Biedenbach & Soderholm, Reference Biedenbach and Soderholm2008). The conflicting capabilities of flexibility and controllability, which are to be managed simultaneously in unpredictable environments, may be better balanced with the help of reflexivity, which, when organisational ability to be flexible is inhibited, may enhance innovation, helping to make change coherent with organisational goals, evaluating options and opportunities and reducing the risk of making the organisation random, aimless and acephalous.
Practical implications
Given the consistent interactions between flexibility and reflexive processes, we argue that systematic efforts to differentiate the strategies enhancing both factors is especially important to companies that want to introduce processes of innovation. In this regard, our results indicate that focusing on only one factor could be detrimental when their implementation turns out ineffective or unproductive. Instead, the presence of a double strategy, simultaneously investing in different modes of innovation development, allows organisations to balance the costs of each, appraising one when the other is weak.
For instance, to promote innovation when flexibility is low, management may concretely support its weakness with a group-level intervention through reflexive knowledge management practices. They may choose, among different knowledge management practices, those that foster generative and divergent learning, as reflexivity does, and invest in human capital, thereby promoting learning and unlearning processes (Teece, Reference Teece2007). In this case, reflexivity helps to overcome the organisational system’s rigidity, expressing a managerial choice towards the importance of discussing assumptions and habits, and helping to realign team members’ involvement and commitments to change. In any case, the organisation may pursue innovation by enhancing its reflexive ability, even when there are not enough conditions to invest in flexibility, for instance, because it is too expensive or when the system inertia is overwhelming (Philips & Tuladhar, Reference Philips and Tuladhar2000). In addition, when work failures reduce the organisation’s resilience capabilities, flexibility is not a viable option. For instance, a high reliability organisation (Roberts, Reference Roberts1990), which is characterised by complex works and uncertain environments, needs a great variety of procedural options and strong formalisation that contains the risks of errors. In these contexts, flexibility alone (e.g., too rapid a change of procedures in a situation of low predictability of future scenarios) may be a dangerous choice.
Limitations and future research directions
This research has some limitations. For instance, our results showed that flexibility had a stronger impact on openness towards innovation than on the adoption of innovation. One explanation may lie in the operationalisation of the flexibility construct, which includes the willingness to adopt new ideas or innovative approaches quickly. Therefore, the possible overlap of flexibility with openness towards innovation may be larger than with the behavioural indicator of effective innovation implementation. This paper is a first attempt to better understand the interactive effect of these factors on innovation. However, firmer conclusions could be reached by replicating this study using different measures for flexibility, or even by testing these relationships with reference to different forms of flexibility (Golden & Powell, Reference Golden and Powell2000).
Furthermore, we asked for innovation perception and did not have any objective measures. We also did not use a sampling criterion connected to participants’ knowledge about effective innovation in their contexts; this should be considered more carefully in future studies. In any case, our results supported other research confirming the influence of flexibility or reflexivity on effective innovation adoption (Patterson et al., Reference Patterson, West, Shackleton, Dawson, Lawthom, Maitlis, Robinson and Wallace2005; MacCurtain et al., Reference MacCurtain, Flood, Ramamoorthy, West and Dawson2010). Future research could also take into account different outcomes (e.g., performance [vs.] innovation; Verdu & Gomez-Gras, Reference Verdu, Lorens-Montes and Garcia-Morales2009). Moreover, the literature asserts that flexibility and reflexivity have different times of action, the former being quick and pursuing an immediate effect, the latter being slower and having an impact over the medium term. The measure of innovation adoption we used was a ‘retrospective’ one, but future research should longitudinally explore the impact of flexible and reflexive processes on the concrete innovation adoption in the short and long term, focusing on specific causal relations.
Overall, because this is the first study analysing the interaction between flexibility and reflexivity, we hope that more research will further explore the interaction effects that emerged here, if they are to be generalised. For instance, the work may be replicated in different organisational contexts, as it is plausible that the flexibility and reflexivity processes assume different prominence and criticalities in organisations operating in different branches of activity or in companies at different stages in their lifecycles (Volberda, Reference Volberda1997) or in different contextual conditions (e.g., dynamic [vs.] competitive environments; Jansen, Van Den Bosh, & Volberda, Reference Jansen, Van Den Bosh and Volberda2006). Thus, further studies should be done to verify the protective role they play for one another in different work contexts to capture the presence of any latent factor left behind.