INTRODUCTION
The transmission of disease between wildlife, livestock and humans has important repercussions for conservation, farming and human health (Cleaveland et al. 2001). The majority of important disease agents are microparasites (bacteria, protozoa, viruses), many of which are transmitted between suitable hosts by arthropod vectors. In their investigation of vector-borne microparasite models, Dye and Williams (1995) concluded that the vector stage could often be omitted without significant loss of predictive power, especially in models of infections transmitted by diptera. In contrast, studies of tick-borne parasites, with their much longer vector stage, have supported the necessity of an explicit consideration of tick dynamics (Hudson et al. 1995; Laurenson et al. 2003). Fleas (Siphonaptera) lie between these two extremes. Microparasite transmission typically involves only the adult stage, which feeds repeatedly (as in diptera), but at least in many wildlife (e.g. rodent) systems, vector mortality may not be much faster than host mortality. Moreover, some flea species may survive inhospitable seasons by entering diapause as fed adults (Krasnov et al. 2002a), potentially slowing down the vector component of the parasite life-cycle in an analogous way to inter-stadial transmission by ticks.
Few empirical studies of flea-borne microparasites have investigated whether host or vector dynamics are most influential (but see Smith et al. 2005). Moreover, as with other vectors, many flea species are not host-specific. Flea and microparasite dynamics may, therefore, depend on the dynamics of several host species. Here we investigate Bartonella spp. infections in cyclic populations of field voles (Microtus agrestis), in the United Kingdom. Bartonellae parasitize erythrocytes in a wide range of mammalian species and several have been associated with human or animal disease (Anderson and Neuman, 1997; Breitschwerdt and Kordick, 2000). Although transmission mechanisms are not fully understood, arthropod vectors are important (Breitschwerdt and Kordick, 2000) and experimental studies have demonstrated that fleas can transmit Bartonella spp. between rodents in Britain and Europe (Bown et al. 2004; Krampitz, 1962).
Studies of Bartonella diversity demonstrate the existence of distinct phylogenetic groups or species (Kosoy et al. 1997; Birtles et al. 2001). Field and laboratory studies have suggested that some host-specificity occurs among Bartonella spp. (Kosoy et al. 1997, 2000), but there is also evidence that single species of Bartonella frequently infect more than 1 host species at a given site (Birtles et al. 2001). Moreover, different Bartonella species can coexist within individual hosts, host species and geographical sites (Birtles et al. 2001; Kosoy et al. 1997, 2004b). Due to this diversity, Bartonella are an excellent model system to investigate whether taxonomically and ecologically related species show similar responses to host and vector dynamics and our study is the first to address this issue in Bartonella.
The study aimed to investigate (1) the effect of host density on flea dynamics; (2) the relative importance of vector and host dynamics in determining the dynamics of different Bartonella spp.; (3) the importance of alternative hosts for flea and Bartonella dynamics; (4) whether any relationships between host, vector and microparasite show a temporal lag; and (5) whether any of the observed relationships reflect changes in host population structure (age, sex).
MATERIALS AND METHODS
Study site and trapping protocol
The study was carried out in 27 grass dominated clearcut sites (5–12 ha) within 3 adjacent man-made spruce forests. There were 12 sites located in Kielder Forest (55 °13′N, 2 °33′W), 10 sites within Kershope Forest (55 °06′N, 2 °45′W) and 5 sites within Redesdale Forest (55 °17′N, 2 °21′W) (Fig. 1). The 3 forests are largely separated by moorland. Field vole dynamics within a forest tend to be more synchronized than between forests (Mackinnon et al. 2001). The minimum and maximum inter-site distances were 0·4 km and 36·9 km respectively. Within each clearcut, small mammals were sampled using the small quadrat design (Myllymaki et al. 1971): a 15 m by 15 m trapping square was established in good quality field vole habitat and three Ugglan Special multiple-capture traps (Grahnab, Marieholme, Sweden) were set at each corner. Traps were set bi-annually in March (spring) and September (autumn) from autumn 2001 to autumn 2004. Due to successional processes, habitat suitability for field voles declined in 2 clearcuts and for the autumn 2004 survey these were replaced with alternative clearcuts located close by (<500 m). For all analyses these alternative clearcuts were treated as if they were the original clearcuts. Traps were pre-baited with grain and carrot for 2–3 days and then set for 3 nights with daily checks. On capture, species, sex, reproductive condition and weight were recorded. Three rodent species were captured: field voles, bank voles (Clethrionomys glareolus) and wood mice (Apodemus sylvaticus). The majority (75%) of captures were of field voles and these are the focus of this study. Females were classified as sexually mature if they had a perforate vagina or enlarged nipples. Males were classified as mature if they had descended testes. From spring 2002 onwards, the combined intensity of infestation for all flea species on each animal was recorded on an ordinal scale with 1=1–2 fleas, 2=3–5 and 3=>5. All captured animals were humanely killed and a blood sample taken by cardiac puncture. Sera were separated from the blood samples by centrifugation. Red cell pellet samples were stored at −80 °C.

Fig. 1. Map of the study area, showing the 3 forests and 27 clearcut sites. The light grey area shows the extent of the forest. The darker grey area is a reservoir.
Identification of Bartonella
A 50 μl aliquot of each red cell pellet sample was plated onto 10% (v/v) sheep blood-enriched Columbia agar. Plates were incubated at 35 °C and 5% CO2 for up to 45 days. Plates were checked daily for bacterial growth, and colonies tentatively identified as bartonellae (small, round, grey-white colonies) were passaged onto clean plates. Contamination prevented infection status being determined for a small number of samples. After 2 week's growth, isolates were harvested into brain heart infusion broth containing 10% glycerol for frozen storage. We observed that all plates without growth at 2 weeks remained sterile, indicating that all Bartonella species present yielded visible colonies within this period. A sweep of colonies from each primary isolation plate was harvested into sterile, distilled water for use as template in a Bartonella genus-specific polymerase chain reaction (PCR) assay (see Telfer et al. 2005 for details). The PCR products derived from different Bartonella species are of different sizes. Electrophoretic resolution of PCR products on 3% (w/v) agarose gels permitted identification of the Bartonella species. Four species of Bartonella were detected in the samples from field voles: B. doshiae, B. taylorii, B. grahamii and a Bartonella genotype incompletely characterized, but believed to be a new species and subsequently referred to as BGA. A fifth species, B. birtlesii, was only isolated from samples from wood mice and is not considered further.
Sensitivity of isolation
To examine the sensitivity of isolation methods, the Bartonella PCR assay was used directly on DNA samples extracted from the original blood samples of 250 individuals. We assumed that a positive result by either method indicated that the individual was infected. There was general agreement between culture and PCR results. However, the discrepancy between the 2 methods appeared to vary between Bartonella species. Of the samples tested by both methods, 5% of B. grahamii infections (n=41), 8% of B. doshiae infections (n=63), 32% of B. taylorii infections (n=96) and 53% of BGA infections (n=17) were only detected by PCR direct on blood. Thus, whilst only a small proportion of B. grahamii and B. doshiae infections were missed by isolation, a far greater proportion of infections by the other 2 species appeared to be missed. In the majority of cases, infections ‘missed’ by culture were part of mixed infections (BGA 78%, n=9; B. taylorii 67%, n=30). This could reflect interactions within the host: for example, in a mixed infection the infection intensity of one species could be suppressed, making it less likely to be detected by our isolation methods. Alternatively, interactions between species within a mixed infection could occur on the culture plate. Under this scenario, our diagnostic tests could contribute to any observed negative interactions between Bartonella species by yielding false negatives for some species. Consequently, failing to take account of the presence of infections by other Bartonella species in statistical analyses may lead to erroneous conclusions. For example, if a site has a high prevalence of B. doshiae, infections by B. taylorii may be missed (as they will mainly occur in mixed infections with B. doshiae) and the estimate of B. taylorii prevalence would be negatively biased. We therefore accounted for our failure to detect some mixed infections in the statistical analyses (see below).
STATISTICAL ANALYSES
We used Generalised Linear Mixed Models (GLMM) with a logit link, binomial errors and fitted using REML to investigate what factors influence the probability that an individual field vole was infested with fleas (using presence or absence of fleas as a binary response variable). Similar analyses were conducted for each of the Bartonella species. The large number of explanatory variables to be considered resulted in many potential models. Moreover, due to the study design, infection prevalences could be spatially correlated. Consequently, we conducted the analyses in several stages (detailed fully below). For the Bartonella analyses the investigation of fixed effects comprised 3 stages: the first investigated population level covariates that were shared by all individuals trapped in a clearcut during a single survey, the second investigated individual level covariates, and the third investigated the impact of fleas on infection probabilities. The flea analysis excluded the third stage. After modelling the fixed effects we examined whether the residual extra-binomial variation in the data exhibited spatial structuring. Care was taken to check the robustness of results with and without random effects. Three nested random effects were included in each analysis: survey, forest within a survey (forest∗survey) and site within a survey (clearcut∗survey). Prior to considering fixed effects, we determined what portion of the total variance each of the random effects explained, and whether each of the variance components was significantly different from zero using z-tests in the SAS GLIMMIX procedure (Littell et al. 1996).
Fixed effects
In addition to the 3 random effects, all models investigating Bartonella infection probabilities included whether or not an individual was infected by each of the other non-response variable Bartonella species (see above). These effects were retained throughout the modelling process. All analyses including fixed effects were conducted using the glmmPQL procedure (Venables and Ripley, 2002) in the R software package available under the GNU license at http://www.r-project.org.
We first investigated whether population level factors, such as host density, influenced infection (Bartonella) or infestation (fleas) probabilities. The flea analysis considered data from spring 2002 onwards. We considered a range of covariates reflecting field vole density with different time-lags and at 2 spatial scales. For local quadrat density, we used the cumulative number of field voles caught on a quadrat during a survey and considered both current (Lag-0) density and density 6 months before (Lag-6). We also considered density at the clearcut scale, using Vole Sign Index (VSI) surveys, a calibrated method based on signs of feeding activity by field voles (Lambin et al. 2000), and we considered clearcut density estimates with a lag of 0, 6 and 12 months. We also included cumulative quadrat-level densities of bank voles and wood mice (Lag-0 and Lag-6). All density estimates were log transformed. The effect of season and interactions between season and all density estimates were also considered. We followed a step down procedure, because a model selection approach (Burnham and Anderson, 1998) is precluded by the absence of a selection criterion such as AIC in GLMMs. We eliminated interactions first, and retained only those variables significant at the 5% significance level. To guard against type 1 errors, at the end of the modelling process we confirmed the validity of including effects by comparing their coefficients and P-values to equivalent models without random effects.
Six-month lagged quadrat density estimates and 12 month lagged clearcut density estimates were not available for the first survey. Consequently models for Bartonella that included any of these variables were only fitted to data from spring 2002 onwards. In addition, 6-month lagged clearcut density estimates were not available for 5 sites in the first survey and data from these sites were therefore excluded from models that included this variable.
Due to the significant correlation between some of the field vole density measures, we took care to check the robustness of step-wise selection of variables. If the final model after the first stage of the analysis included a measure of field vole density, we removed this measure of field vole density and re-examined all other measures of field vole density.
In the second stage of the analysis we examined whether variation in vole population structure explained any of the observed relationships with host density. Starting with the best model from the first stage of the analysis, we investigated the following individual level covariates: sex, weight (log transformed and used as a proxy for age) and maturity. Two-way interactions between sex and weight and sex and maturity were included, as well as interactions between each of the individual covariates and season.
For models of Bartonella infection probabilities, a third stage of analysis was used to directly examine whether flea infestation influenced probabilities of Bartonella infection. We considered the following covariates: (1) whether or not an individual was recorded as having fleas; (2) flea infestation intensity for an individual on the ordinal scale; (3) the proportion of field voles from a site that had fleas (unlagged) and (4) the 6-month lagged proportion of field voles caught at a site that had fleas. This last covariate was only available for survey 3 onwards. The population level covariates were considered appropriate as fleas spend a significant proportion of time off their hosts, and therefore the prevalence of infested animals within a population may reflect the abundance of fleas in the environment more accurately than measures of flea infestation at the individual host level.
These covariates were added to the models that best described Bartonella infection probabilities after the 2 stages described above. In addition, to examine whether any of the relationships identified in the first 2 stages of the analyses simply reflected vector abundance, we considered flea covariates in models without any host effects. These models still included the effect of infection by other Bartonella species.
Spatial structuring in random effects
We investigated whether any remaining extra-binomial variation was spatially structured by calculating empirical variograms for the site∗survey random effects from the best models after the selection process, using package geoR (Ribeiro Jr and Diggle, 2001) in program R. To allow us to fully examine any spatial structure (including large scale patterns), the site∗survey random effects were estimated from models without forest∗survey random effects included, investigating whether, having accounted for both individual and host population effects, infection and infestation probabilities within a survey tended to be similar in adjacent sites. Inter-site distances up to 22 km were considered, as there were relatively few pairs of sites further apart than this and the analysis therefore lacked power.
RESULTS
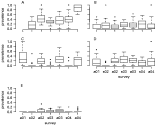
Of the 1533 field voles examined from spring 2002 onwards (Fig. 2), 39% were infested with fleas. Flea infestation rates peaked in autumn 2004 (Fig. 3A). Examination of fleas from a subsample of field voles from the spring 2003 and autumn 2003 surveys indicated that the flea community was dominated by 4 species: Ctenophthalamus nobilis nobilis, Hystrichopsylla talpae talpae, Malaraeus pencilliger mustelae and Peromyscopsylla silvatica spectabilis.

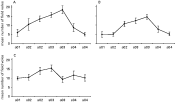
Fig. 2. Mean number of field voles caught at a site in each survey for (A) Redesdale, (B) Kielder and (C) Kershope forests. Bars are standard errors.

Fig. 3. Boxplot of the prevalences of (A) fleas; (B) Bartonella doshiae; (C) B. grahamii, (D) B. taylorii and (E) BGA at the 27 sites in each of the 7 surveys. Middle bar shows the median site prevalence. Note that no flea data are available for autumn 2001 (a01).
Overall Bartonella prevalence was approximately twice as high in autumn as in spring (mean autumn prevalence 57·5% (n=938); mean spring prevalence 34% (n=779)). All Bartonella species were detected in each survey, apart from BGA which was only detected from autumn 2002 onwards. Of 804 individuals that were infected with Bartonella spp., 79 appeared infected by more than 1 species. All possible mixed infections containing 2 species were observed at least once. Of the 886 isolates, 264 were B. doshiae, 248 B. grahamii, 324 B. taylorii, and 50 BGA. This corresponds to overall prevalences of 15%, 14%, 19% and 3% for B. doshiae, B. grahamii, B. taylorii and BGA respectively (n=1717). All Bartonella species were widespread. B. grahamii, B. doshiae and B. taylorii were found at least once in all sites, whilst the relatively rare BGA was found in all but 3 sites.
Generalised Linear Mixed Modelling
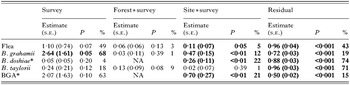
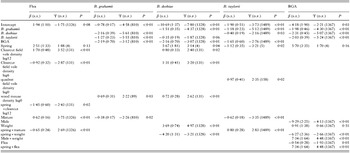
Table 1 shows the estimated covariance parameters before the inclusion of any fixed effects. Parameter estimates and standard errors for fixed effects are given in Table 2 for each of the final models. For discussions of the different stages of the selection process we therefore only present the results for significance tests in the text.
Table 1. Estimated covariance parameters before the inclusion of any fixed effects, showing standard errors, the probability that each of the variance components was significantly different from zero using z-tests (see text) and the percentage of variance explained (Estimates in bold had significant z tests. For the Bartonella species marked with ‘∗’ there were problems estimating all random effects simultaneously. In these cases the forest∗survey random effect was excluded.)

Table 2. Table of coefficients from the best models after the two stage analysis (fleas) and three stage analyses (Bartonella spp.) (The model for B. grahamii is for the autumn surveys only. Standard errors and the significance of the coefficients are also shown.)

Host-vector interactions
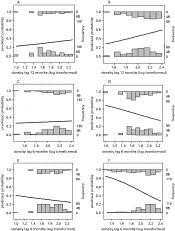
The best flea model after the first stage of the analysis included an interaction between season and Lag-12 clearcut field vole density (t=−2·45, D.F.=131, P=0·02): autumn flea infestation rates increased with past vole density, but there was no such relationship in the spring. There was also an additive negative effect of Lag-6 clearcut field vole density (t=−3·00, D.F.=131, P<0·01): an individual was less likely to be infested with fleas if field vole densities were high 6 months before. This negative relationship was robust to the removal of the effect of Lag-12 density, and also to the removal of random effects, and it did not reflect a simple seasonal relationship since season was also included in the model, and it was apparent too if Lag-6 clearcut density was replaced by current clearcut or quadrat density. Thus, Fig. 4 shows the results from univariate generalised linear models fitted to the data split by season, showing no relationships in spring (Fig. 4A,C,E), but the positive relationship between the Lag-12 density and autumn infestation probability (Fig. 4B) and the negative relationships between autumn infestation probabilities and Lag-6 and Lag-0 density (Fig. 4D,F).

Fig. 4. Results of logistic regressions for flea infestation probabilities with the following clearcut field vole density estimates as explanatory variables: 12-month lag (A, B); 6 month lag (C, D) and 0 lag (E, F). Data were split by season, with A, C and E showing relationships in spring and B, D and F showing relationships in autumn. The graphs show the raw data by incorporating frequency histograms for individuals not infested with fleas (bottom histograms) and individuals infested with fleas (top histograms).
When individual level covariates were added to the flea model, the relationships between infestation probabilities and host density remained (Table 2). In addition there was an interaction between season and maturity. In autumn, mature animals were more likely to be infested than immature animals.
Host-microparasite interactions
For B. grahamii, when the entire dataset was analysed, infection patterns were dominated by the strong seasonal pattern (t=−9·51, D.F.=5, P<0·001). However, as only 11 out of 244 positive animals were found during spring surveys, we re-analysed the data using only autumn surveys. The probability that a field vole was infected increased with the current quadrat scale density of wood mice (t=2·16, D.F.=89, P=0·03), an effect that remained significant when individual covariates were examined. There was also an additive effect of maturity, with mature animals less likely to be infected than immature animals (t=−2·26, D.F.=810, P=0·02).
There was evidence of delayed dependence for B. doshiae, with an individual's probability of infection being positively related to clearcut field vole density at Lag-6 (t=4·04, D.F.=131, P<0·001) and Lag-12 (t=2·87, D.F.=131, P=0·005). In addition, the probability of infection increased with the number of wood mice caught at a site (t=2·89, D.F.=131, P=0·005). These covariates remained significant when individual level covariates were added. There was also an interaction between weight and season (t=−3·21, D.F.=1328, P=0·001): in autumn, older animals were more likely to be infected, but in spring no such relationship existed.
The probability of infection with B. taylorii increased with current field vole density at both the quadrat and the clearcut scale (current quadrat density: t=2·00, D.F.=157, P=0·047; current clearcut density: t=2·11, D.F.=158, P=0·037). When individual covariates were added, the density effect at the clearcut scale dropped out of the model, and there was a significant interaction between season and maturity (t=−2·83, D.F.=1489, P=0·005): immature animals were more likely to be infected in autumn but there was little difference in spring.
For BGA, there was a significant interaction between season and the Lag-6 clearcut density of field voles (t=2·03, D.F.=152, P=0·04): field voles were less likely to be infected in spring, but spring infection probabilities increased at sites with high densities of field voles in the preceding autumn. When individual covariates were added, the interaction only approached significance (t=1·90, D.F.=152, P=0·06), although coefficients remained similar. There were also interactions between season and weight (t=−2·61, D.F.=1451, P=0·009) and between sex and weight (t=4·70, D.F.=1451, P<0·001): in autumn, the probability of infection increased with weight for males but not females.
Vector-microparasite interactions
When population and individual measures of flea infestation rates were considered, only BGA showed any relationship. The presence of fleas had a positive effect on infection probabilities in spring. This did not alter the coefficient values or significance of population or individual level covariates. When models without any host covariates were considered, no further relationships between Bartonella infection probabilities and flea infestation covariates were found, indicating that the relationships between hosts and microparasites did not simply reflect relationships between host and vector.
Interactions between Bartonella species
For each of the Bartonella species, we used the best model after the third stage of the analysis to examine potential interactions between pairs of Bartonella species. All coefficients describing such interactions were negative and the majority were significant, though the interaction between B. doshiae and B. taylorii only approached significance. Of the 12 pairwise interactions, 8 had coefficients <−1·5 (odds ratio <0·22).
Spatial structuring in random effects
There was no evidence for fleas, or any of the Bartonella species, that the residual extra-binomial variation in the data was spatially structured. The distribution of sites allowed us to look for spatial structure at scales of approximately 3 km and above.
Models without random effects
Results proved robust when random effects were removed. Coefficients for the best model in each analysis remained similar and, as expected from the non-independence of observations, in the vast majority of cases P-values were reduced, highlighting that the analyses presented above are conservative. In the model for B. grahamii, coefficients remained similar although the P-value for the effect of maturity was P=0·09. A further exception, as expected from the sparse nature of the data and demanding caution in interpretation, was the analysis for BGA. Without random effects there was no evidence of an interaction between season and weight (t=−1·26, D.F.=1532, P=0·21).
DISCUSSION
In spite of its correlative nature, this study of host-vector-microparasite dynamics in cyclic field vole populations yields important insights into such systems, and generates hypotheses that can be tested with longitudinal and experimental studies. First, patterns of infection in 4 closely related microparasite species generally exhibit stronger correlations with host dynamics than vector dynamics: empirical support for the assertion that microparasites transmitted by fleas may often be modelled effectively as directly transmitted parasites. In this respect, the flea-borne Bartonella are more akin to diptera-borne than tick-borne microparasites (Dye and Williams, 1995). Secondly, owing to our ability to distinguish between 4 species of Bartonella, we demonstrate, for the first time, that these closely related species exhibit markedly different dynamics, with the lag structure of density-dependence and the effect of alternative hosts varying between species. This highlights the need to account for parasite biodiversity in host-parasite studies. Lastly, the results emphasize the importance of factors such as seasonality and host population age structure in determining microparasite prevalence in reservoir hosts.
Host-vector interactions
In autumn, field voles from clearcuts with high field vole densities in the preceding autumn were more likely to be infested with fleas (delayed density dependence with a lag of 1 year). This lag is perhaps surprising, given that at least some species of flea can develop from egg to imago in approximately 40 days (Rust and Dryden, 1997; Krasnov et al. 2002b), but wild populations of several species of flea show pronounced seasonal dynamics (Marshall, 1981; Lindsay and Galloway, 1997), with fleas entering diapause to survive unsuitable periods. Therefore an effect of host density on flea reproduction in the current year but on adult flea abundance in the next year is biologically plausible.
Field voles were also less likely, especially in the autumn, to be infested if the population was currently, or had in the recent past been, at high density. This suggests that at high host densities the flea population is divided between more potential hosts and consequently individual hosts are less likely to be infested – a type of dilution effect. Krasnov et al. (2002c) in their study of the flea, Xenopsylla dipodilli, infesting the desert rodent Gerbillus dasyurus, also found such a negative relationship at high, but not at low host densities. Krasnov et al. (2002c) speculated that the declining part of their unimodal relationship occurs because, at high rodent densities, there are more transient individuals that lack access to burrows and are therefore less likely to be infested. A similar explanation may hold here, where the relationship occurs primarily in autumn and is driven by younger individuals, less likely to be occupying established home ranges. Indeed, there is strong evidence that in autumn mature animals are more likely to be infested than immature animals. Taken together these results may suggest age-specific exposure risks, which are greatest in resident, reproductive animals. Alternatively, the relationship may reflect fleas preferentially parasitizing older animals that provide a better nutritional resource, since there is evidence that fleas maximize their fitness by actively selecting hosts (Krasnov et al. 2003; Krasnov et al. 2004; Hawlena, 2005).
The observed patterns need to be interpreted with some caution due to the inability to distinguish between different flea species. Data collected from the spring and autumn surveys in 2003 suggest the different species may show different seasonal dynamics. In spring the flea community was dominated by C. nobilis, with at least 1 individual collected from 71% of infested animals (n=176). In contrast, the autumn flea community was more diverse with 40%, 24% and 2% of infested animals being parasitized by P. spectabilis, H. talpae and C. nobilis respectively (n=132). The seasonal differences in the relationships between host density and infestation probability may reflect differences between flea species, and future data collection aims to investigate differences in population dynamics between flea species.
Host-vector-microparasite interactions
The transmission of microparasites by arthropods is expected to depend on both the abundance of suitable vectors and the frequency of vector exchange between hosts. Overall, Bartonella population dynamics appear to be more strongly influenced by host density than flea abundance, with 3 species (B. grahamii, B. doshiae and B. taylorii) influenced by host density, but only 1 (BGA) apparently influenced by the presence of fleas. In contrast, in our previous study of another blood parasite, Trypanosoma microti, in the same area (Smith et al. 2005), dynamics were more related to flea dynamics than host dynamics, with infection probability positively related to flea prevalence with a lag of between 1 and 3 months.
There are 3 potential explanations for the general lack of an effect of flea prevalence on Bartonella dynamics and the differences observed between Bartonella species and between the Bartonella species and T. microti. First, it is possible that not all the Bartonella species are transmitted by fleas. There is anecdotal evidence for a role for ticks in the transmission of some bartonellae (Pappalardo et al. 1997; Chang et al. 2001), and some Bartonella species may be transmitted vertically between mother and offspring (Kosoy et al. 1998). However, there is experimental evidence that one of the flea species found in the present study (C. nobilis) can successfully transmit B. grahamii and B. taylorii (Bown et al. 2004), neither of which showed any relationship between infection probability and flea abundance. We do not believe, therefore, that fleas are not important vectors, although if flea species vary in their competence, combining species may reduce the sensitivity of the analysis. Early studies of Bartonella found no evidence of vector specificity, with a tropical rat flea successfully transmitting German strains between hosts (Krampitz, 1962). Future work aims to investigate whether there is any vector specificity within this system. Secondly, we may have been unable to record flea prevalence at the appropriate lag. However, flea prevalences in adjacent months at the same site are highly correlated (Smith et al. 2005) and an effect of either current or past (Lag-6) flea prevalence would therefore be expected if intervening flea prevalence was important.
Lastly, the differences may reflect biological differences between the systems. One factor identified by Dye and Williams (1995) as crucial in determining the importance of explicitly including a vector component in predictive dynamic models was the proportion of vectors that become infected. This depends on both the microparasite prevalence and the efficiency with which vectors become infected. The prevalence of Bartonella species within field voles (typically <30% in autumn) appears generally to be lower than that of T. microti ([ges ]60% in autumn: (Smith et al. 2005)), potentially contributing to the relative importance of flea dynamics for T. microti dynamics. The efficiency with which vectors feeding on infected hosts become infected is not known for these microparasite species. Also, experimental infections of mice suggest that some Trypanosoma spp. induce a degree of acquired immunity following infection (Albright and Albright, 1991; Sato et al. 2004), but there is little evidence of wild rodent hosts acquiring immunity to Bartonella spp. (Kosoy et al. 1997) (but see below). With no immunity, exchange of fleas between hosts may be more important than flea abundance because a greater proportion of flea exchanges result in transmission. Consequently, if the rate of flea exchange between hosts increases with host contact rate which increases with host density, then the dynamics of such microparasites may be more influenced by host density (i.e. transmission is host-density dependent, Begon et al. 2002).
Thus, it appears that the importance of flea dynamics for the dynamics of flea-borne microparasites varies between microparasites and that even closely related microparasite species may show different patterns. In contrast, incorporating tick dynamics into predictive dynamic models is typically crucial for tick-borne microparasites (Randolph, 1998; Randolph et al. 2002). This difference may reflect differences in the relative length of the vector and host components of the microparasite life-cycle, as all tick-borne microparasites must persist inter-stadially.
Differences between Bartonella spp.
The analyses of Bartonella infection rates appear to indicate 2 distinct types of infection pattern. For B. grahamii and B. taylorii in autumn, immature animals were most likely to be infected. Infection probabilities in both of these species increased with increasing current host density: B. grahamii with wood mouse density and B. taylorii with field vole density. In contrast, infections by B. doshiae and BGA were more common in autumn in older individuals. Both of the species showed some evidence of a relationship between infection probability and lagged field vole density, although for BGA this was only true for autumn.
The contrast may reflect differences in characteristics of the host-parasite relationship. Evidence from the laboratory indicates that the length of infection may differ between Bartonella species (R. Birtles & S. Telfer, unpublished data). Of 12 field voles captured at Kielder whilst infected with B. doshiae and taken into the laboratory, 44% (n=12) were still infected after 10 weeks. This compares with <12% for animals infected with B. grahamii (n=9) and B. taylorii (n=24). Only 1 animal infected with BGA was brought in, and it was still infected 17 weeks after capture. Thus, it seems possible that for species characterized by long infections, exposure risk could accumulate with age (higher prevalence in older animals), and any relationship with host density would show a lag, reflecting host density at the time of initial infection for the majority of individuals. In contrast, as B. grahamii and B. taylorii have shorter infections, typically <2months, most infected individuals will have been infected recently, potentially explaining the relationship with current host density demonstrated in these species.
The lower rates of infection in older animals for these 2 species may be indicative of acquired immunity (Hudson and Dobson, 1995). Alternative explanations include a reduction in exposure and mortality of infected individuals (Hudson and Dobson, 1995). However, in the present study flea infestation (and hence probably exposure) was more common in older animals, and Bartonella infections are not thought to impact on host survival (Chomel et al. 2003). There are conflicting results on whether rodents develop an acquired immunity following Bartonella infection, with antibody development in experimentally infected mice but an absence of antibodies in endemically infected wild populations (Kosoy et al. 1997, 2004a). Further investigation of this is required.
Relationships between alternative hosts and infection probabilities
Infection probabilities in field voles increased with increasing densities of wood mice for both B. grahamii and B. doshiae, possibly suggesting that interspecies transmission (via fleas) influences the dynamics of some Bartonella species. Indeed, it is striking that although B. grahamii commonly infected field voles, field vole density did not influence infection probabilities. These findings are particularly interesting as, although many parasites infect multiple host species, there is little empirical evidence of systems where the presence of multiple host species favours high pathogen abundance (‘amplification’) (Begon, 2007).
Interactions between Bartonella species
Finally, it is not possible to draw many conclusions about interactions between Bartonella species within individual hosts, due to the possibility of our results being influenced by interactions during isolation procedures. For two species, B grahamii and B. doshiae, isolation and direct PCR results tended to concur (see Materials and Methods section). This suggests that if competition did occur on agar plates these species tended to dominate. However, it is noticeable that both these species were still negatively influenced by other Bartonella species in the GLMM. Negative interactions between Bartonella species have been demonstrated when they are grown together in liquid media (Maggi et al. 2005). However, more data, without potential laboratory bias, are required to investigate this phenomenon, which would represent a rare example of interspecific competition between microparasites within hosts.
We thank Jonathan Fairbairn, Anna Goodsall, Gill Hutcheson, Dave Jones, Steve Paterson, Laura Taylor, David Tidhar, Weibka Lammers, Nicola Williams and many others for help with field and laboratory work. The work was supported by funding from NERC (GR3/13051) and The Wellcome Trust (075202/Z/04/Z). R.J.B. was supported by a Wellcome Trust Medical Microbiology Fellowship. The study conforms to UK regulations.