


1. Long-horizon discounting and pure time preference
Many public decisions have consequences far beyond the usual appraisal horizon: flood defence, climate adaptation, nuclear decommissioning, biodiversity and research infrastructure. Long-horizon appraisal is sensitive to small changes in the discount rate. How the rate is set at distant horizons can determine whether a project passes or fails on its merits.
Several governments derive the social discount rate from the Ramsey Rule, which separates the rate into distinct components: pure time preference, catastrophic risk, the elasticity of marginal utility and expected consumption growth. The UK Green Book is the most explicit example, separating these components and publishing their values. France also follows such an approach, with a risk-free rate compatible with a Ramsey decomposition, although the French guidelines do not put a number on the individual component values (Freeman et al., Reference Freeman, Groom and Spackman2018; Spackman, Reference Spackman2025). In each case, the question arises: should each component be treated as fixed?
The one component sometimes modelled as varying is the discount rate. Standard arguments for declining discount rates rest on uncertainty about future growth (Weitzman, Reference Weitzman2001; Arrow et al., Reference Arrow, Cropper, Gollier, Groom, Heal, Newell, Nordhaus, Pindyck, Pizer, Portney, Sterner, Tol and Weitzman2014), or on aggregation across agents with heterogeneous preferences (Gollier and Zeckhauser, Reference Gollier and Zeckhauser2005). From this perspective, the policymaker should in each period discount the future as if the discount rate were declining. Our analysis of long-run macroeconomic evidence points strongly to a further motivation that the rate of pure time preference itself is steadily declining.
We discuss this evidence and illustrate the quantitative implications of this using the UK Green Book, which separates components most transparently and is currently under active review (HM Treasury, 2025). Since the evidence discussed here points to the value of the discount itself declining over calendar time, the term structure is not only declining but also shifting downward across generations. The declining discount rate schedule should thus reflect not only the standard step-down decline over longer horizons but also the expectation that the starting value of pure time preference is itself falling over time. This is a claim about the evolution of a Ramsey Rule parameter, not about uncertainty or static heterogeneity alone.
Under the HMT Green Book, a £20 billion liability in year 100 is worth about £1.0 billion today under the standard schedule, but about £1.6 billion if pure time preference is removed. Current supplementary guidance already requires appraisals beyond 50 years to report results excluding pure time preference (HM Treasury, 2026b). We argue for an additional test: agencies should report an additional sensitivity in which δ declines with horizon and where that declining rate starts at a lower level depending on the initial year. The recommendation is not to replace a government’s central discount rate or to create a special rate for projects in particular sectors or beyond threshold horizons. In the UK context, this sensitivity can sit alongside the standard Green Book schedule and the existing δ = 0 sensitivity, and it should apply symmetrically to future benefits and future liabilities.
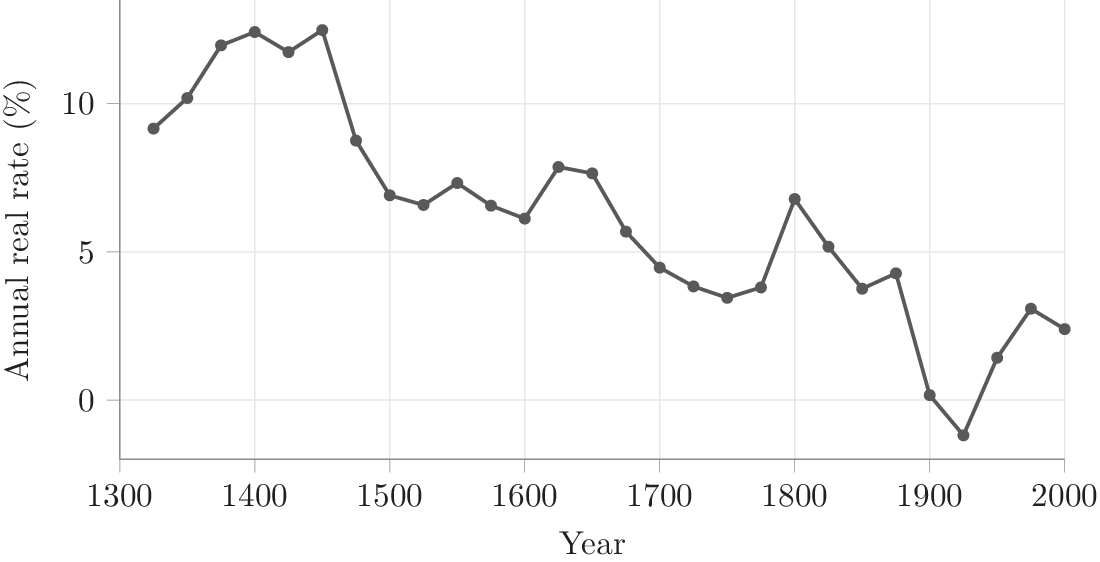
The historical evidence is that global real interest rates have been falling for centuries. Schmelzing (Reference Schmelzing2020) documents a decline in global real rates from roughly 11–12 percent in the fourteenth century to 2–3 percent in the modern period. Rogoff et al. (Reference Rogoff, Rossi and Schmelzing2024) find, using this data, that real rates are trend-stationary and trending downward since the Renaissance. In a Ramsey decomposition, we have only a few ways to interpret this decline. Growth does not help, since it was close to zero for most of the pre-industrial period and rose sharply after the Industrial Revolution, and since higher growth should push discount rates up, not down. If, as we argue in Stefanski and Trew (Reference Stefanski and Trew2024), risk, longevity, demographics, productivity and measurement do not fully account for the fall, then a lower pure-time-preference component becomes a plausible candidate. The inference is indirect, which is why the policy implication is a sensitivity rather than a new central estimate.
A pattern this persistent and robust demands an explanation within the Ramsey framework, and the implications for long-horizon discounting should be taken seriously regardless of which structural explanation one favours. One such explanation is selection towards patience. Stefanski and Trew (Reference Stefanski and Trew2024) show in a calibrated macroeconomic model that if patience differs across individuals and persists across generations, the population-weighted distribution of patience shifts over time, accounting for much of the long decline in real rates. This mechanism gives one reason to expect the decline to continue. But the case for treating δ as horizon-dependent does not rest on accepting that particular mechanism. It rests on the empirical fact that real rates have fallen steadily for centuries, growth cannot explain the decline and the Ramsey decomposition points to δ as a plausible residual candidate.
A declining δ does not determine the ethical rate at which government should value future people, nor does it make all long-lived projects more attractive, but it does raise the societal present value of delayed liabilities as well as delayed benefits. The question is not whether government should favour projects with distant payoffs. It is whether appraisals should show when their conclusions depend on an assumption that pure time preference remains fixed for generations.
2. Which part of the rate moves?
The Green Book discount rate is built from separate assumptions about impatience, risk, growth and diminishing marginal utility. HM Treasury (2026a) defines the discount rate as the Social Time Preference Rate (STPR). The standard Ramsey Rule (Ramsey, Reference Ramsey1928) writes the consumption discount rate as

where ρₜ = δₜ + Lₜ. Pure time preference, δₜ, captures impatience: the preference for benefits now rather than later. Catastrophic or systemic risk, Lₜ, captures risks not normally included in appraisal. The term μgₜ is the wealth effect: future consumption is expected to be higher, so an additional pound of future consumption has lower marginal utility.
The Green Book STPR is a social appraisal parameter, not a market interest rate. Spackman (Reference Spackman2025) identifies three traditions for setting the social discount rate: the Financial Economists’ approach, which ties the rate to the expected return on private equity and debt; the Social Opportunity Cost (SOC) approach, which derives the rate from the return on displaced private investment; and the Social Time Preference (STP) approach, which derives the rate from society’s time preference for marginal consumption; the Green Book uses the STP approach. Pearce and Ulph (Reference Pearce, Ulph and Pearce1999) argued that this was the right basis for UK public appraisal, since market returns include private risk premia, tax distortions and myopia. Under STP, the Ramsey Rule components are specified separately (Freeman et al., Reference Freeman, Groom and Spackman2018), and δ is a parameter to be justified rather than simply inferred from asset prices.
Freeman et al. (Reference Freeman, Groom and Spackman2018) describe the STPR as normative: the final number represents a form of consensus on the theoretical and empirical literature, as well as political and administrative views. Judgement about δ has always drawn on empirical inputs. Pearce and Ulph (Reference Pearce, Ulph and Pearce1999) used evidence on savings behaviour and market interest rates to place δ in the range 0–0.5 percent. The life-cycle behavioural approach reviewed in Freeman et al. (Reference Freeman, Groom and Spackman2018) estimates Ramsey Rule parameters from data, interpreting the intercept α in r = α + ηg as related to ρ, while noting that α is not generally equal to ρ because of distortions between market rates and the STP rate. Our approach belongs in this tradition of empirically informed STP calibration, but with a different evidence base. Rather than using short-run market rates or survey responses, we use the long-run historical decline in real rates, combined with a Ramsey decomposition, to ask what path of δₜ is consistent with the data once growth and other factors are accounted for.
Our approach preserves an STP framework—δ, L, μ and g are separate, interpretable components—but brings historical evidence to bear on one part of it. As Spackman (Reference Spackman2025) notes, the STP rate for consumption is not well revealed by markets, because risk-free interest rates are largely set by governments to manage business cycles. The long-run data help precisely because they look past cyclical variation to the secular trend (Figure 1).
Global real interest rates, 1325–2000.
Source: Stefanski and Trew (Reference Stefanski and Trew2024), based on 25-year medians from Schmelzing (Reference Schmelzing2020). Historical market real rates are not the Green Book STPR. The figure motivates the question of which Ramsey Rule component should move; it does not estimate δ.

Figure 1. Long description
The horizontal X axis is labeled Year and ranges from 1300 to 2000 in increments of 100. The vertical Y axis is labeled Annual real rate percent and ranges from 0 to 10 with major grid lines. The data is plotted as a series of connected dots representing 25 year medians.
Starting at approximately 1325, the rate begins near 9 percent and rises to a peak of roughly 12.5 percent around 1400 to 1450. Following 1450, there is a sharp decline to about 7 percent by 1500. The rate fluctuates between 6 and 8 percent until 1650, after which it enters a steady decline, reaching approximately 3.5 percent by 1750.
A brief spike occurs around 1800, hitting nearly 7 percent, followed by a volatile descent. The lowest point in the dataset occurs in the early 20th century, dropping slightly below 0 percent around 1925. The graph concludes at the year 2000 with a rate of approximately 2.5 percent, illustrating a significant historical decline from the medieval period to the modern era.
HM Treasury (2026b) sets the Green Book schedule at 3.5 percent for years 1–30, 3.0 percent for years 31–75 and 2.5 percent for years 76–125. For appraisals with effects beyond 50 years, the guidance also requires a sensitivity that excludes pure time preference. That official δ = 0 case uses lower rates: 3.00 percent for years 1–30, 2.57 percent for years 31–75, 2.14 percent for years 76–125 and lower rates beyond that.
The Green Book also varies discounting when the type of project being valued changes. Health effects are appraised at 1.5 percent because the wealth-effect component is excluded (HM Treasury, 2026b). The official δ = 0 sensitivity changes one component and leaves the rest of the Ramsey Rule intact; a declining-δ sensitivity follows the same logic. Table 1 summarises the four STPR components and their treatment in the proposed declining-δ sensitivity.
Green Book STPR components

Table 1. Long description
The table consists of four columns: Component, Green Book role, Value, and Treatment in declining-delta sensitivity.
* Row 1: Pure time preference, delta. Role: Impatience for benefits now rather than later. Value: 0.5 percent. Treatment: Allow to decline.
* Row 2: Catastrophic risk, L. Role: Allowance for risks not normally included in appraisal. Value: 1.0 percent. Treatment: Hold fixed.
* Row 3: Elasticity of marginal utility, mu. Role: Converts consumption growth into welfare weights. Value: 1.0. Treatment: Hold fixed.
* Row 4: Consumption growth, g. Role: Expected real per-capita consumption growth. Value: 2.0 percent. Treatment: Hold fixed.
The source is cited as H M Treasury supplementary guidance on discounting.
Source: HM Treasury supplementary guidance on discounting (HM Treasury, 2026b).
The distinction with Stern (Reference Stern2006), which gives an ethical case for removing pure time preference, is important. Stefanski and Trew (Reference Stefanski and Trew2024) give a positive reason why pure time preference may change over time: the population distribution of patience may shift. Our claim is therefore quite narrow.
Pure time preference is also where expert disagreement is sharpest. In the survey of more than 200 economists in Drupp et al. (Reference Drupp, Freeman, Groom and Nesje2018), the modal recommended value of δ is zero, the median is 0.5 percent and the mean is 1.1 percent. The overall recommended SDR averages about 2 percent, well below the current Green Book rate of 3.5 percent. Freeman et al. (Reference Freeman, Groom and Spackman2018) confirm that estimates of δ typically reflect catastrophic risk as well as pure time preference, and that the expert estimates in Drupp et al. (Reference Drupp, Freeman, Groom and Nesje2018) are somewhat below those used in the Green Book. A declining-δ sensitivity is therefore not an extreme position but lies close to the middle of the existing debate.
The rationale here is related to, but distinct from, the standard arguments for declining social discount rates. Those arguments usually rest on uncertainty about future growth, uncertainty about the appropriate discount rate or ethical concerns about intergenerational welfare; see, among others, Weitzman (Reference Weitzman2001), Gollier (Reference Gollier2012), Arrow et al. (Reference Arrow, Cropper, Gollier, Groom, Heal, Newell, Nordhaus, Pindyck, Pizer, Portney, Sterner, Tol and Weitzman2013, Reference Arrow, Cropper, Gollier, Groom, Heal, Newell, Nordhaus, Pindyck, Pizer, Portney, Sterner, Tol and Weitzman2014), Cropper et al. (Reference Cropper, Freeman, Groom and Pizer2014), Freeman et al. (Reference Freeman, Groom and Spackman2018) and Drupp et al. (Reference Drupp, Freeman, Groom and Nesje2018). Gollier and Zeckhauser (Reference Gollier and Zeckhauser2005) add a related point: if people have different discount rates, aggregation can produce a representative-agent rate that declines with horizon. That is a static result about heterogeneity at a point in time.
The selection mechanism adds an underlying, micro-founded basis for a DDR. In Stefanski and Trew (Reference Stefanski and Trew2024), the population contains individuals with different degrees of patience. Aggregating across them can generate a declining term structure at any date. However, selection also shifts the distribution itself. If more patient types become more heavily represented over time, the whole term structure moves down across generations. This article focuses on that second margin: the possible evolution of pure time preference.
3. Real rates and patience
Figure 1 shows the scale of the long-run decline in real interest rates, based on Schmelzing (Reference Schmelzing2020). The pattern is not confined to a single series—Rogoff et al. (Reference Rogoff, Rossi and Schmelzing2024) show it holds across maturities and countries over seven centuries, and English land returns in Clark (Reference Clark and Field2010) show a similar broad trajectory. The robustness of the decline matters because it is the empirical foundation of the argument, and even without a structural model, the Ramsey decomposition points to δ as the residual candidate once growth, risk and other factors are accounted for. This section considers what might drive such a decline.
First, the use of historical market rates to inform the STP calibration requires comment. As Spackman (Reference Spackman2025) observes, short-run risk-free rates are largely set by governments and do not well reveal society’s time preference for consumption. Our approach differs from the Euler-equation method reviewed in Freeman et al. (Reference Freeman, Groom and Spackman2018), which estimates the Ramsey Rule from relatively short samples and interprets the intercept as ρ. We do not equate the market interest rate with the STP rate. Instead, we use the direction and scale of the centuries-long decline in real rates, after accounting for growth and other factors, to ask which Ramsey Rule component must have moved. The inference does not require that historical market rates equal the level of the STP rate at any point; it requires only that the secular trend in rates is informative about the secular trend in the underlying parameters—a weaker claim that is robust to the level distortions that Spackman (Reference Spackman2025) and Freeman et al. (Reference Freeman, Groom and Spackman2018) flag.
The fall in real rates does not by itself prove that society has become more patient. Real rates also reflect risk, default, liquidity, safe-asset demand, demographics, productivity, inequality, financial development and measurement. As noted in the introduction, and as developed in detail in Stefanski and Trew (Reference Stefanski and Trew2024) and (Reference Stefanski and Trew2026), growth points in the wrong direction, while demographics, risk and measurement do not appear sufficient in their timing or magnitude to explain the full decline. A shift in the population distribution of time preference is therefore a plausible candidate in the Ramsey decomposition. The next question is what mechanism could produce such a shift.
The proposed channel does not require every individual to become more patient. Falk et al. (Reference Falk, Becker, Dohmen, Enke, Huffman and Sunde2018) show large differences across individuals in willingness to delay consumption. Brenoe and Epper (Reference Brenoe and Epper2022), Chowdhury et al. (Reference Chowdhury, Sutter and Zimmermann2022) and Cronqvist and Siegel (Reference Cronqvist and Siegel2015) document persistence in patience across generations, whether through socialisation, family routines, education, institutions, culture or imitation. In family-based models, such as Becker and Barro (Reference Becker and Barro1988) and Barro and Becker (Reference Barro and Becker1989), patient households place greater weight on future family welfare, which can affect both saving and investment in children. Bauer and Chytilova (Reference Bauer and Chytilova2013) show that patience and fertility choices can be related in household data. If more patient groups leave more descendants, or invest more successfully in descendants, population-weighted patience rises over time. In a Ramsey framework, that shift lowers the pure-time-preference component of the social discount rate.
The fertility channel is not a literal description of every modern high-income economy, where patience, education and fertility need not move together. Patience can matter through human capital, cultural persistence, saving behaviour and effective investment in descendants, not only through the number of children. The process is slow and uncertain, but it gives an empirical reason to treat δ as horizon-dependent.
This is also not the Stern argument in another form. Stern sets δ at zero on ethical grounds: future welfare should not count for less simply because it is future welfare. The argument in this article is about the empirical parameter used to represent societal impatience in the Green Book. If individual patience is heterogeneous, persistent across generations and related to investment in descendants, the population-weighted value of that parameter may fall over time. That does not settle the ethical question, nor does it imply that δ should be zero. As Pearce and Ulph (Reference Pearce, Ulph and Pearce1999) note, when future consumption is expected to be higher, a zero pure-time-preference rate can shift resources towards richer future generations. The point here is that a declining-δ sensitivity lies between the current Green Book value and the official δ = 0 case, and is motivated by evidence rather than by an ethical prior.
Stefanski and Trew (Reference Stefanski and Trew2024) calibrate a heterogeneous-agent fertility model using modern evidence on the distribution of patience and historical evidence on population, output, life expectancy and capital accumulation. Box 1 summarises how population-weighted patience enters the real interest rate in that model. In their baseline calibration, selection towards patience accounts for most of the long decline in real rates; without preference heterogeneity and selection, the model explains little of the centuries-long fall. The model gives the historical pattern a mechanism. It also gives a reason why the decline in δ might persist: selection is ongoing. For Green Book appraisal, the lesson is not a single correct path for δ. It is that long-horizon sensitivity analysis should let evidence—both the historical pattern and the structural explanation—inform pure time preference, rather than treat it as fixed by default.
How patience enters the interest rate.
In the model in Stefanski and Trew (Reference Stefanski and Trew2024), the real interest rate depends on growth and on the population-weighted mean discount factor. Growth raises the return required to transfer resources into the future. Greater patience lowers it. In simplified form, the gross real interest rate is approximately

where gN is population growth, gᴅ is productivity growth, ν is a production parameter and Eₜ(β) is the population-weighted mean discount factor. Growth appears in the numerator. Patience appears in the denominator. Selection towards more patient types increases Eₜ(β) over time and therefore lowers the pure-time-preference component over long horizons.
The patience-selection channel is complementary to, not a substitute for, the standard uncertainty-based arguments for declining rates. Arrow et al. (Reference Arrow, Cropper, Gollier, Groom, Heal, Newell, Nordhaus, Pindyck, Pizer, Portney, Sterner, Tol and Weitzman2014) show that persistent shocks to consumption growth produce a certainty-equivalent discount rate that declines with the horizon. They also note that if the parameters of the Ramsey Rule themselves—including δ—are uncertain, the same logic applies. Patience selection provides one empirical reason for δ to be both uncertain and horizon-dependent, reinforcing the standard case for DDRs from a different direction.
The same implication appears in a naïve Euler-equation calculation. Let Rₜ denote the gross real return and let smoothed real GDP per person grow at rate gₜ. The standard Euler equation implies

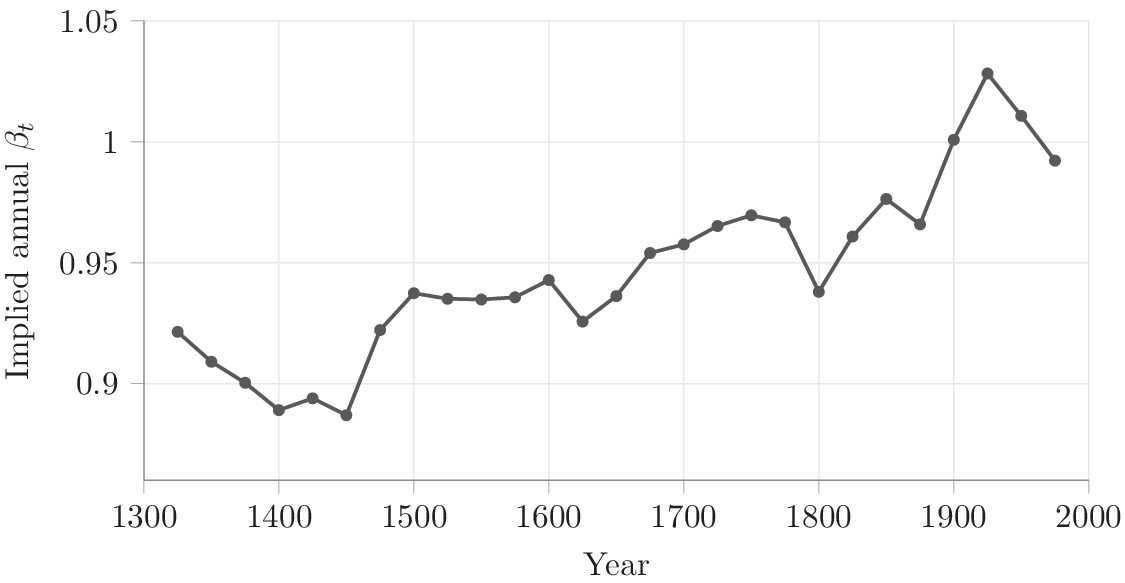
Figure 2 plots the implied discount factor using the long-run real-rate series and UK GDP-per-capita growth. The calculation uses Figure 1 and Bank of England (2017), sheet A21, with a level HP filter (λ = 100). The level should not be over-interpreted—in several twentieth-century observations the implied βₜ is above one, mainly because the calculation omits mortality, liquidity premia, risk premia, taxes and other wedges. The trend is the useful inference that combining the historical fall in real rates with long-run growth data points to a substantial rise in the discount factor.
Naïve implied discount factor from real rates and GDP-per-capita growth.
Source: Authors’ calculations from Figure 1 and Bank of England (2017), sheet A21; HP filter (λ = 100).
Notes: The calculation uses log utility and the gross real return Rₜ, so βₜ = (1 + gₜ)/Rₜ. It is an illustrative exercise, not a calibrated estimate of household patience or the Green Book STPR. The level should not be over-interpreted. In several twentieth-century observations, the implied βₜ is above one, mainly because the calculation omits mortality, liquidity premia, risk premia, taxes and other wedges

Figure 2. Long description
The horizontal X axis is labeled Year and ranges from 1300 to 2000 in increments of 100. The vertical Y axis is labeled Implied annual beta sub t and ranges from 0.9 to 1.05 in increments of 0.05.
Data points are represented by dark circular markers connected by a solid dark gray line.
* From 1300 to 1450, the line shows a downward trend, starting at approximately 0.92 and reaching a trough just below 0.89.
* Between 1450 and 1500, there is a sharp increase to approximately 0.94.
* From 1500 to 1600, the value remains relatively stable with minor fluctuations between 0.93 and 0.94.
* After 1600, the line exhibits a long-term upward trend with significant volatility.
* A notable dip occurs around 1800, dropping to approximately 0.94 before rising again.
* The peak of the data occurs around 1925, where the implied beta sub t exceeds 1.025.
* The final segment shows a decline toward the year 2000, ending just below 1.0.
4. How large is the margin?
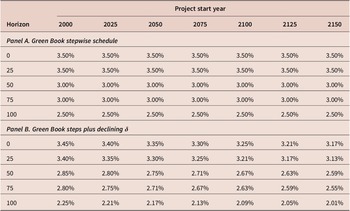
Much of the discounting debate is framed in terms of horizons: should the rate applied to a benefit 75 or 100 years ahead be lower than the rate applied to a benefit 10 years ahead? The Green Book already answers in the affirmative, and its schedule declines with the horizon of the benefit or cost. The mechanism here adds two points. First, declining patience gives a reason for an additional declining-δ sensitivity at long horizons. Second, if pure time preference is falling over calendar time, the base year also matters. A benefit 50 years after a project starts should not necessarily receive the same rate when the project begins in 2025 as when it begins in 2050 or 2100.
Table 2 makes this distinction explicit. Panel A gives the current horizon-only logic in which the base year is irrelevant; Panel B illustrates the extra implication of a declining pure-time-preference component where rates depend on both the horizon and the project start year. A declining-δ sensitivity is not just a lower long-horizon schedule, but it is also a schedule whose starting point shifts down over calendar time.
Illustrative appraisal rates by horizon and project start year

Table 2. Long description
The table is organized with Horizon as the first column and Project start years (2000, 2025, 2050, 2075, 2100, 2125, 2150) as the subsequent columns.Panel A. Green Book stepwise schedule:* Horizon 0: 3.50% across all years.* Horizon 25: 3.50% across all years.* Horizon 50: 3.00% across all years.* Horizon 75: 3.00% across all years.* Horizon 100: 2.50% across all years.Panel B. Green Book steps plus declining delta:* Horizon 0: Rates decrease from 3.45% in 2000 to 3.17% in 2150.* Horizon 25: Rates decrease from 3.40% in 2000 to 3.13% in 2150.* Horizon 50: Rates decrease from 2.85% in 2000 to 2.59% in 2150.* Horizon 75: Rates decrease from 2.80% in 2000 to 2.55% in 2150.* Horizon 100: Rates decrease from 2.25% in 2000 to 2.01% in 2150.
Panel A. Green Book stepwise schedule:
* For Horizon 0 and 25, the rate is 3.50% across all start years.
* For Horizon 50, the rate is 3.00% across all start years.
* For Horizon 75, the rate is 3.00% across all start years. For Horizon 100, the rate is 2.50% across all start years.
Panel B. Green Book steps plus declining delta:
* For Horizon 0, rates decrease from 3.45% in 2000 to 3.17% in 2150.
* For Horizon 25, rates decrease from 3.40% in 2000 to 3.13% in 2150.
* For Horizon 50, rates decrease from 2.85% in 2000 to 2.59% in 2150.
* For Horizon 75, rates decrease from 2.80% in 2000 to 2.55% in 2150.0.
* For Horizon 100, rates decrease from 2.25% in 2000 to 2.01% in 2150.
In Panel B, every value decreases by approximately 0.04% to 0.05% for every 25-year increase in the project start year.
Source: Authors’ calculations.
Notes: Rates are annual percentages at selected horizons. Panel A shows the current horizon-based logic: the same horizon receives the same rate regardless of project start year. Panel B illustrates the additional base-year margin implied by a declining pure-time-preference component.
For the present-value calculations below, we use a deliberately simple version of this idea. We compare the current Green Book schedule, the official sensitivity that excludes pure time preference and an intermediate declining-δ sensitivity. The intermediate case is not an estimate of the true path of δ; it is a sensitivity test leaving years 1–30 unchanged and moving the later Green Book rates part-way towards the official δ = 0 sensitivity.
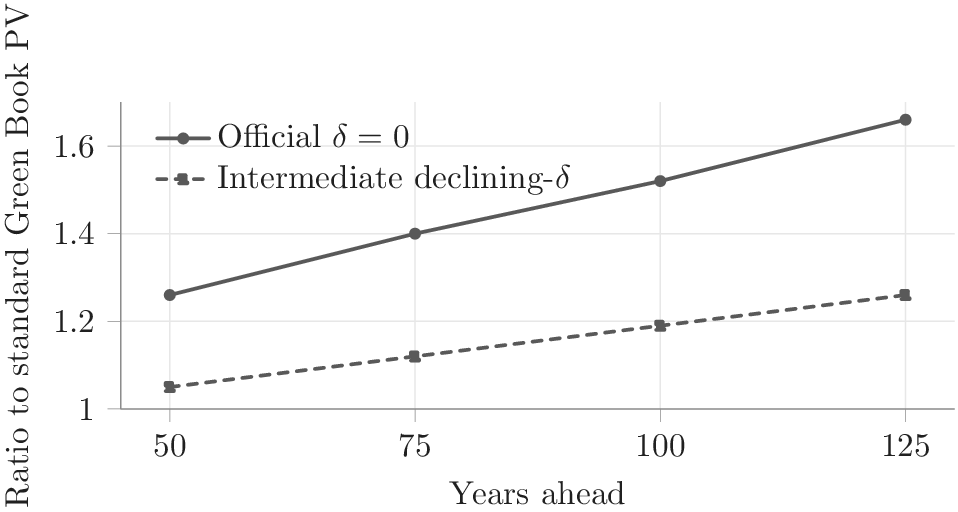
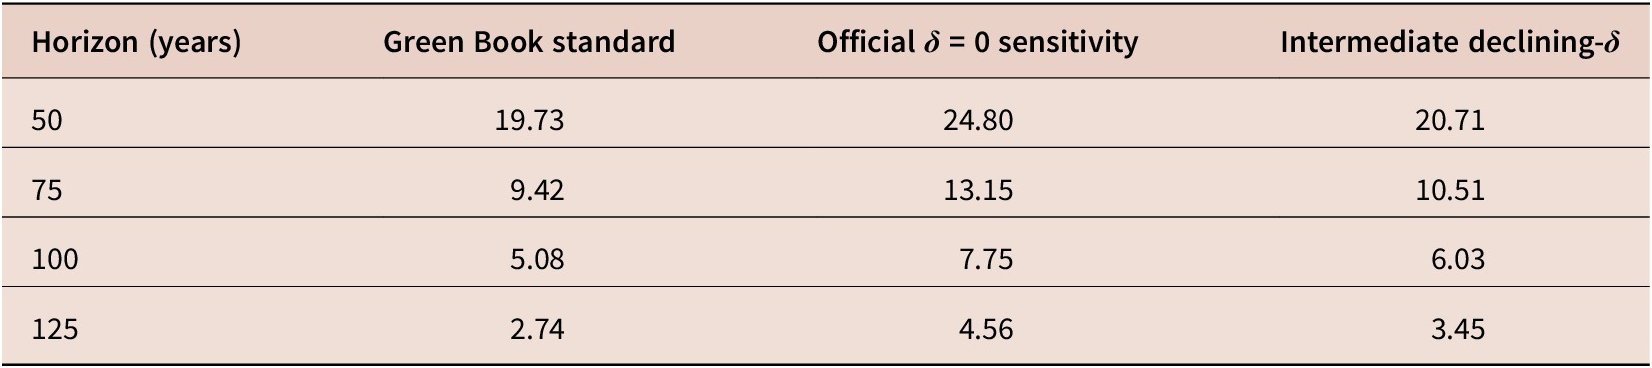
Table 3 shows the present value of a single £100 payoff under these three cases. The differences are modest at 50 years and larger at 100 or 125 years. Under the intermediate declining-δ schedule, a £100 payoff in year 100 is worth £6.03 today, compared with £5.08 under the standard Green Book schedule. Under the official δ = 0 sensitivity, it is worth £7.75. Figure 3 plots the corresponding present values under the two sensitivities relative to the standard Green Book schedule.
Present value relative to the Green Book standard schedule.
Source: Authors’ calculations using Table 3.
Notes: Ratios use the present values in Table 3. The official δ = 0 sensitivity removes pure time preference entirely. The intermediate declining-δ path is illustrative.

Figure 3. Long description
A line graph with the horizontal x-axis labeled Years ahead, ranging from 50 to 125 in increments of 25. The vertical y-axis is labeled Ratio to standard Green Book P V, ranging from 1 to 1.6.
Two data series are plotted:
* Official delta equals 0: Represented by a solid line with circular markers. It shows a linear increase starting at approximately 1.26 at year 50, rising to 1.4 at year 75, 1.52 at year 100, and ending at roughly 1.66 at year 125.
* Intermediate declining-delta: Represented by a dashed line with square markers. It shows a shallower linear increase starting at approximately 1.05 at year 50, rising to 1.12 at year 75, 1.19 at year 100, and ending at approximately 1.26 at year 125.
The Official delta equals 0 line maintains a consistently higher ratio than the Intermediate declining-delta line across the entire time horizon.
Present value of a single £100 payoff under alternative Green Book sensitivities

Table 3. Long description
The table consists of four columns and four data rows.
Column headers are: Horizon in years, Green Book standard, Official delta equals 0 sensitivity, and Intermediate declining-delta.
Data rows:
* At a 50 year horizon, the present values are 19.73 for Green Book standard, 24.80 for Official delta equals 0, and 20.71 for Intermediate declining-delta.
* At a 75 year horizon, the present values are 9.42 for Green Book standard, 13.15 for Official delta equals 0, and 10.51 for Intermediate declining-delta.
* At a 100 year horizon, the present values are 5.08 for Green Book standard, 7.75 for Official delta equals 0, and 6.03 for Intermediate declining-delta.
* At a 125 year horizon, the present values are 2.74 for Green Book standard, 4.56 for Official delta equals 0, and 3.45 for Intermediate declining-delta.
Across all sensitivities, the present value decreases as the time horizon increases.
Source: Authors’ calculations using HM Treasury (2026b).
Notes: Year 0 is undiscounted. Rates apply from years 1–30, 31–75 and 76–125. The Green Book standard schedule is 3.5, 3.0 and 2.5 percent. The official δ = 0 sensitivity is 3.00, 2.57 and 2.14 percent. The intermediate declining-δ schedule is 3.5, 2.75 and 2.25 percent.
5. What guidance should do
The Green Book already separates δ, L, μ and g, and HM Treasury (2026b) requires these components to be reported separately for sensitivity analysis. The implication of this article is that long-horizon appraisals should report three cases: the standard Green Book schedule, the official δ = 0 sensitivity and an evidence-informed declining-δ sensitivity motivated by long-run macroeconomic evidence.
Such schedules should apply symmetrically to costs and benefits. Box 2 illustrates this symmetry using a flood-defence scheme and a nuclear decommissioning liability. Discounting debates often focus on climate, infrastructure and other delayed benefits. However, the same arithmetic applies to decommissioning, waste, environmental damage and other delayed liabilities. A lower long-run SDR raises the value of all future consequences, good and bad, and if an option ranking depends on the treatment of distant outcomes, the appraisal should say so.
Delayed benefits and delayed liabilities.
Consider a stylised flood-defence scheme with an upfront cost of £2bn and avoided damages of £120 m per year from years 20 to 119. Under the current Green Book schedule, the net present social value is −£0.09bn. Under the intermediate declining-δ schedule, it is £0.01bn. Under the official δ = 0 sensitivity, it is £0.39bn. A project with delayed benefits can move from just below to just above zero when the long-run pure-time-preference component is allowed to fall.
A lower long-run δ also raises future liabilities. A £20bn nuclear waste or decommissioning liability in year 100 has a present value of £1.02bn under the current Green Book schedule, £1.21bn under the intermediate declining-δ schedule and £1.55bn under the official δ = 0 sensitivity. A lower long-run SDR is therefore not a subsidy to long-run projects; it is a different valuation of all future consequences.
Assumptions: real values; year-0 capital cost; no optimism-bias adjustment; no risk adjustment; constant annual avoided damages; no relative-price adjustment.
The Green Book already flags this class of appraisal in its treatment of long-horizon effects, irreversible environmental change and intergenerational wealth transfers. The declining-δ sensitivity fills the gap between the standard schedule and the official δ = 0 case for exactly these projects.
This is also why a special discount rate for ‘transformational’ projects is unnecessary. The declining-δ sensitivity should apply to all appraisals with material long-horizon effects. It does not ask officials to decide which projects deserve favourable discounting. It asks them to show when the result depends on the long-run path of pure time preference.
Reporting the components separately also reduces the temptation to load other issues into the SDR. Health effects, environmental scarcity, risk and relative-price changes each have separate Green Book treatment. They should not be folded into δ without explanation. Spackman (Reference Spackman2025) makes a related point: the marginal excess tax burden (METB) and the social cost of public funds are distinct from the discount rate and should not be conflated with it. Treating δ as a catch-all for concerns that properly belong elsewhere obscures the appraisal.
The evidence base for long-horizon δ should be wider than short-run market rates. Historical real rates, reduced-form estimates of declining discount-rate schedules, micro evidence on patience and intergenerational transmission, accounting decompositions, and calibrated models such as Stefanski and Trew (Reference Stefanski and Trew2024) each speak to a different part of the same question: whether pure time preference is likely to be fixed at long horizons. Reduced-form estimates from historical interest-rate data show the term-structure implication (Groom et al., Reference Groom, Koundouri, Panopoulou and Pantelidis2007; Freeman et al., Reference Freeman, Groom, Panopoulou and Pantelidis2015). The selection mechanism gives one interpretation of its source. Other explanations for declining safe real rates remain important, including demographics, inequality and safe-asset demand (Carvalho et al., Reference Carvalho, Ferrero and Nechio2016; Mian et al., Reference Mian, Straub and Sufi2021).
An important question is how the patience-selection channel interacts with reduced-form estimates of DDR term structures derived from historical interest-rate data, such as the Newell-Pizer approach used in Groom et al. (Reference Groom, Koundouri, Panopoulou and Pantelidis2007) and Freeman et al. (Reference Freeman, Groom, Panopoulou and Pantelidis2015). Those estimates fit an autoregressive process to observed real rates and extract a certainty-equivalent rate that declines with horizon. If selection towards patience is one of the forces that produced the historical downward trend in rates, then the reduced-form estimates already partly capture its effect. This is reassuringly convergent evidence—the reduced-form approach identifies the declining term structure without explaining why rates trend downward; the selection mechanism offers a structural explanation that identifies which Ramsey Rule component is responsible and therefore which parameter (δ, not L, μ or g) should carry the adjustment in the Green Book framework.
6. Conclusion
Any government that uses the Ramsey Rule to set a social discount rate must take a position on the long-run path of pure time preference. A declining-δ sensitivity does not settle the ethical debate over discounting and does not favour long-lived projects mechanically. However, empirical analysis of long-run real rates, naïve decomposition of its components and structural evidence on the evolution of patience all suggest that the fundamental social discount rate has been falling. We have illustrated the quantitative implications using the UK Green Book, but the argument applies wherever pure time preference is a separate, interpretable parameter in the social discount rate.
Competing interests
The authors declare none.
AI-use declaration
The authors used OpenAI ChatGPT and OpenAI Codex, accessed through the OpenAI web and desktop interfaces during June–July 2026, for drafting suggestions, copy-editing, LaTeX preparation, compilation checks and assistance with simple reproducible calculations from cited data sources. No AI tool is listed as an author. The authors reviewed and approved all text, calculations, figures and references, and take full responsibility for the accuracy, integrity and originality of the manuscript.


 Open access

