

Introduction
Development of ascites in patients with cancer is often a multifactorial process involving peritoneal metastases, hepatic metastases, increased vascular permeability, and/or lymphatic obstruction (Becker et al., Reference Becker, Galandi and Blum2006; Cavazzoni et al., Reference Cavazzoni, Bugiantella and Graziosi2013; Sangisetty & Miner, Reference Sangisetty and Miner2012). Symptoms include abdominal distension, orthopnea, and early satiety. Patients with large-volume ascites often have limited mobility. These symptoms can be debilitating and have been shown to negatively affect quality of life (QoL; Courtney et al., Reference Courtney, Nemcek AA and Rosenberg2008; Easson et al., Reference Easson, Bezjak and Ross2007; Husain et al., Reference Husain, Bezjak and Easson2010; Monsky et al., Reference Monsky, Yoneda and MacMillan2009).
Ascites occurring in the setting of a malignancy accounts for approximately 10% of cases and is associated with poor survival, especially in gastrointestinal cancers (Hicks et al., Reference Hicks, Chou and Capanu2016). There are no national guidelines for management of refractory ascites in the setting of end-stage cancer (Ayantunde & Parsons, Reference Ayantunde and Parsons2007; Becker et al., Reference Becker, Galandi and Blum2006; Runyon, Reference Runyon1994; White & Carolan-Rees, Reference White and Carolan-Rees2012). Refractory ascites is refractory to systemic therapy, including diuresis. Serial paracentesis remains the standard of care at many institutions (Ayantunde & Parsons, Reference Ayantunde and Parsons2007; Jehn et al., Reference Jehn, Kupferling and Oskay-Ozcelik2015; Stukan, Reference Stukan2017). When ascites reaccumulates rapidly, it is it burdensome for patients who require frequent trips to the hospital for repeat paracentesis, which includes risk of bleeding and peritonitis (Bohn & Ray, Reference Bohn and Ray2015; Hicks et al., Reference Hicks, Chou and Capanu2016; Markman, Reference Markman2012; Stukan, Reference Stukan2017).
More durable treatment options include percutaneous tunneled drainage catheters (PTDC), peritoneovenous shunts, nontunneled percutaneous drainage catheters, and implantable peritoneal ports (Coupe et al., Reference Coupe, Cox and Clark2013; Courtney et al., Reference Courtney, Nemcek AA and Rosenberg2008; Fleming et al., Reference Fleming, Alvarez-Secord and Von Gruenigen2009; Lungren et al., Reference Lungren, Kim and Stewart2013; Maleux et al., Reference Maleux, Indesteege and Laenen2016; Meier et al., Reference Meier, Mortensen and Madsen2015; Narayanan et al., Reference Narayanan, Pezeshkmehr and Venkat2014; Wong et al., Reference Wong, Cake and Kachuik2015). PTDCs allow for intermittent drainage of fluid in the home setting and are preferred over nontunneled catheters because of their stability and lower infection rates (Fleming et al., Reference Fleming, Alvarez-Secord and Von Gruenigen2009). It is hypothesized that the ability to regularly manage ascites at home will improve a patient's QoL.
Understanding the impact of an intervention on a patient's QoL is essential when the procedure is performed for palliation. The primary objective of this study was to assess the impact of PTDC on refractory ascites on QoL. Secondary objectives include evaluating catheter-related complications and the effect of PTDC on electrolyte status and mortality over the 6 months following PTDC placement.
Methods
Patients
This was an institutional review board-approved, prospective, longitudinal study of patients with refractory ascites associated with malignancy who underwent PTDC in interventional radiology at a single institution. Consecutive adult patients over a six-month period referred for PTDC placement were invited to participate. The study accrued patients between January 1 and July 1, 2011. Eligible patients were 18 years and older, able to speak and read English, documented as having stage IV or end-stage malignancy, and able to give informed consent. Patients were not given antibiotic prophylaxis before the procedure. Patients were admitted to an inpatient unit after the procedure.
Drainage catheter
The PTDC has a flow switch and is capped with a disposable cap when not in use (Figure 1). Patients open the catheter over a graduated container and drain per instructions one to two times daily. Drainage is by gravity. The referring physician provided postcatheter placement drainage quantity instructions and patients were instructed not to remove more than 1,000 mL per day without discussion with their physician. Patients did not keep drainage logs of the amount drained.
Tenckhoff catheter with flow switch. Adjacent to all instance of display of the Memorial Sloan Kettering images will be the following ©2007, Memorial Sloan Kettering Cancer Center.

Instruments
The study used two instruments to assess QoL and symptoms, the European Organization for Research and Treatment of Cancer Quality of Life Questionnaire (EORTC QLQ-C30) and the McGill Quality of Life (MQoL). Either written or telephone completion of the instruments were accepted.
The EORTC QLQ-C30 was developed by the European Organization for Research and Treatment of Cancer. This 30-question Likert scale was used to capture both overall QoL and symptom burden, including shortness of breath, limitation of activities, appetite, and mood. The EORTC QLQ-30 has demonstrated sensitivity, reliability, and validity in patients with malignant ascites (Aaronson et al., Reference Aaronson, Ahmedzai and Bergman1993; Easson et al., Reference Easson, Bezjak and Ross2007). The scores for the single-item measures as well as the scales range from 0 to 100. A high score on a scale represents a higher response level. For global health status scale, the higher the score, the higher the QoL. On the symptom scale, the higher the score, the higher the symptomatology and problem (Fayers et al., Reference Fayers, Aaronson and Bjordal2001).
The MQoL was specifically designed to assess QoL while minimizing the burden of completion in patients with a terminal condition (Lua et al., Reference Lua, Salek and Finlay2005). The MQoL is a 16-item Likert scale with four submeasures to assess the existential, support, physical, and psychological domains. Subscale scores range from 0 to 10, with 10 representing the optimal state (Cohen et al., Reference Cohen, Mount and Bruera1997). The MQoL has demonstrated acceptability, convergent and divergent validity, and reliability (Cohen et al., Reference Cohen, Mount and Tomas1996, Reference Cohen, Mount and Bruera1997). The MQoL also has been shown to be able to detect changes of QoL (Cohen & Mount, Reference Cohen and Mount2000).
The two instruments combined consist of 46 questions. Subjects were asked to complete the instruments within one week before placement of the procedure, within 7 days postprocedure and 3 weeks (±one week) after the procedure. Because the answers to the EORTC QLQ-C30 were intended to reflect the immediate postplacement period, the instructions were altered to a two-day recall period rather than the typical one-week period. The MQoL specifies a two-day recall period as well.
Assessments
Patients were contacted regularly over the six months following PTDC placement. Contact was by phone or in person if the patient was hospitalized or in clinic. Patients were contacted at the following points: before discharge from the hospital (±two days); two weeks (±three days); three, four, six, and eight weeks; and four and six months. All assessment points after two weeks had a window of ± one week. At the time of PTDC placement, patient demographic data, previous treatment for ascites, overall survival, catheter duration, Karnofsky Performance Status, and procedure-related information were collected. Complication data were collected prospectively at regular intervals by patient report and chart review. Complications were graded using the Society of Interventional Radiology (SIR) classification (Leoni et al., Reference Leoni, Potter and Rosen2001). All available albumin, creatinine, and sodium laboratory data were compiled retrospectively for the 1.5 months before and after catheter placement.
Statistical analysis
Overall survival was estimated by Kaplan-Meier method, with catheter placement as the time origin. The EORTC and MQoL questionnaires were summarized by first deriving scales from individual items according to published scoring guidelines and then calculating the median and range of each scale among patients at each of the three time points (baseline, one week, and one month) (Fayers et al., Reference Fayers, Aaronson and Bjordal2001). For multi-item scales, their values were set to missing if more than half of the items from the scales were missing; otherwise, they were calculated using the nonmissing items per scoring guidelines. Each scale was compared between baseline and one week and between baseline and four weeks using signed-rank test. The changes (i.e., slopes) in the longitudinal laboratory values 1.5 months before and after catheter placement were estimated and compared by linear mixed-effect models with random intercepts to account for within-patient correlation. All statistical analyses were performed using R 3.3.2 (R Development Core Team, 2013).
Results
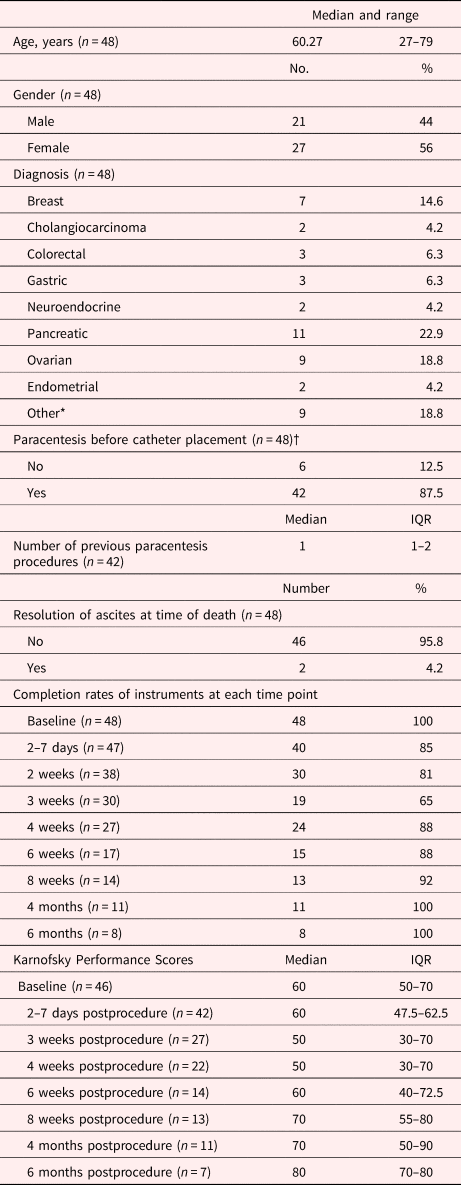
Over six months, 91 patients were scheduled for PTDC placement and 50 patients were recruited to the study. All patients had a Tenckhoff catheter (Cook Inc., Bloomington, IN) placed with a 98% technical success rate. In the one technical failure, the catheter was nonfunctional the day after placement and required immediate exchange. Forty-eight of the 50 patients were evaluable. One subject was enrolled but the procedure was canceled because of inadequate ascites; the other did not complete the assessments as instructed. Three patients withdrew over the study period and were not evaluated for complications or laboratory results. Instrument completion rates over the three timepoints ranged from 65% to 100% (median 88%) (Table 1). Demographic and procedure data are presented in Table 1.
Demographic and procedure information

*Other cancers: leukemia, esophageal, hepatocellular cancer, leiomyosarcoma, fallopian tube, urothelial, malignant fibrous histiosarcoma, liposarcoma, and melanoma.
†One patient had a previous drainage catheter placed.
Most patients (42/48; 88%) had at least one previous paracentesis before PTDC placement. One patient had a previous Tenckhoff catheter that was removed for infection two days before replacement. The median Karnofsky Performance Status score immediately before PTDC placement was 60 (interquartile ratio 50–70) and decreased to 50 (interquartile ratio 30–70) at four weeks. At subsequent time points, there was a consistent increase in reported performance status. The median survival of 48 patients was 38 days (95% confidence interval = 32–57). Six (6 of 48, 13%) patients died within in two weeks of placement, and 16 patients died within four weeks of placement (16 of 48, 33%). Only 17% patients (8/48) completed the six-month assessment, which were all patients alive at this timepoint. The one-year mortality was 96% (Figure 2).
Kaplan-Meier curve. Median survival of 48 patients was 38 days (95% confidence interval = 32–57 days).

More than one-half of the patients (22/43, 51.2%) reported that they participated in catheter drainage procedures either alone or with the assistance of their caregiver or a nurse. Eleven patients reported that only a nurse performed drained procedures (11/43, 25.6%). All other patients had their catheter drained by either a nurse or caregiver, but did not participate themselves (10/43, 23.3%).
QoL and symptoms
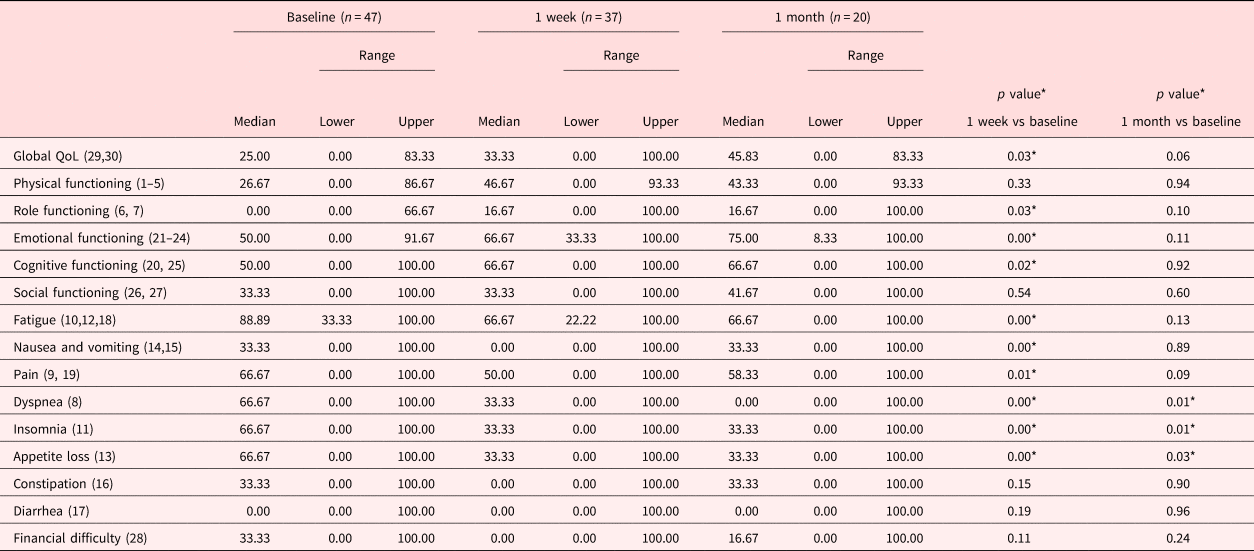
Analysis of EORTC demonstrated a significant improvement in global QoL, functional role, emotional, and cognitive scales at one week PP. At one week PP, significant symptom improvement was seen in reported fatigue, nausea/vomiting, pain, dyspnea, insomnia, and appetite loss. This improvement was sustained at three weeks for dyspnea, insomnia, and appetite. Baseline scores did not affect survival.
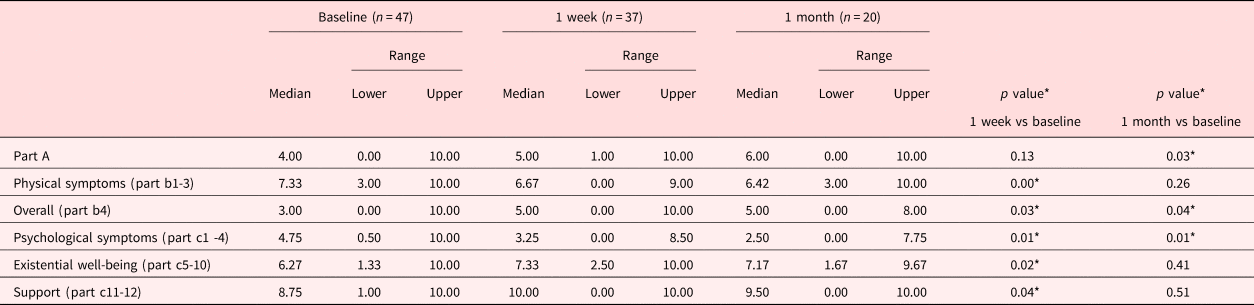
The MQoL results were similar, demonstrating a significant overall QoL improvement at 1 and 3 weeks. EORTC and MQoL data are provided in Tables 2 and 3.
EORTC results for each time point

*Statistically significant P ≤ 0.05.
McGill results for each time point

*Statistically significant P ≤ 0.05.
Complications
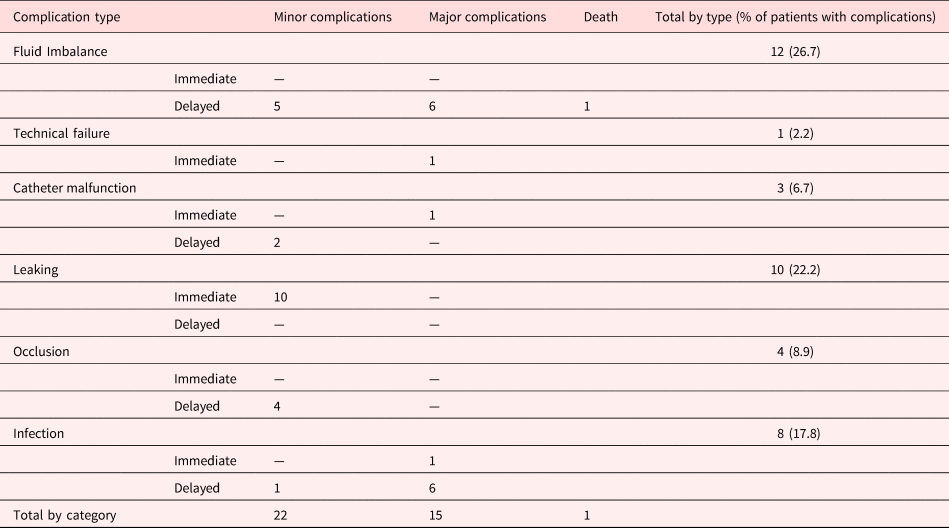
Complication data were compiled and are reported on the 45 patients who completed follow-up. These data include all complications that occurred for the entire duration of a catheter. Thirty-eight catheter-related complications occurred in 24 of 45 patients (53%). Twenty-two (58%) were minor (SIR grade A, B) and 16 (42%) were major (SIR grade C, D, E; Table 4).
Total complications by type and category

Complication classifications are per the Society of Interventional Radiology standards. Immediate complications are defined as <30 days. Fluid imbalance is defined as clinically evident hypotension, electrolyte abnormalities, and acute renal failure. Catheter malfunction is defined as catheter dislodgement or flow switch breakage that affected clinical management. Complications were evaluated for all patients who remained enrolled in the study (n = 45).
Eight infectious complications were directly attributed to the PTDC. One complication was classified as minor; seven were classified as major because patients were hospitalized or required catheter removal. Three patients had cellulitis that required admission to the hospital for antibiotic therapy (7%) and one patient with cellulitis was treated as an outpatient (2%) with oral antibiotics. An additional four patients had the catheter removed to treat cellulitis and/or peritonitis (4/45, 8.9%). One of these was removed within 30 days of placement (26 days); the other three were removed more than three months after placement (at 101, 170, and 282 days).
Two patients had fever that was not thought to be related to the PTDC; one patient was admitted for a fever of an unknown source and one patient was found to have an infection related to the venous access device six days after PTDC placement. Two patients (4%) had the PTDC removed when ascites resolved.
Twelve patients (28%) self-reported or had clinical evidence of fluid imbalance that was defined as clinically evident hypotension, electrolyte abnormality, or hospitalization for acute renal failure. Seven (16%) required hospital admissions for management. Two of these patients were treated for acute kidney injury assumed to be related to dehydration caused by the PTDC, one of which was progressive, ultimately resulting in death 37 days after PTDC placement.
Changes in laboratory values
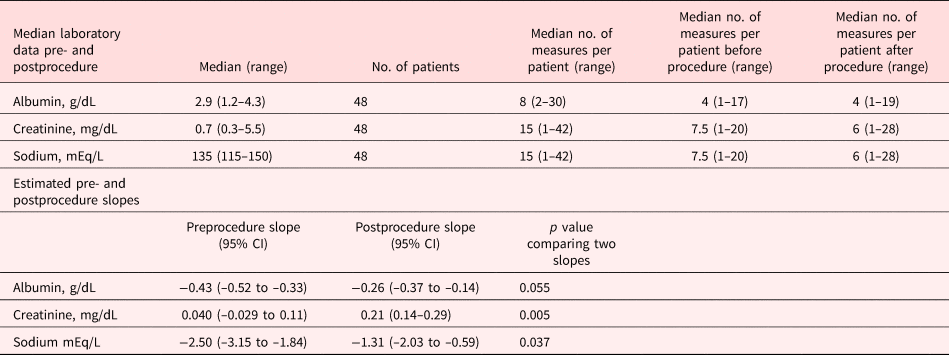
Serum albumin and sodium values declined both pre- and postprocedure; however, the slope of decline diminished for both serum albumin and serum sodium postprocedure compared with preprocedure (albumin slope [–0.43 to –0.26 g/dL, p = 0.055], sodium slope [–2.50 to 1.31 mEq/L, p = 0.037]). Creatinine values were increasing preprocedure and demonstrated a significantly accelerated increase postprocedure (0.040–0.21 mg/dL, p = 0.005; Table 5 and Figures 3–5.
Trend of albumin laboratory values 1.5 months pre- and postprocedure.

Trend of sodium laboratory values 1.5 months pre- and postprocedure.

Trend of creatinine laboratory values 1.5 months pre- and postprocedure.

Summary statistics of laboratory data within 1.5 months pre- and postprocedure with estimated pre- and postprocedure slopes based on regression models

Discussion
This study represents the largest, prospectively designed study in the literature reporting on QoL in patients undergoing palliative PTDC placement for relief of refractory ascites in patients with cancer. Although performance status declined initially after placement in these patients with advanced malignancy, PTDC placement was associated with a significant improvement in patient-reported QoL at one week postprocedure in both the EORTC and the MQoL. The global QoL scores continued to improve at one month; the change in MQoL scores achieved significance, whereas the change in EORTC global QoL scores did not (p = 0.06).
There are several options to manage refractory ascites in patients with end-stage malignancy. Peritoneovenous shunt (Denver Shunt, Becton, Dickinson and Company, Franklin Lakes, NJ) placement is the most invasive of these options, and placement typically requires hospitalization. Complications include disseminated intravascular coagulation, infection, thromboembolism, bleeding, and shunt occlusion, so placement is typically reserved for patients with a high-performance status or chylous ascites (Sangisetty & Miner, Reference Sangisetty and Miner2012; Stukan, Reference Stukan2017; Yarmohammadi et al., Reference Yarmohammadi, Brody and Erinjeri2016). PTDC placement can be performed on an outpatient basis. The most commonly used PTDCs are the Tenckhoff catheter (Tenckhoff Acute Peritoneal Dialysis Catheter, Cook Inc., Bloomington, IN), the Pleurx catheter (Pleurx Catheter, Becton, Dickinson and Company), and the Aspira catheter (Aspira Drainage System, Merit Medical, South Jordan, UT). To our knowledge, no single option has proven superior to any other (Becker et al., Reference Becker, Galandi and Blum2006; Stukan, Reference Stukan2017).
Few studies published to date have used the full versions of validated QoL and symptom questionnaires to assess QoL in patients with refractory ascites and end-stage malignancy after paracentesis or catheter placement (Coupe et al., Reference Coupe, Cox and Clark2013; Courtney et al., Reference Courtney, Nemcek AA and Rosenberg2008; Easson et al., Reference Easson, Bezjak and Ross2007; Husain et al., Reference Husain, Bezjak and Easson2010; Wong et al., Reference Wong, Cake and Kachuik2015). Although these studies reported improvement in ascites-related symptoms and improved QoL after drainage, most studies only assessed QoL within 24 hours of drainage or had very small sample sizes. Courtney et al. (Reference Courtney, Nemcek AA and Rosenberg2008) noted improved QoL one week postplacement of a PTDC for malignant ascites (MA), but this improvement was not sustained at the 12-week assessment point. Wong et al. (Reference Wong, Cake and Kachuik2015) saw a significant improvement in QoL for 13 patients with MA between baseline assessment and within 12 weeks of placement.
Symptoms
Catheter placement was associated with symptom relief, which has been shown in other studies that report symptom improvement with fluid removal, regardless of intervention type (Caldwell et al., Reference Caldwell, Edriss and Nugent2018; Coupe et al., Reference Coupe, Cox and Clark2013; Courtney et al., Reference Courtney, Nemcek AA and Rosenberg2008; Easson et al., Reference Easson, Bezjak and Ross2007; Wong et al., Reference Wong, Cake and Kachuik2015). Although paracentesis patients experience immediate and significant symptom improvement, a major limitation of paracentesis procedures is the transient nature of improvement resulting from reaccumulation of ascites. This study demonstrated a significant and durable improvement in symptoms of dyspnea, insomnia, and appetite loss. Improvement in fatigue, nausea/vomiting, and pain relief were not sustained in these patients, which may be attributed to the end-stage, progressive nature of the disease.
The improvement in QoL and symptom profiles occurred despite the impact from the inevitable progression of disease. Median survival was 38 days, with only 16% patients completing the six-month assessment. This is in line with other reports of median survival of 24 to 50 days after PTDC placement (Caldwell et al., Reference Caldwell, Edriss and Nugent2018; Courtney et al., Reference Courtney, Nemcek AA and Rosenberg2008; Hicks et al., Reference Hicks, Chou and Capanu2016; Qu et al., Reference Qu, Xing and Ghodadra2016).
The patient-reported outcomes of improved QoL and symptom relief after PTDC were observed despite the relatively high complication rates after PTDC placement. The complication rate in this study is similar to other prospective studies on PTDCs and peritoneal ports (Coupe et al., Reference Coupe, Cox and Clark2013; Courtney et al., Reference Courtney, Nemcek AA and Rosenberg2008;). Studies that reported lower complications after PTDC placement (7–31%) were retrospective in nature (Hicks et al., Reference Hicks, Chou and Capanu2016; Lungren et al., Reference Lungren, Kim and Stewart2013; Qu et al., Reference Qu, Xing and Ghodadra2016; Solbach et al., Reference Solbach, Höner Zu Siederdissen and Taubert2017; Tapping et al., Reference Tapping, Ling and Razack2012). This is one of the inherent limitations of retrospective studies and supports the need for prospective methodology to accurately evaluate complications. Contemporary patient reporting in conjunction with chart review is essential to ensure all events are captured and accurately reported.
Fluid and electrolyte imbalance occurred in approximately one-quarter of the patients. Of the 16% who required related hospitalization, two developed acute kidney injuries, with one fatality. The effect of fluid shifts after PTDC placement in prior studies is unclear. Declines in serum albumin and protein have been shown to affect survival in patients with MA (Ayantunde & Parsons, Reference Ayantunde and Parsons2007). Courtney (Reference Courtney, Nemcek AA and Rosenberg2008) evaluated blood chemistry levels pre- and post-PTDC placement and did not find a significant change, only a decline in serum sodium at 12 weeks that neared significance (p = 0.09), but there were no clinical symptoms beyond dizziness in 15% (5/34) of the subjects. In one study of 24 patients with MA and implanted peritoneal ports, patients drained an average of 4,200 mL three times per week, with associated decrease in serum albumin in 71%, hyponatremia in 24%, and hypotension in 4% (Coupe et al., Reference Coupe, Cox and Clark2013). Other studies did not note a change in electrolytes or fluid imbalance as a significant concern (Hicks et al., Reference Hicks, Chou and Capanu2016; Lungren et al., Reference Lungren, Kim and Stewart2013; Solbach et al., Reference Solbach, Höner Zu Siederdissen and Taubert2017).
To our knowledge, this study is the first to trend the electrolyte values both before and after PTDC placement, expressed as a slope to quantify the effect of the PTDC. The findings of our study did not show an acceleration of deterioration of clinical laboratory values other than creatinine. In fact, the downward slope of serum sodium and albumin ongoing before placement significantly flattened after placement of the PTDC. The slope of creatinine rise increased, consistent with general organ failure seen at the end of life.
This study did not specifically explore the effect of variables such as drainage volume and frequency, and it is possible that these factors could be associated with symptomatic fluid shifts and electrolyte imbalances. Until this relationship is better understood, patient education regarding fluid drainage needs to be carefully considered. In general, patients in our study were told not to drain more than 1,000 mL per day.
The infection rate after PTDC may be due to the length of follow-up. Infection rates of 1% to 23% for PTDC placements for refractory ascites have been reported, with most studies following patients for approximately 12 weeks or until death (Bohn & Ray, Reference Bohn and Ray2015; Caldwell et al., Reference Caldwell, Edriss and Nugent2018; Coupe et al., Reference Coupe, Cox and Clark2013; Courtney et al., Reference Courtney, Nemcek AA and Rosenberg2008; Hicks et al., Reference Hicks, Chou and Capanu2016). The rate of infectious complications in this study was noteworthy for the incidence of infections occurring after three months. Caldwell et al. (Reference Caldwell, Edriss and Nugent2018) also noted in their report of patients with PDTC that infection risk increased significantly after 12 weeks. Although 18% of patients in our study had infectious complications, most could be managed with antibiotics alone. Only one patient had an infection requiring catheter removal within the first three months. The other three patients who required catheter removal because of infection did so more than three months after placement.
This study is limited by a small sample size and high mortality. The significance of the results for later time points may have been affected by the diminishing number of respondents and the confounding effects of disease progression. Future studies are needed to define populations that are best served by the different interventions available; for example, study randomizing patients to PTDC or peritoneovenous shunt placement. Another study to determine appropriate drainage volume, frequency, and instructions to minimize fluid imbalance and electrolyte complications would be beneficial for patients undergoing PTDC placements.
In conclusion, this prospective study shows an improvement in QoL after placement of PTDC in patients with advanced malignancy and refractory ascites.
Author ORCIDs
Piera Cote Robson, 0000-0001-7185-7915
Acknowledgments
This work was funded by a grant from the Society of Memorial Sloan Kettering Cancer Center; its support is gratefully acknowledged. This research also was funded in part through the National Institutes of Health/National Cancer Institute Cancer Center Support Grant P30 CA008748.
This paper is dedicated to Nancy Kline, Ph.D., R.N., who served as mentor and co-principal investigator for this work until her death from ovarian cancer. Nancy embraced her mentorship role guiding the primary author on grant writing, protocol development, study execution, and data analysis.