I. INTRODUCTION
With the help of lightweight design, bionic design and topological optimization design, porous structure components have obtained a successful development and started to achieve certain applications in aerospace, automobile, and biomedical field, in view of their superior mechanical properties and special physical properties. Reference Čapek, Machová, Fousová, Kubásek, Vojtěch, Fojt, Jablonská, Lipov and Ruml1–Reference Wang, Yang, Liu, Xiao and Sun6 However, suffering from serious limitation of the traditional manufacturing technology, the structure design of porous structure components must be performed in consideration of current manufacturing challenges. Selective laser melting (SLM) technology, as a typical one of laser additive manufacturing technology, due to its freeform fabrication principle which overcomes current manufacturing challenges, has achieved a great attention. Reference Simonelli, Tse and Tuck7–Reference Ma, Gu, Dai, Chen, Chang, Yuan and Shen9 Consequently, SLM can efficiently meet the urgent demanding of high-performance porous structure component.
A mass of porous structure components prepared by SLM have been reported. Gu et al. Reference Gu10 successfully prepared “lobster eyes” structure with pores of 0.2 × 0.2 mm2 by SLM based on the bionic design, aiming at the application of radiation protection. Maskery et al. Reference Maskery, Aboulkhair, Aremu, Tuck, Ashcroft, Wildman and Hague11 applied SLM technology to produce graded density Al–Si10–Mg lattice structures and meanwhile evaluated the relationship between lattice geometry and mechanical property. This graded lattice structure could absorb more energy with around 7% lower strain before densification, comparing with the uniform lattice structure. Haberland et al. Reference Haberland, Elahinia, Walker, Meier and Frenzel12 investigated the influence of the additive manufacturing (AM) process on structural and functional properties of additively manufactured NiTi. Besides, he showed us the novel application examples of AM-NiTi structures with highly complex geometries. However, during SLM processing of the above functional porous structures, a large number of nodes formed by crossed scanning tracks when a two-dimensional profile for the porous structure are processed, nearby where pores and cracks are prone to occur under unoptimizable laser processing parameters. Liu et al. Reference Liu, Li, Wang, Hou, Hao, Yang, Sercombe and Zhang13 compared the defects and mechanical behavior of titanium porous structures manufactured by SLM and electron beam melting (EBM). By the micro-CT method, some larger pores could be observed in the margin position of the nodes. Gorny et al. Reference Gorny, Niendorf, Lackmann, Thoene, Troester and Maier14 found that many of struts were fully separated from the truss structure after mechanical load and failure initiated at pores located close to a node. Also, the corresponding linear elastic three-dimensional finite element calculation indicated that the highest stresses and strains present at the nodes possessing the largest distance from the center of the cube.
On the other hand, one continuing trend in the manufacturing of functional porous structures is microminiaturization, the effort to serve the development of intelligent devices. Reference Ostendorf, Neumeister, Dudziak, Passinger and Stampfl15 In this case, the dimension of struts and nodes can reach sub-micrometer scale, which means that these nodes are processed by single scanning of laser beam with smaller spot diameter. As a result, the tendency of defect formation increases due to the lack of remelting effect, thus forming a greater challenge for achieving a tailored mechanical property. As the most basic and crucial structure element, good processing quality of the node plays an important role in the improvement of mechanical property of porous structure components. Note that, the corresponding investigations on the node are still in lack at present. In this paper, the easiest kind of node formed by two crossed scanning tracks was studied. The thermal behavior during the SLM processing of the nodes was analyzed by finite element method, to give more insight into defect formation mechanism nearby nodes.
II. EXPERIMENTAL AND MODELING METHODS
A. Powder material, processing and characterization
The as-used raw material in this study was spherical Ti6Al4V powder with a mean particle size of 25 µm. Subsequently, the SLM processing was performed by the SLM-150 equipment developed by Nanjing University of Aeronautics and Astronautics (Nanjing, China). The SLM system consisted of a YLR-500-WC ytterbium fiber laser with a power of ∼500 W and a spot size of 70 μm (IPG Laser GmbH, Burbach, Germany), an automatic powder spreading device with flexible scraper blade, an inert argon gas circulatory protection system, and a computer system for process control. By SLM processing, a micro-scale node-structure was fabricated under different laser scan speed. To make the description in part 3 easier to be followed, different names were set for as-fabricated tracks, namely “track 1” and “track 2”, where “track 1” was the firstly fabricated track for node structure and “track 2” was the second fabricated track. Hence, the processing sequence in turn was “track 1” and “track 2”. In this study, the laser power was set as 100 W, and the scan speed varied from 100 mm/s to 300 mm/s. Besides, the powder layer thickness of 30 μm and a simple linear raster scan pattern was used.
Specimen for metallographic examinations were prepared by the standard polishing procedures and then etched with a solution containing HF, HNO3, and distilled water with a volume ratio of 2:1:14 for 3 s. A Zeiss Sigma 04–95 field emission scanning electron microscope (FESEM; Carl Zeiss AG, Oberkochen, Germany) equipped with a Bruker XFlash 6160 energy dispersive X-ray spectroscope (EDS; Bruker Daltonics Inc., Billerica, Massachusetts) was applied to perform high-resolution study of the microstructural features of SLM-processed specimens and the corresponding chemical compositions.
B. Modeling method
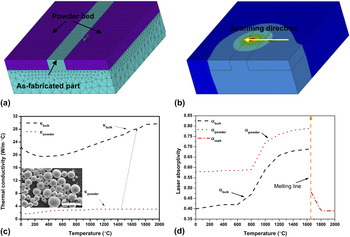
To further gain better insight into the differentiated interaction behavior of the melt, as-fabricated part and powder material located nearby the node formed by two crossed scanning tracks during SLM process, a multi-phase physical model based on three-dimensional finite volume element method was established, as shown in Fig. 2. The blue part was set as as-fabricated part and the purple part was set as powder bed. Ti-based alloy powder bed was divided into two parts, either one of which was with a length of 0.6 mm and a width of 0.25 mm. As-fabricated part was a block of Ti-based alloy with dimensions of 0.6 × 0.1 × 0.06 mm to improve the calculation efficiency and computational precision, 70 solid hexahedral elements with a fine mesh of 0.01 × 0.01 × 0.01 mm were applied to represent the powder bed and as-fabricated part. Specially, the otherness in thermal physical properties for as-fabricated part and powder bed was considered in this model. Due to the existence of large numbers of porosities, effective absorptivity of powder bed gets remarkable improvement and meanwhile thermal conductivity of powder bed suffers a conspicuous decreasing. Here, effective absorptivity of powder bed can be estimated based on Eqs. (1)–(3) Reference Promoppatum, Onler and Yao16 :
 $${\varepsilon _{{\rm{eff}}}} = {A_{\rm{H}}}{\varepsilon _{\rm{H}}} + \left( {1 - {A_{\rm{H}}}} \right){\varepsilon _{\rm{S}}}\quad ,$$
 $${A_{\rm{H}}} = {{0.908{\varphi ^2}} \over {1.908{\varphi ^2} - 2\varphi + 1}}\quad ,$$
 $${\varepsilon _{\rm{H}}} = {{{\varepsilon _{\rm{S}}}\left[ {2 + 3.082{{\left( {{{1 - \varphi } \over \varphi }} \right)}^2}} \right]} \over {{\varepsilon _{\rm{S}}}\left[ {1 + 3.082{{\left( {{{1 - \varphi } \over \varphi }} \right)}^2}} \right] + 1}}\quad ,$$
where A H is surface area of pore, φ is pore fraction, εH, εS, εeff respectively refers to emissivity of pore, solid and powder. The corresponding absorptivity of solid and powder of Ti6Al4V as a function of temperature has been given in Promoppatum’s work and the absorptivity of solid is lower than that of powder. Reference Liu, Li, Wang, Hou, Hao, Yang, Sercombe and Zhang13 Besides, based on the nature of SLM processing, the effective thermal conductivity of powder bed is closely relative to thermal conductivity κr of powder material, thermal conductivity κf of the melt, thermal conductivity κs of the solid and the packing density α in the powder bed, can be expressed as follows Reference Dai and Shaw17 :
 $${\kappa \over {{\kappa _{\rm{f}}}}} = \;\left( {1 - \sqrt \alpha } \right)\left( {1 + {{(1 - \alpha ){\kappa _{\rm{r}}}} \over {{\kappa _{\rm{f}}}}}} \right) + \sqrt \alpha \left[ {{2 \over {1 - {{{\kappa _{\rm{f}}}} \over {{\kappa _{\rm{s}}}}}}}\left( {{1 \over {1 - {{{\kappa _{\rm{f}}}} \over {{\kappa _{\rm{s}}}}}}}\ln \left( {{{{\kappa _{\rm{s}}}} \over {{\kappa _{\rm{f}}}}}} \right) - 1} \right) + {{{\kappa _{\rm{r}}}} \over {{\kappa _{\rm{f}}}}}} \right]\quad ,$$
where
 ${\kappa _{\rm{r}}} = 4B\sigma {}_{\rm{e}}T_\rho ^3{D_\rho }$
, D
ρ and T
ρ are respectively the average diameter and operating temperature of as-used powder particles, B is a view factor, approximately identified as 0.33. It should be noted that the effective thermal conductivity and laser absorptivity of powder/bulk have been depicted according to the above equations, as shown in Figs. 1(a) and 1(b). Then, the involving governing equations in this model have been described in Li Yali et al.’s work,
Reference Li and Gu18
not tired in words here.
(a) Three-dimensional finite element model and (b) the temperature field distribution. Blue region, was set as as-fabricated part (namely the solid), and purple region was behalf of the powder bed. (c) and (d) The thermal conductivity and laser absorptivity of Ti6Al4V bulk and Ti6Al4V powder as a function of the temperature.

III. RESULTS AND DISCUSSION
A. Temperature distribution and molten pool size
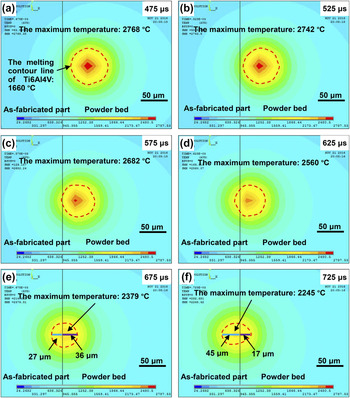
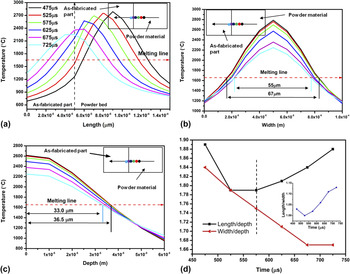
Figure 2 gives the transient temperature distribution on the top surface of node structure at different laser irradiation moment during SLM for a fixed laser power of 100 W and scan speed of 100 mm/s. The contour of molten pool was determined according to the melting point of Ti6Al4V (1660 °C), as the red dashed line showed in Fig. 2. As the laser beam moved over the powder bed along the direction perpendicular to the as-fabricated part, the maximum temperature of molten pool started to decrease slightly and then declined quickly when the boundary of molten pool touched the as-fabricated part. Meanwhile, the dimension of molten pool experienced a successive decrease during this period, as shown in Figs. 3(a), 3(b), and 3(c). At t = 475 μs, the predicted maximum temperature of powder bed was 2768 °C, going far beyond the melting point of Ti6Al4V, thus leading to a relatively large size of molten pool with the length of 69 μm, the width of 67 μm, and the depth of 36.6 μm. The laser beam center stopped the interface between as-fabricated part and powder bed at t = 675 μs, the maximum temperature of powder bed significantly decreased to 2379 °C, consequently giving a rise to a shrunk molten pool. Noted that, the position corresponding to the maximum temperature was on the right side of the interface and just only approximately 2/5 part of molten pool located at the as-fabricated part. Also, the predicted maximum temperature lying in the as-fabricated part reached 2357 °C, lower than that lying in the powder bed. At t = 725 μs, the center of laser beam excursed to 10 μm from the powder side, the predicted maximum temperature emerged on the as-fabricated side, further decreasing to 2245 °C, and the length ratio of molten pool on these two sides reached nearly 3. Figure 3 shows the detailed evolution features of length, width, and depth of molten pool during the formation of node structure. Specially, a tendency could be found that the magnitude of length decreasing or depth decreasing was lower than that of width decreasing as the laser beam moved from powder side to as-fabricated side, which meant that the geometric configuration of molten pool became narrow. The volume of molten pool can be estimated by Ref Reference Fu and Guo19:
 $$V = {{\pi DLW} \over 6}\quad ,$$
where D is the depth of molten pool, L is the length of molten pool, and W is the width of the molten pool, respectively. Hence, compared with the volume of molten pool as laser beam moved over the powder bed, the shrinkage rate of V reached 27.22% when laser beam stopped at the interface, showing the apparent “necking” phenomenon.
Temperature distributions at every transit time: (a) t = 475 μs; (b) t = 525 μs; (c) t = 575 μs; (d) t = 625 μs; (e) t = 675 μs; (f) t = 725 μs during SLM processing with the laser power of 100 W and laser scan speed of 100 mm/s, as the laser beam moved from the powder side to the as-fabricated side.

Temperature profile along (a) the length direction, (b) the width direction, and (c) the depth direction of molten pool at the fixed P of 100 W and v of 100 mm/s. (d) The length/depth ratio, width/depth ratio and length/width ratio of molten pool.

From Fig. 1, the efficient thermal conductivity of powder bed is far lower than that of as-fabricated part when the temperature is below the melting point of Ti6Al4V, which is responsible for the shrunk molten pool as the laser beam moves toward the as-fabricated side. Besides, the lower laser absorptivity of as-fabricated part was also believed to contribute the “necking” effect nearby the node. Before the boundary of molten pool touches the interface between as-fabricated part and powder bed, the width/depth ratio and length/depth ratio successively decreases, which can be attributed to the cap-shaped molten pool that achieved a lesser effect on the contour line of molten pool along the depth direction, comparing with that along the length or width direction. However, as the laser beam further moves, the width/depth ratio continuously decreases but the length/depth ratio turns to go up, in which case length/width ratio continuously increases. Due to that laser beam moves along the length direction, heat transfer along the width direction of molten pool is enhanced in two sides, while heat transfer along the length direction is just intensified in the fusing front. As a result, the shrinkage of molten pool along width direction is larger than that along length direction, accounting for the increasing length/width ratio.
B. Temperature gradient
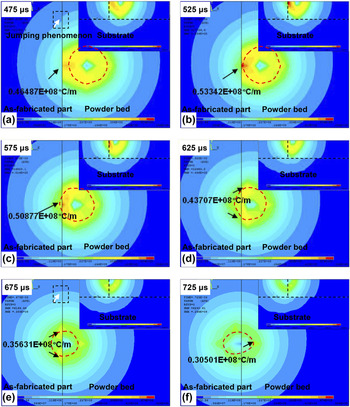
To better understand the thermal behavior during SLM processing of node structure, the distribution of temperature gradient at different laser beam traveling time is displayed in Fig. 4. When the laser beam moved over powder bed, the maximum temperature gradient G max emerged at the advancing side of molten pool, reaching 4.65 × 10⁷ °C/m. As the center of laser beam migrated close to the interface (such as t = 525 μs or t = 575 μs), the G max appeared at the interface. Afterward, the position of the G max was transferred to the intersected location of the interface and the contour line of molten pool (such as t = 625 μs or t = 675 μs), and then to the solidified side of molten pool (such as t = 725 μs), with the center of laser beam running through the as-fabricated side. Besides, the value of the G max experienced a first increase and then decrease change, namely firstly increasing to the maximum value of 5.33 × 10⁷ °C/m when the advancing side of molten pool touched the interface, and then continuously decreased to 3.05 × 10⁷ °C/m at t = 725 μs. Specially, on the top surface, the temperature gradient underwent a jumping at the interface between as-fabricated part and powder bed before the center of laser beam arrived at the interface. The above jumping phenomenon disappeared when the laser beam traveling time t ≥ 675 μs.
Two-dimensional top-surface and cross-section profile of temperature gradient at every transit time: (a) t = 475 μs; (b) t = 525 μs; (c) t = 575 μs; (d) t = 625 μs; (e) t = 675 μs; (f) t = 725 μs during SLM processing (P = 100 W and v = 100 mm/s), as the laser beam moved from the powder side to the as-fabricated side.

During the early stage of the laser beam traveling, the laser just interacts with powder material and heat transfer is significantly restricted at the advancing side of molten pool due to low thermal conductivity, while the heat is transferred smoothly at the solidified side of molten pool due to heat accumulation effect, leading to the G max emerging on the advancing side of molten pool. As the boundary of molten pool crosses over the interface, heat accumulated at the advancing side is dissipated quickly in consideration of high thermal conductivity and low laser absorptivity of as-fabricated part, thus giving a rise to the lagged position of the G max appearing in the interface. Subsequently, the position of the G max is transferred to the angle position of the “+”-shaped crossing, which directly contacts the powder side with low thermal conductivity. Upon the center of laser beam entering into the as-fabricated part, thermal retardation at the angle position gets partly relieved due to heat accumulation effect and consequently the G max is further transferred to the lower part in the solidified front of molten pool.
C. Effect of laser scan speed on thermal behavior at the node
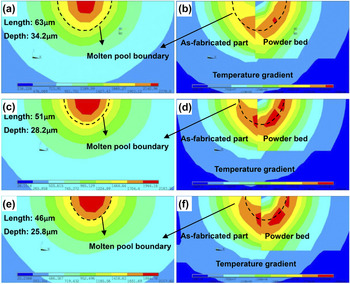
Figure 5 shows the influence of laser scan speed v on temperature distribution and the dimension of molten pool during SLM processing of Ti6Al4V-based node structure, as the center of laser beam moved to the interface (t = 675 μs). Under all applied v, the position of the maximum temperature T m was predicted at the powder side. With the v increasing from 100 mm/s to 200 mm/s, both the T m and the characteristic dimension (including the length and depth) of molten pool occurred to decrease conspicuously. However, the decreasing tendency became weak when the v increased from 200 mm/s to 300 mm/s. Moreover, according to Eq. (5), the volume shrinkage ratio reached 47.44% and 54.16%, respectively corresponding to 200 mm/s and 300 mm/s, remarkably higher than 27.22% for 100 mm/s. Furthermore, Fig. 5 demonstrates the temperature gradient distribution of cross section within the molten pool at various laser scan speed (t = 675 μs). To identify the corresponding position relation between the temperature gradient distribution and molten pool, the contour line of molten pool was marked, as the black dashed line showed. Obviously, the volume of molten pool located in the powder side was larger than that in the as-fabricated side. Besides, the G max mainly emerged in the solidified side of molten pool as well as the interface between powder bed and as-fabricated part, which was barely influenced by v and showed a steady value of approximately 3.56 × 10⁷ °C/m. Note that, nearby the center of molten pool, the temperature gradient at the left side of the interface was obviously larger than that at the right side of the interface. As the applied v increased from 100 mm/s to 300 mm/s, the area of the red region (corresponding to the G max) got rapidly enlarged and then occurred to decrease slightly.
Two-dimensional cross-section profile of temperature and its gradient at various v: (a) and (b) v = 100 mm/s; (c) and (d) v = 200 mm/s; (e) and (f) v = 300 mm/s, as the laser beam moved over the interface between powder bed and the as-fabricated part.

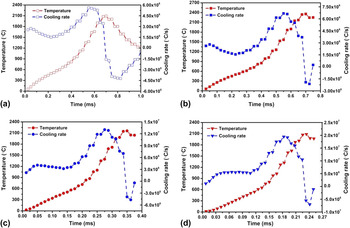
Specially, when the center of laser beam fell on the interface (t = 675 μs), two different points at the interface (namely point 1 located at the lower part of molten pool and point 2 located on the top surface of molten pool) were chosen, to predict the temperature and cooling rate variation at the interface with laser beam traveling time. Figures 6(a) and 6(b) respectively show the temperature and cooling rate variation of point 2 and point 1 under the laser scan speed v of 100 mm/s. Not hard to be seen, the maximum cooling rate of point 1 was approximately 4.50 × 10⁶ °C/s, nearly twice of that of point 2. With the v increasing from 100 mm/s to 300 mm/s, the predicted maximum temperature of point 2 continuously decreased and the maximum cooling rate of point 2 increased from 2.2 × 10⁶ °C/s to 7.5 × 10⁶ °C/s.
The change of temperature and the corresponding cooling rate of point 1 (a) and point 2 (b–d) with the laser scanning time. (b) 100 mm/s; (c) 200 mm/s; (d) 300 mm/s.

D. Experimental verification
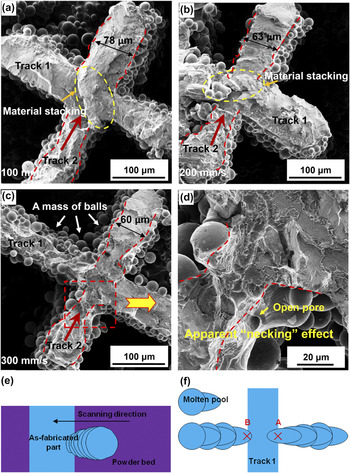
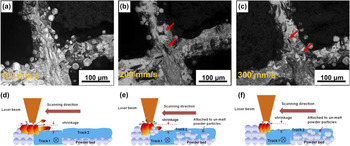
Figure 7 demonstrates the FE-SEM micrographs of micro-scale node structure processed by SLM of two crossed scanning tracks at various laser scan speed v. It was obvious that laser scan speed had a significant effect on the morphology of node structure. As a relatively lower v of 100 mm/s was applied, the processed tracks showed a relatively smooth surface morphology with a near-uniform track width. Apparent material stack could be observed at the node position, overlaying the previously fabricated track. Besides, a little “necking” effect emerged before the “track 2” ran through “track 1”. On the v increasing to 200 mm/s, there was still a small amount of material stack found at the intersection region of “track 2” and “track 1”, showing insufficient liquid formation. And then “necking” effect was observed clearly before and after the “track 2” ran through “track 1”. At the higher v of 300 mm/s, a tight and rugged scanning track was obtained, with the rougher and more irregular surface morphology, the two sides of which were attached to large numbers of un-melt powder particles. Similarly, the “necking” phenomenon was also observed at the two interfaces and meanwhile some open pores were found at the “necking” position [Fig. 7(d)]. Moreover, the characteristic width of molten pool was successively decreased from 78 μm to 60 μm, as the v increased from 100 mm/s to 300 mm/s, which showed deviation to some extent in comparison with the simulation results. However, the fluctuation trend was consistent. Figure 8 further displays the densification characteristics of SLM-processed micro-scale node-structure. When the applied v was only 100 mm/s, the node region was nearly free of any pores and cracks, showing good densification behavior [Fig. 8(a)]. As the v increased to 200 mm/s or 300 mm/s, some agminated pores formed nearby the node [Figs. 8(b) and 8(c)], consequently deteriorating the mechanical properties during loading.
The typical surface morphology of SLM-processed micro-scale node structure under various laser scan speed v (P = 100 W): (a) v = 100 mm/s; (b) v = 200 mm/s; (c) v = 300 mm/s. (d) The local high-magnification FE-SEM micrograph of (c), showing the apparent “necking” effect. (e) The contour of laser scanning track based on the simulation results in Fig. 2 and (f) the schematic of elongated molten pool.

The etched surface morphology of SLM-processed micro-scale node structure under various laser scan speed v (P = 100 W): (a) v = 100 mm/s; (b) v = 200 mm/s; (c) v = 300 mm/s. The schematic of hysteretic “necking” effect and liquid spreading at different laser scan speed v: (d) v = 100 mm/s; (e) v = 200 mm/s; (f) v = 300 mm/s.

As shown in Fig. 7(e), the contour boundary line of a scanning track is obtained by overlaying the contour lines of molten pool as laser beam moves from powder side to as-fabricated side, showing an apparent “necking” phenomenon. It should be pointed out that the experiment results were basically consistent with the previous simulation results. Considering the difference in thermal conductivity of as-fabricated part and powder bed (κs > κ), the dimension of moving molten pool reduces at the interface of node due to the faster heat transfer in the as-fabricated side, thus resulting in the subsequent “necking” effect. Note that, more apparent “necking” effect always occurs before the “track 2” ran through “track 1”, not after the “track 2” ran through “track 1”, in the experiment. Some convincing interpretations may be given, as shown in Fig. 7(f). On the right side of node, heat transfer within molten pool is influenced by “track 1” and the solidified part of “track 2”, leading to an elongated molten pool and attendant subdued “necking” effect in “A” point. While heat transfer within molten pool is only disturbed by the solidified front after the “track 2” ran through “track 1”.
Figures 8(d)–8(f) depicts the schematic of the influence of scan speed on “necking” effect. Taking into account of the existence of relatively high porosity in powder bed as well as heat expansion and cold shrinkage effect of metal materials, the previous as-fabricated track (corresponding to “track 1”) experiences a significant shrinkage, especially under the higher laser energy input. Reference Zhang, Cai, Liu and Li20 As the laser beam moves to point “B” along the direction of “track 2”, a molten pool at high altitude forms due to the shrinkage of “track 1”. Based on the temperature gradient distribution in simulation results of Fig. 4, temperature gradient located at the right side of point “B” is larger than that located at the left side of point “B”, leading to the formation of an unsteady Marangoni flow. According to the below Eq. (6), Reference Kruth, Levy, Klocke and Childs21 the dimensionless Marangoni number M a which is used to evaluate the intensity of Marongion flow within molten pool can be calculated:
 $${M_{\rm{a}}} = {{\left( {\left[ {{{{\rm{d}}\gamma } \over {{\rm{d}}x}}} \right]\left[ {{w \over \eta }} \right]} \right)} \mathord{\left/ {\vphantom {{\left( {\left[ {{{{\rm{d}}\gamma } \over {{\rm{d}}x}}} \right]\left[ {{w \over \eta }} \right]} \right)} {\left( {{\kappa \over w}} \right)}}} \right. \kern-\nulldelimiterspace} {\left( {{\kappa \over w}} \right)}} \equiv \left( {\left[ {{{{\rm{d}}\gamma } \over {{\rm{d}}T}}} \right]\left[ {{{{\rm{d}}T} \over {{\rm{d}}x}}} \right]} \right)\left( {{{{w^2}} \over {\eta \kappa }}} \right)\quad ,$$
where w is the linear size of the molten pool, κ is its thermal diffusivity, η is the dynamic viscosity of the melt, and dγ/dx is the surface tension gradient. At the relatively lower v, Marangoni flow within molten pool gets significantly enhanced due to the larger molten pool size, inducing the severe perturbation on the surface of the melt. As a result, the upheaval of the melt and attendant material stacking follow to occur, therefore leading to nearly invisible “necking” phenomenon on the two sides of node [Fig. 8(d)]. On laser scan speed v increasing to 200 mm/s, Marangoni flow within molten pool is declined in view of the decrease of molten pool size. However, there is still a little mass of melt to spread on the shrunk surface of “track 1”. As the applied v further increases to 300 mm/s, insufficient liquid formation does not provide enough driving force against viscous drags to guarantee the efficient spreading of melt, thus giving a rise to the continuous decreasing of molten pool size and a resultant weak Marangoni flow within molten pool. Combined with the faster cooling rate induced by high scan speed, no material stacking occurs and meanwhile “necking” effect becomes more apparent. Besides, the higher cooling rate in the lower part of molten pool than that in the upper part of molten pool also further results in the formation of pores in “necking” position.
IV. CONCLUSIONS
In this paper, SLM was applied to prepare the easiest kind of node formed by two crossed scanning tracks. The corresponding thermal behavior during the SLM processing of the node was analyzed by finite element method. Some important conclusions were drawn as follows:
-
(1) The forming process of “necking” effect occurred nearby the node was revealed, which was mainly attributed to the difference in thermal conductivity and laser absorptivity of as-fabricated part and powder bed. Besides, as the applied scan speed increased, “necking” effect became more apparent.
-
(2) The position of the G max experienced a successive migration from the fusing front to the interface (between as-fabricated part and powder bed), and then to the lower part in the solidified front, as the laser beam moved from the powder side to as-fabricated side. The value of the G max was barely influence by laser scan speed.
-
(3) When the center of laser beam moved to the interface, the maximum temperature emerged in the powder side and the temperature gradient in the as-fabricated side was larger than that in the powder side nearby the center of molten pool.
-
(4) Marangoni flow was sensitive to molten pool size influenced by laser scan speed. The lower laser scan speed could result in severe perturbation on the surface of the melt and subsequently the formation of material stacking.
ACKNOWLEDGMENTS
The authors gratefully acknowledge the financial support from the National Natural Science Foundation of China (Nos. 51575267), the National Key Research and Development Program “Additive Manufacturing and Laser Manufacturing” (No. 2016YFB1100101), the NSFC-DFG Sino-German Research Project (No. GZ 1217), the Key Research and Development Program of Jiangsu Provincial Department of Science and Technology of China (No. BE2016181), the Aeronautical Science Foundation of China (No. 2015ZE52051), the Top-Notch Young Talents Program of China, and the Priority Academic Program Development of Jiangsu Higher Education Institutions.