INTRODUCTION
The nature of the relationship between humans and climate is a core issue in geographical research and the increased availability of paleoclimatic, paleoecological, and archaeological data have resulted in the proliferation of studies on this complex relationship (deMenocal, Reference deMenocal2001; Wu and Liu, Reference Wu and Liu2004; An et al., Reference An, Tang, Barton and Chen2005; Kuper and Kröpelin, Reference Kuper and Kröpelin2006; Barton et al., Reference Barton, Brantingham and Ji2007; Munoz et al., Reference Munoz, Gajewski and Peros2010; Maher et al., Reference Maher, Banning and Chazan2011; McMichael, Reference McMichael2012; Rosen and Rivera-Collazo, Reference Rosen and Rivera-Collazo2012; Dong et al., Reference Dong, Wang, Cui, Elston and Chen2013; Xie et al., Reference Xie, Evershed, Huang, Zhu, Pancost, Meyers and Gu2013; Foerster et al., Reference Foerster, Vogelsang, Junginger, Asrat, Lamb, Schaebitz and Trauth2015; Büntgen et al., Reference Büntgen, Myglan, Ljungqvist, McCormick, Di Cosmo, Sigl and Jungclaus2016; Hughes et al., Reference Hughes, Sullivan and Hiscock2017). Climate change is often argued to be a primary force influencing human activities (Jin and Liu, Reference Jin and Liu2002; Zhang et al., Reference Zhang, Cheng, Edwards, Chen, Wang, Yang and Liu2008; Hill et al. Reference Hill, Barton and Hurtado2009; Anderson et al., Reference Anderson, Goodyear, Kennett and West2011; Ziegler et al., Reference Ziegler, Simon, Hall, Barker, Stringer and Zahn2013). The Western Loess Plateau (WLP) lies to the west of the Liupan Mountains in North China (Fig. 1B). Previous studies show that stone tools, subsistence, and settlements correlate with the climate from 80 to 18 ka, leading scholars to hypothesize that a wet-warm Marine Oxygen Isotope Stage (MIS) 3 provided abundant and predictable resources that supported relatively large WLP hunter-gatherer populations (Morgan et al., Reference Morgan, Barton, Bettinger, Chen and Zhang2011). Climate change influenced humans by affecting biomass and food production (Zhang et al., Reference Zhang, Lee, Wang, Li, Pei, Zhang and An2011a; Tallavaara and Seppä, Reference Tallavaara and Seppä2012), but the data are not robust enough to support this hypothesis (Louderback et al., Reference Louderback, Grayson and Llobera2011; Kelly et al., Reference Kelly, Surovell, Shuman and Smith2013; Wang et al., Reference Wang, Lu, Zhang, Gu and He2014; Maier et al., Reference Maier, Lehmkuhl, Ludwig, Melles, Schmidt, Shao and Zimmermann2016). Moreover, studies that convincingly link Paleolithic human activities to climate change are especially rare in China. To better understand how climate change influences human activities on the WLP, it is necessary to explore the ecological processes and dynamics of climate change.
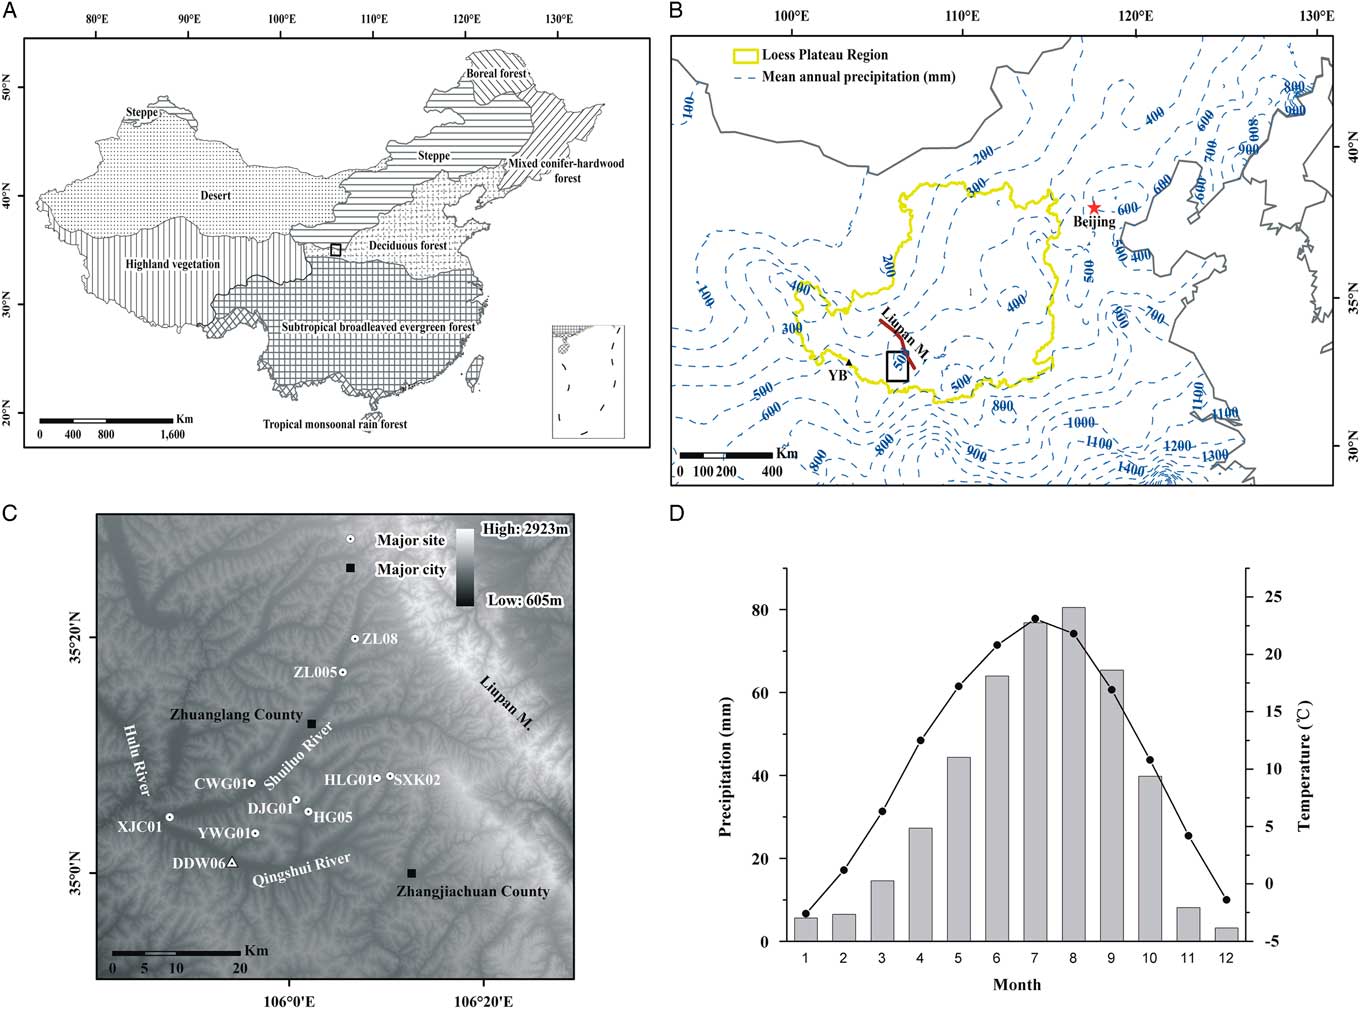
(A)Vegetation types in China. Black rectangle: study area. (B) Distribution of precipitation in Northern China (Wang, 2015; Ning et al., Reference Ning, Qin, Cui, Li and Chen2016). YB (black triangle) is the site of Yuanbao cited in the text (Rao et al., Reference Rao, Chen, Hai, Liu, Wang, Lai and Bloemendal2013) and the black square is the location of the study area plotted as (C) in this figure. (C) Location of the study sites referenced in the text. Heilaogu01 (HLG01), Changweigou01 (CWG01), Xujiacheng01 (XJC01), Huagou05 (HG05), Zhuanglang08 (ZL08), Shixiakou02 (SXK02), Doujiagou01 (DJG01), Yuweigou01 (YWG01), Zhuanglang05 (ZL05), and Dadiwan06 (DDW06). (D) Mean monthly temperature and precipitation for the nearby Qin’an meteorological station.

The Upper Paleolithic Revolution and the great human expansion marked the last stage of the Pleistocene at a time period coincident with abrupt, high-amplitude fluctuations in environmental conditions (Wang et al., Reference Wang, Cheng, Edwards, An, Wu, Shen and Dorale2001; Bar-Yosef, Reference Bar-Yosef2002; NGRIP members, 2004; Henn et al., Reference Henn, Cavalli–Sforza and Feldman2012). Technological innovations may be responsible for changes in human activity (Tallavaara and Seppä, Reference Tallavaara and Seppä2012; Shennan et al., Reference Shennan, Downey, Timpson, Edinborough, Colledge, Kerig, Manning and Thomas2013; Chen et al., Reference Chen, Dong, Zhang, Liu, Jia, An, Ma, Xie, Barton, Ren, Zhao, Wu and Jones2015; Li et al., Reference Li, An, Fan, Dong, Zhao and Wang2015), while stone tool technologies during MIS 3 is generally consistent with the WLP (Zhang et al., Reference Zhang, Chen, Bettinger, Barton, Ji and Morgan2010; Morgan et al., Reference Morgan, Barton, Bettinger, Chen and Zhang2011). This makes the MIS 3 an especially attractive time period to explore the impact of climate on human activity.
Climate during MIS 3 (59–29 ka) was characterized by high-amplitude, millennial-scale oscillations (Voelker, Reference Voelker2002). Studies of ice cores and marine and loess sediments convincingly demonstrate that this period is an interstadial (Imbrie et al., Reference Imbrie, Hays, Martinson, Mcintyre, Mix, Morley, Pisias, Prell and Shackleton1984; Hovan et al., Reference Hovan, Rea, Pisias and Shackleton1989; Jouzel et al., Reference Jouzel, Barkov, Barnola, Bender, Chappellaz, Genthon and Kotlyakov1993; NGRIP members, 2004), but similar or higher temperature and precipitation comparing to Holocene were reconstructed during MIS 3 using δ18O, phytoliths, and 10Be from ice cores and loess deposits on the Qinghai-Tibetan Plateau and Chinese Loess Plateau, respectively (Thompson et al., Reference Thompson, Yao, Davis, Henderson, Mosley-Thompson, Lin, Beer, Synal, Cole-Dai and Bolzan1997; Lu et al., Reference Lu, Wu, Liu, Jiang and Liu2007; Zhou et al., Reference Zhou, Xian, Du, Kong and Wu2014b). There were high lake levels in arid and semiarid areas of China, especially during late MIS 3 (Shi et al., Reference Shi, Yu, Liu, Li and Yao2001; Zhang et al., Reference Zhang, Wunnemann, Ma, Peng, Hans-J, Li, Qi, Chen, Fang and Feng2002; Yang et al., Reference Yang, Shi, Braeuning and Wang2004). Some pollen records, however, reveal a gradual drying trend from early to late MIS 3 in North China, indicating that early MIS 3 was the wettest part of MIS 3 (e.g., Jiang et al., Reference Jiang, Mao, Xu, Thompson, Wang and Ma2011; Wei et al., Reference Wei, Fan, Zhao, Ma, Shan, An and Yuan2015; Zhao et al., Reference Zhao, An, Duan, Zhao, Mao, Zhou, Cao and Chen2017). Studies on loess and speleothems in China also show that early MIS 3 was the warmest and wettest period, but there was an increase in temperature and precipitation from middle to late MIS 3, rather than a continuous decline (e.g., Porter, Reference Porter2001; Wang et al., Reference Wang, Cheng, Edwards, Kong, Shao, Chen, Wu, Jiang, Wang and An2009). More detailed studies are needed to better understand the climate during MIS 3.
Moreover, conclusions derived from spatial differences between site locations of climatic and archaeological data are questionable (Dolukhanov and Arslanov, Reference Dolukhanov and Arslanov2009; Tallavaara and Seppä, Reference Tallavaara and Seppä2012). In this study, we present pollen, grain size, and magnetic susceptibility to reconstruct patterns of regional climatic and vegetation change from the Dadiwan site and compare it with local and regional archaeological data to discuss the relationship between climatic change and hunter-gatherer activities on the WLP in North China.
STUDY AREA
This study focuses on the area located near the Shuiluo River and Qingshui River, part of the watershed of the Hulu River on the WLP, roughly between 34°30′ to ~35°30′N and 105°30′ to ~106°30′E (Fig. 1C). This study area is in the transition zone from the eastern Liupan Mountains to the western area of loess deposition. Mean annual temperature is ca. 7.5°C, mean annual precipitation is ca. 450 mm (Fig. 1D), the average number of frost-free days is 163, and there are 2100 sunshine hours a year. The climate of this transitional zone ranges from humid to sub-humid and, correspondingly, the vegetation varies from forest steppe to steppe (Fig. 1A; Wu, Reference Wu1980). Due to intensive agricultural activity (the main modern crops are wheat and corn) the natural vegetation is preserved only on the loess hills. The forest community consists mainly of Quercus liaotungensis, Pinus tabulaefor, and Populus tremula in the Liupan Mountains. The natural steppe vegetation is dominated by Stipa bungeana, S. breviflora, S. grandis, S. kryocii, Thymus mongolicu, Artemisia gmelinii, and A. frigida (Sun et al., Reference Sun, Feng and Ma2010).
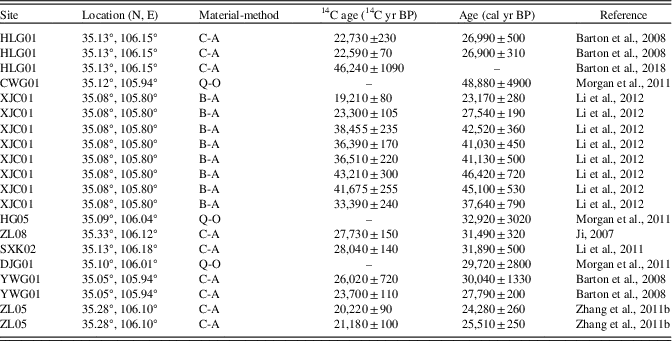
Within this region, a number of archaeological sites have been found and many dating studies have been performed (Ji, Reference Ji2007; Barton et al., Reference Barton, Morgan, Bettinger and Zhang2008; Zhang et al., Reference Zhang, Chen, Bettinger, Barton, Ji and Morgan2010; Li et al., Reference Li, Chen, Gao, Liu, Zhang and Wang2011; Morgan et al., Reference Morgan, Barton, Bettinger, Chen and Zhang2011; Zhang et al., Reference Zhang, Chen, Ji, Barton, Brantingham and Wang2011b; Li et al., Reference Li, Chen, Liu, Wang, Zhang, Li, Zhang and Gao2012). Ten of the sites were dated to the period in question: 60–25 ka (Table 1, Fig. 1C). They are Heilaogu01, Changweigou01, Xujiacheng01, Huagou05, Zhuanglang08, Shixiakou02, Doujiagou01, Yuweigou01, Zhuanglang05, and Dadiwan06. They are found in multiple settings, such as river margins, middle-elevation basins, and saddles along ridge-lines. Technological behaviors focused on an expedient, mostly quartz-based core/flake technology (Zhang et al., Reference Zhang, Chen, Bettinger, Barton, Ji and Morgan2010; Morgan et al., Reference Morgan, Barton, Bettinger, Chen and Zhang2011; Li et al., Reference Li, Chen, Liu, Wang, Zhang, Li, Zhang and Gao2012).
Dates for sites referenced in the text. The 2-sigma calibrated midpoints (cal yr BP) and range (±) were generated using OxCal 4.3 online software (Intcal 13 curve). C-A, charcoal and accelerator mass spectrometry (AMS); B-A, bone and AMS; Q-O: quartz and optically stimulated luminescence (OSL).

Located in Shaodian village, Qin’an County, Gansu Province and situated on the south side of Qingshui River (105°54′E, 35°1′N; Fig. 1C), the Dadiwan archaeological site is the earliest site designated as part of the Dadiwan cultural complex and it is also the westernmost site of early millet agriculture in Northern China.
MATERIALS AND METHODS
The DDW06 section is 8.5 m deep and consists of three 1 × 2-m subsections. The description of the profile is as follows: 0–1.8 m, Holocene soil (S0), highly disturbed by human activity with abundant charcoal; 1.8–3.5 m, Late Malan loess (L1L1), relatively coarse-grained, loose; 3.5–7.1 m, interstadial paleosol (L1S1), grey soil, moderately compact; 7.1–8.5 m, Early Malan loess (L1L2), abundant fine-grained precipitated carbonate above 8.2 m (for a detailed description, see Zhang et al., Reference Zhang, Chen, Bettinger, Barton, Ji and Morgan2010). The present study focuses primarily on L1S1 (Fig. 2).
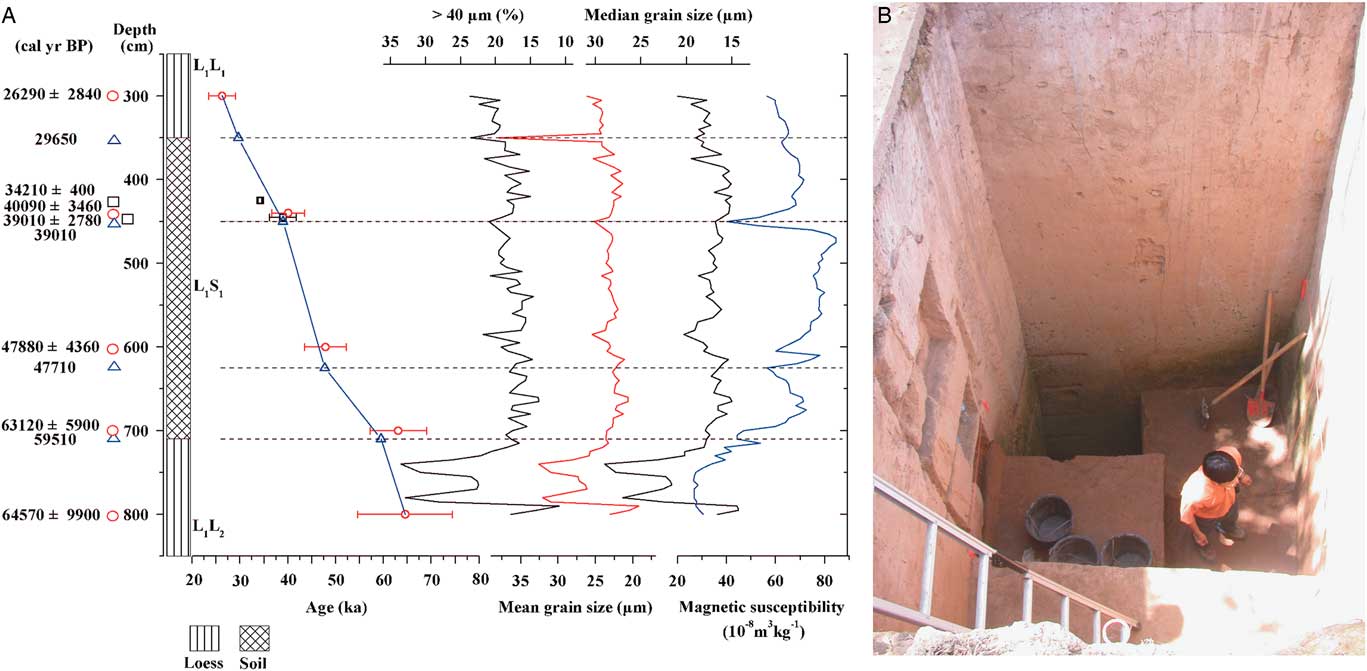
(A) Dates, lithology, age-depth model, grain size and magnetic susceptibility for the DDW06 section. Red circles with error bars are OSL dates, black squares with error bars are 14C dates, and blue triangles are age control points based on correlation of the grain-size and magnetic susceptibility data to an ice core record. (B) The photo of the DDW06 profile.

Pollen samples were taken from 315–765 cm at 5-cm intervals. Because the loess sediments are in an oxidized environment that is bad for pollen preservation, approximately 100 g of sediment from each of the 70 subsamples were used for pollen analysis. The subsamples were processed using improved palynological procedures for loess sediments (Li and He, Reference Li and He2004), including sequential treatment with 15% HCl, 10% KOH, 40% HF, and 30% HCl. Tablets of exotic Lycopodium spores were added to calculate pollen concentrations. The samples were mounted in glycerin and counted using a light microscope at 400–600× magnification. Pollen identification was based on published pollen plates and an extensive set of modern pollen reference slides (Xi and Ning, Reference Xi and Ning1994; Wang et al., Reference Wang, Qian and Zhang1995). The average pollen counts were more than 100 grains per sample. Pollen diagrams were plotted using Tilia 2.0.29 and pollen assemblage zones were defined using stratigraphically constrained cluster analysis (CONISS; Grimm, Reference Grimm2004).
Principal Component Analysis (PCA) was conducted using CANOCO v4.52 (ter Braak and Smilauer, Reference ter Braak and Smilauer2003). Prior to the PCA, detrended correspondence analysis (DCA) was performed to determine whether a linear or unimodal model should be employed in subsequent ordination analysis. The results of the DCA with a maximum gradient length of 2.51 (<3.0 standard deviations) suggested that PCA is an appropriate ordination method for the pollen data.
Subsamples at a 5-cm interval were used for grain-size analysis. Pretreatment consisted of the addition of 10% H2O2 to remove organic matter, 10% HCl to remove carbonates and, finally, dispersion with 0.05 mol/L (NaPO3)6. Grain-size distributions were measured using a Malvern Mastersizer 2000.
RESULTS
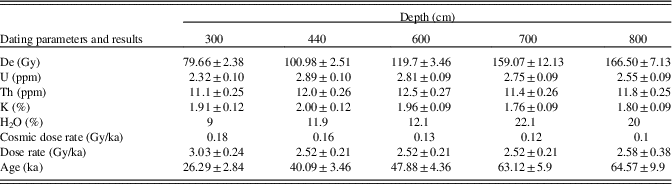
The age-depth model is mainly based on optically stimulated luminescence and accelerator mass spectrometry 14C dates published by Zhang et al. (Reference Zhang, Chen, Bettinger, Barton, Ji and Morgan2010; Table 2, Fig. 2). In the age-depth model for DDW06, four age-control points (mainly of Heinrich [H] events) were obtained from the comparison between the stratigraphic characteristics of the profile, including the content of coarse silt and sand (>40 μm, %) and magnetic susceptibility (MS), with the oxygen isotopic record of the North Greenland Ice Core Project (NGRIP members, 2004; Zhang et al., Reference Zhang, Chen, Bettinger, Barton, Ji and Morgan2010; Fig. 2 and 5). A final age-depth model was obtained by linear interpolation of the selected age-control points and other chronometric data.
Dating parameters of the five optically stimulated luminescence (OSL) ages from Dadiwan (DDW06).

The results of grain-size analysis of the DDW06 section are illustrated in Figure 2. The trends in median and mean grain size mainly parallel those of the >40 μm (%) curve. From 800–710 cm, the grain size is coarse and exhibits a pattern of high-amplitude fluctuations. From 710–350 cm, it becomes finer with smaller fluctuations and grains become coarser again from 350–200 cm.
Pollen data of DDW06
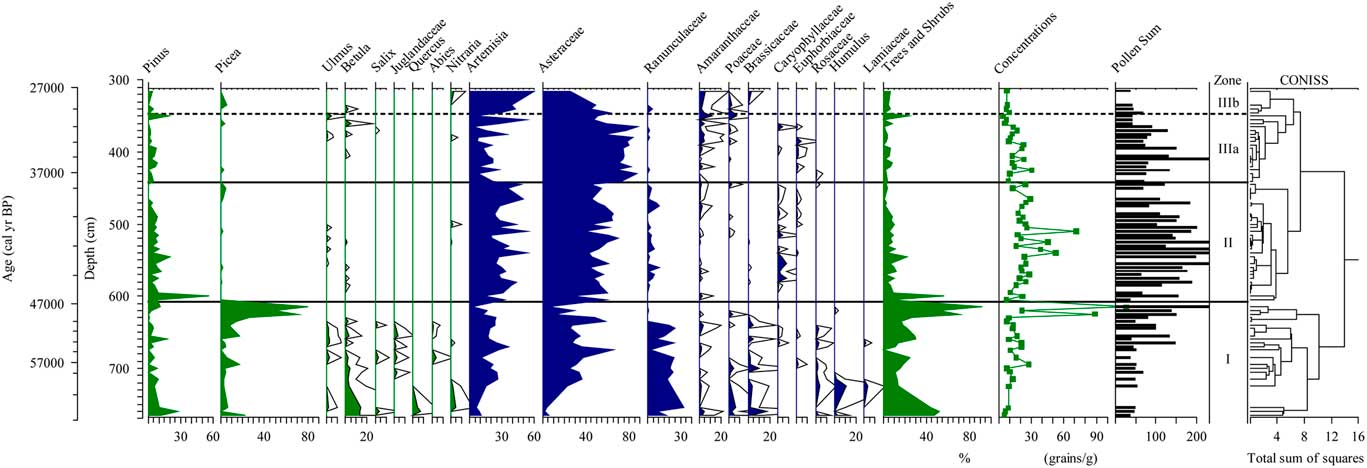
A total of 38 pollen types were identified in the pollen samples from the DDW06 section. Pinus and Picea are the dominant tree taxa, and the major herb pollen types are Artemisia, Asteraceae, and Ranunculaceae. Other taxa include Ulmus, Betula, Salix, Abies, Quercus, Poaceae, Amaranthaceae (= Chenopodiaceae), and Brassicaceae. The resulting percentage pollen diagram was divided into three assemblage zones based on the results of CONISS. The characteristics of the three zones are shown on the pollen diagram and are described below (Fig. 3).
Pollen percentage diagram for the DDW06 section.

Zone I (765–607 cm; 62.6–46.7 ka)
This zone has the highest percentages of trees and shrubs, which range from 0–92% (mean=29.8%); the major taxa are Pinus (0–27.5%, mean=6.1%) and Picea (0–80.5%, mean=16.6%). Other tree and shrub pollen types occasionally represented include Betula, Salix, Ulmus, Quercus, and Nitraria. The herb pollen taxa are dominated by Artemisia (2.2–36.4%, mean=18.4%), Asteraceae (5.5–65.4%, mean=28.4%), and Ranunculaceae (0–33.3%, mean=13.9%). From 630–615 cm (48.4–47.2 ka) the Picea percentages range from 26.4–80.5% (mean=56.9%). The pollen concentrations are low, ranging from 5–117 grains/g (mean=21 grains/g).
Zone II (607–442 cm; 46.7–38.5 ka)
This zone is characterized by the abundance of Artemisia (mean=32.5%) and Asteraceae (mean=53.2%). Pinus is the main tree pollen type and it ranges from 0–56.6% (mean=8.2%). Compared to zone I, the representation of Ranunculaceae, ranging from 0–10.9% (mean=2.5%), is greatly decreased; in addition, the average pollen concentration (25 grains/g) is slightly increased.
Zone III (442–315 cm; 38.5–27.3 ka)
Artemisia and Asteraceae are still the dominant pollen taxa throughout the zone; however, the zone can be divided into two subzones. In subzone IIIa (442–347 cm; 38.5–29.5 ka), the percentage of Artemisia (mean=18.2%) is significantly less than in zone II, whereas Asteraceae (mean=72.1%) increases. Pinus varies from 0 to 19.5% (mean=3.8%), and Amaranthaceae increases to an average of 2.3%. In subzone IIIb (347–315 cm; 29.5–27.3 ka), Artemisia increases (mean=42.0%), Asteraceae decreases (mean=45%), and Amaranthaceae increases slightly (mean=3.6%). There are minor amounts of Pinus, Picea, Poaceae, and Brassicaceae. The pollen concentration exhibits a decreasing trend, with a mean of 12 grains/g.
Results of PCA
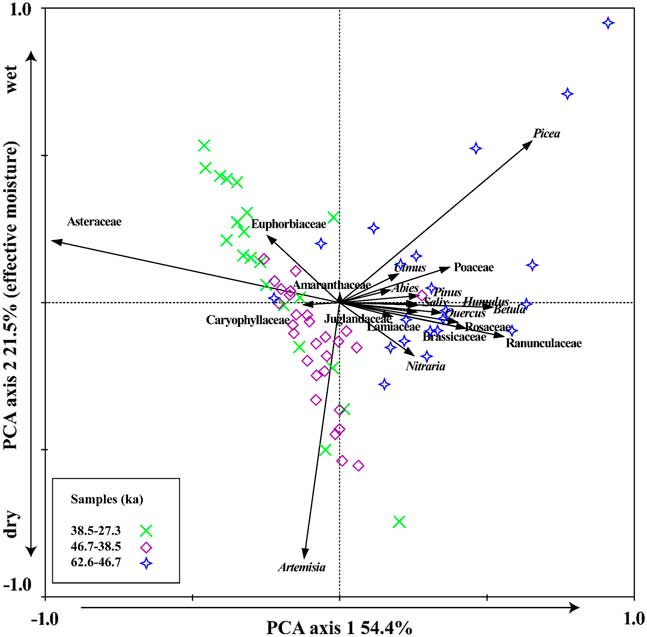
PCA results show that the first and second axes capture 54.4% and 21.5% of the total variance in the data set, respectively (Fig. 4). The major negative component of PCA axis 1 (PCA-1) is Asteraceae, which is a family and has a broad ecological range (Tang et al., Reference Tang, Zhang and Zhou2012). PCA-2 separates mesic conifers (Picea) from the drought-resistant taxa such as Artemisia and Nitraria. Therefore, PCA-2 is interpreted as reflecting effective moisture. Samples grouped by age can be separated on the basis of the PCA scores of the first two axes, corresponding to the pollen assemblage zones defined by CONISS (Fig. 4).
Biplot of PCA results for pollen data from DDW06.

DISCUSSION
Regional vegetation history
Modern pollen spectra from forest steppe and the steppe of the Chinese Loess Plateau are dominated by Artemisia, Amaranthaceae, Poaceae, and non-Artemisia Asteraceae, while desert steppe and desert have higher percentages of Nitraria and Ephedra. The surface pollen assemblages of the different vegetation types accurately represent the modern vegetation in terms of the composition of the main taxa and the dominant types (Zhao et al., Reference Zhao, Li, Hou, Sun, Zhao, Tang and Li2012).
Based on the fossil-pollen assemblages of the DDW06 section, we divide the vegetation history into three stages (Fig. 3). From 62.6–46.7 ka, the relatively high percentages of Artemisia, Asteraceae, and Ranunculaceae, together with the significant presence of Pinus and Picea, indicate that Artemisia-Asteraceae-Ranunculaceae and Pinus-Picea forest steppe were the main vegetation types in the study area. From 48.4 to 47.2 ka, the pollen assemblages were dominated by Picea (up to 80.5%), with a high pollen concentration, suggesting the presence of spruce forest based on modern pollen-vegetation relationships (Ma et al., Reference Ma, Zhang, Pachur, Wü, Li and Feng2004; Yan et al., Reference Yan, Kong, Yang, Zhang and Ni2004; Li et al., Reference Li, Xu, Xiao and Yang2005a). The maximum Picea percentages indicate a relatively cool and humid climate (Zhu et al., Reference Zhu, Chen, Tang, Shi and Xie2001; Ma et al., Reference Ma, Zhang, Pachur, Wü, Li and Feng2004; Lu et al., Reference Lu, Wu, Yang, Shen, Zhu, Wang, Li, Xu, Tong and Sun2008). The cold H5 event (~47.7 ka) occurred during this interval and the low temperatures combined with low summer insolation may have caused a reduction in evaporation and thus an increase in effective moisture. The occurrence of cool conditions, however, is inconsistent with a pollen record from the Jingning lacustrine-wetland-eolian sequence (Li et al., Reference Li, Tang, Feng, Wang, An and Zhang2006).
Between 46.7 and 38.5 ka, the study area was dominated by Artemisia-Asteraceae steppe (Fig. 3). Compared to the previous interval, the climate deteriorated and the vegetation changed from forest steppe to steppe. From 38.5 to 27.3 ka, the region remained covered by Artemisia-Asteraceae steppe. The interval can be divided into two sub-stages, however: during sub-stage 1 (38.5–29.5 ka) there was less Artemisia and more Asteraceae than during sub-stage 2 (29.5–27.3 ka).
Human actions have long influenced the natural vegetation cover of the Chinese Loess Plateau and it is almost impossible to find examples of the original vegetation (Liu et al., Reference Liu, Guo, Wu and Lu1996). Thus, the nature of the vegetation cover before human occupation and land exploitation remains controversial. Based on previous work, however, including numerous pollen studies, the western Loess Plateau was likely grassland and forest or forest steppe only developed in valleys and gullies (Liu et al., Reference Liu, Guo, Wu and Lu1996; Sun et al., Reference Sun, Song, Wang and Sun1997; Li et al., Reference Li, Zhou and Dodson2003; Lu et al., Reference Lu, Liu and Guo2003; Zhang et al., Reference Zhang, Zhao, Eglinton, Lu and Huang2006; Feng et al., Reference Feng, Tang, Ma, Zhai, Wu, Li, Zou, Yang, Wang, Derbyshire and Liu2007; Jiang et al., Reference Jiang, Mao, Xu, Thompson, Wang and Ma2011; Zhou et al., Reference Zhou, Li, Dodson, Yang, Long, Zhao, Sun, Yang, Liu and Zhao2014a; Sun et al., Reference Sun, Guo, Wu, Li, Yu, Luo, Jiang and Li2017). The Dadiwan site is located on the terrace of Qingshui River, and the δ13Corg (carbon isotope composition of the bulk organic fraction) record from Dadiwan also supports pollen reconstructed vegetation history (Zhong, Reference Zhong2008).
From 46.7 to 27.3 ka, the pollen spectrum of the DDW06 section is dominated by Artemisia and Asteraceae. In loess deposits, four main herb pollen taxa (Artemisia, Asteraceae, Amaranthaceae, and Poaceae) typically comprise more than 90% of the total (Jiang and Ding, Reference Jiang and Ding2005; Jiang et al., Reference Jiang, Cheng, Yang and Yang2013; Zhang, Reference Zhang2014; Zhou et al., Reference Zhou, Li, Dodson, Yang, Long, Zhao, Sun, Yang, Liu and Zhao2014a). The four taxa are distributed from south to north across the Chinese Loess Plateau. Therefore it is impossible to determine changes in steppe communities based solely on changes in pollen assemblages (Zhou et al., Reference Zhou, Li, Yang, Hao, Yang, Zhao and Cui2016) but the pollen records of the DDW06 section indicate that the vegetation composition changed during the interval from 46.7–27.3 ka (Fig. 3).
Climate change during MIS 3 in the Dadiwan area
The grain-size distribution of the loess can be interpreted as an index of winter monsoon intensity (An et al., Reference An, Kukla, Porter and Xiao1991; Porter and An, Reference Porter and An1995) and the content of the >40 μm fraction is regarded as the best proxy index of East Asia winter monsoon strength in the western Loess Plateau (Chen et al., Reference Chen, Bloemendal, Wang, Li and Oldfield1997). The MS variations in Chinese loess coincide well with the loess-paleosol alternations and are often used to reflect changes in Asian summer monsoon activity (Heller and Liu, Reference Heller and Liu1982; Zhou et al., Reference Zhou, Oldfield, Wintle, Robinson and Wang1990; An et al., Reference An, Kukla, Porter and Xiao1991; Maher and Thompson, Reference Maher and Thompson1991; Chen et al., Reference Chen, Bloemendal, Wang, Li and Oldfield1997). The variations in grain size and MS exhibit opposite trends on DDW06 (Fig. 2).
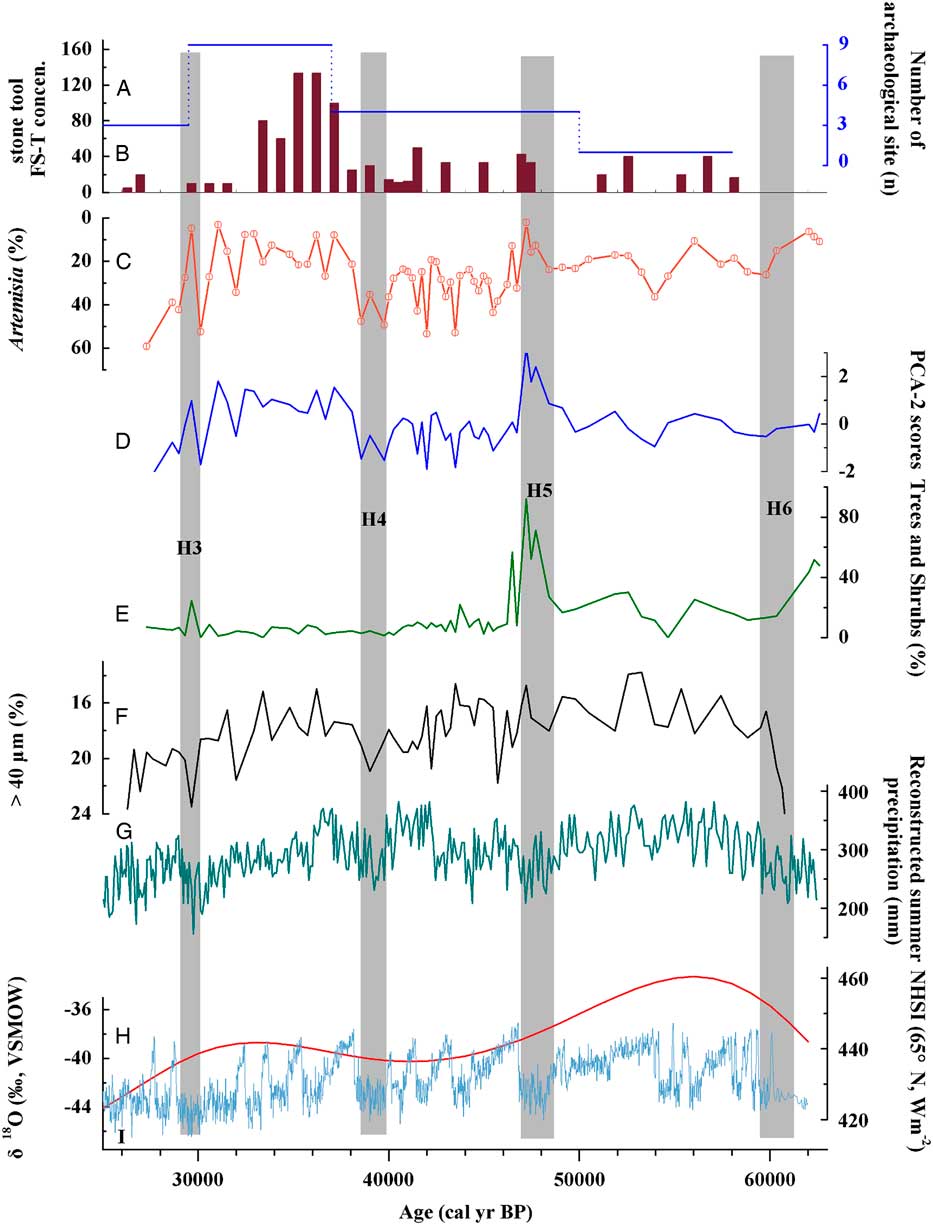
The H events are global rapid-cooling events marked by several environmental changes and strongly associated with a strong winter monsoon in the Chinese Loess Plateau (Bond et al., Reference Bond, Broecker, Johnsen, McManus, Labeyrie, Jouzel and Bonani1993; Porter and An, Reference Porter and An1995; Chen et al., Reference Chen, Bloemendal, Wang, Li and Oldfield1997). Grain-size records are consistent with the presence of H6, H5, H4, and H3 in the DDW06 section (Fig. 5F and 5I).
Comparison of pollen, archaeological and sedimentological data for the Dadiwan DDW06 section with various paleoclimatic records: (A) Variation in site number in the study area. (B) Density of stone tools at DDW06. density quartz flake-and-shatter (FS-T) (C) Percentage of Artemisia pollen at DDW06 (horizontal black lines represent the average values of specific intervals). (D) Pollen PCA-2 scores for DDW06. (E) Percentage of trees and shrubs pollen at DDW06. (F)>40 µm grain-size record at DDW06. (G) Reconstructed summer precipitation at Yuanbao in the southern Chinese Loess Plateau (Rao et al., Reference Rao, Chen, Hai, Liu, Wang, Lai and Bloemendal2013). (H) Northern Hemisphere solar insolation (65°N, average value for June) (Berger and Loutre, Reference Berger and Loutre1991). (I) NGRIP ice-core δ18O record (with the GICC05 chronology) (NGRIP members, 2004; Svensson et al., 2007). Light gray shaded bars indicate Heinrich (H) events.

As shown in Figures 5C, E, F, the intensity of the winter monsoon was weaker during early MIS 3 than in mid-late MIS 3 in general, and this led to a vegetation change from forest steppe to steppe. The variation of the grain-size records in the DDW06 section exhibits a pattern of variation almost identical to the reconstructed summer precipitation at Yuanbao (YB; Fig. 1B and 5G; Rao et al., Reference Rao, Chen, Hai, Liu, Wang, Lai and Bloemendal2013). This indicates a common pattern of climatic variation in the study area and the adjacent region.
Artemisia is one of most important plant genera and pollen taxa in arid and semiarid areas (Jiang et al., Reference Jiang, Cheng, Yang and Yang2013; Zhou et al., Reference Zhou, Li, Dodson, Yang, Long, Zhao, Sun, Yang, Liu and Zhao2014a; Zhou et al., Reference Zhou, Li, Yang, Hao, Yang, Zhao and Cui2016). In the 200- to 600-mm precipitation zone in both North America and northern China, lower precipitation corresponds to higher percentages of Artemisia (Williams et al., Reference Williams, Shuman, Bartlein, Whitmore, Gajewski, Sawada and Minckley2006; Zheng et al., Reference Zheng, Huang, Xu, Lu, Cheddadi, Luo, Beaudoui, Luo, Zheng, Li, Wei and Du2008b). In the desert area with precipitation less than 200 mm, the Artemisia percentages generally are lower with less precipitation. In the Dadiwan area, mean annual precipitation is ca. 450 mm (Fig. 1D), therefore, the higher Artemisia percentages in this area represent decreased precipitation and are a signal of the southward incursion of the semiarid steppe (Zhou et al., Reference Zhou, Li, Dodson, Yang, Long, Zhao, Sun, Yang, Liu and Zhao2014a). Following the earlier discussion, PCA-2 scores may indicate the variability of effective moisture/precipitation, with higher values indicating wetter conditions, and vice versa (Fig. 4 and 5D). As shown in Figures 5C and D, the changes of PCA-2 score are consistent with the Artemisia percentage records.
We suggest that the decrease in the proportion of Artemisia and increase in PCA-2 scores in the DDW06 section from the middle of MIS 3 (46.7–38.5 ka) to late MIS 3 (38.5–29.5 ka) reflects higher regional precipitation or effective moisture. During early MIS 3 (59–46.7 ka), the regional vegetation was likely forest steppe. Therefore, these results indicate that the climate during early MIS 3 was better from a human perspective compared to the middle to late MIS 3. This conclusion is supported by previous studies of the Chinese Loess Plateau (Porter, Reference Porter2001; Chen et al., Reference Chen, Rao, Zhang and Chen2004; Lu et al., Reference Lu, Wu, Liu, Jiang and Liu2007; Chen and Wu, Reference Chen and Wu2008). As shown in Figures 5C, E, and H, the pattern of vegetation development is correlated to Northern Hemisphere solar insolation (Berger and Loutre, Reference Berger and Loutre1991), which may be because of its effect on the thermal contrast between land and sea. A decrease in Northern Hemisphere solar insolation leads to a reduced land-sea thermal contrast, weakening the East Asian summer monsoon and reducing rainfall.
Low pollen concentrations indicate low vegetation cover (Chen et al., Reference Chen, Cheng, Zhao, Zhu and Madsen2006; Feng et al., Reference Feng, Tang, Wang, Ma and Liu2006; Zhao et al., Reference Zhao, Yu, Chen and Li2008; Zhao et al., Reference Zhao, An, Mao, Zhao, Tang, Zhou, Li, Dong, Duan and Chen2015). However, this relationship is not supported by investigations of the surface pollen spectra of the temperate steppe in Northern China (Li et al., Reference Li, Xu, Yang and Zheng2005b; Xu et al., Reference Xu, Li, Yang and Zheng2005). Studies of surface pollen samples from the desert region in China show that high pollen concentrations are the result of locally abundant and over-represented desert plants (e.g., Amaranthaceae) rather than dense vegetation cover (Herzschuh et al., Reference Herzschuh, Kuerschner and Ma2003; Zhao et al., Reference Zhao, Yu, Chen, Ito and Zhao2007). In addition, Artemisia is also over-represented in the pollen rain (Liu et al., Reference Liu, Cui, Pott and Speier1999; Li et al, Reference Li, Xu, Yang and Zheng2005b, Reference Li, Xu, Xiao, Yang and Zheng2007; Xu et al., Reference Xu, Li, Yang and Zheng2007). The high pollen concentrations in the DDW06 fossil samples may be due to the high pollen productivity of Artemisia because of the positive correlation between total pollen concentration and Artemisia percentages (Fig. 3).
The effects of climate and vegetation changes on human activities
The number of archaeological sites are frequently used as a proxy for paleo-demography (Chamberlain, Reference Chamberlain2009), and time-series analysis of archaeological site numbers, site density, and size have all been widely used in interpreting human activities and its relationship with climate change (e.g., An et al., Reference An, Feng and Tang2004; Zheng et al., Reference Zheng, Zhu, Zhong, Yin, Bai and Sun2008a; Wagner et al., Reference Wagner, Tarasov, Hosner, Fleck, Ehrich, Chen and Leipe2013; Abe et al., Reference Abe, Leipe, Tarasov, Müller and Wagner2016). As shown in Figure 5A, the temporal distribution of the sites that have been dated can be divided into four time intervals. From 58.1 to 50.0 ka, there was only one site (Dadiwan site). From 50.0 to 37.0 ka, there were four sites. The highest site number (nine sites) occurred during the interval of 37.0–29.5 ka, and decreased to three sites in the following 4 ka. The site number variations match the concentration of lithic remains, which are usually used to represent the intensity of human activity (Xia et al., Reference Xia, Liu, Wang and Qu2008; Morgan et al., Reference Morgan, Barton, Bettinger, Chen and Zhang2011; Du and Liu, Reference Du and Liu2014). As shown in Figure 5B, the density of quartz flake-and-shatter stone tools from DDW06 exhibits an increasing trend during late MIS 3, as the vegetation changed from forest steppe during the early MIS 3 to steppe during the mid-late MIS 3, human activity also became stronger (Figures 3 and 5). This could be connected with human migrations from the north into this area, although there is no direct evidence to support this hypothesis.
There were large variations in human activities during middle to late MIS 3. What is the main driving factor of hunter-gatherer activities? Primary productivity is a key variable in ecosystem functioning and it influences animal ecology and food productivity. Previous studies of the temperate steppe in northern China show that the above-ground biomass production is positively correlated with precipitation (Bai et al., Reference Bai, Han, Wu, Chen and Li2004, Reference Bai, Wu, Pan, Huang, Wang, Fusheng, Buyantuyev and Han2007; Ni, Reference Ni2004; Fang et al., 2005; Ma et al., Reference Ma, Yang, He, Ceng and Fang2008; Deng and Shangguan, Reference Deng and Shangguan2012). As discussed above, the Artemisia percentages and PCA-2 scores may be used to reconstruct regional precipitation, and the lower Artemisia percentages and higher PCA-2 scores in late MIS 3 (38.5–29.5 ka) indicate higher precipitation and therefore, higher primary productivity than that of the middle MIS 3 (46.7–38.5 ka) period.
Human activity in the region is likely a function of a complex interaction between resource abundance, population density, and social organization. As shown in Figures 5A–C, archaeological data correlate with the above-ground biomass production on the WLP from 46.7 to 29.5 ka. Our results support the hypothesis that the intensity of human activity and population growth follows increases in climatically forced biological primary productivity.
CONCLUSIONS
The pollen-inferred vegetation in the study area changed from forest steppe in the early MIS 3 (59–46.7 ka) to steppe in the middle to late MIS 3 (46.7–29.5 ka), at the same time when humans arrived in this area. Because of the decrease in vegetation, the increase in human activities may be connected with human migration from the north. In the middle to late MIS 3, the Artemisia percentages indicate precipitation increase, corresponding to the increased number of archaeological sites and stone tool density, possibly driven by higher above-ground biomass production during late MIS 3 (38.5–29.5 ka). In summary, hunter-gatherer activities in a relatively small region on the WLP during MIS 3 were not only influenced by the insolation-dominated vegetation ecology but also might be connected with human migrations driven by climate change.
ACKNOWLEDGMENTS
The authors thank two anonymous reviewers and editors Jamie Shulmeister and Derek Booth for their constructive suggestions. We also thank E.Y. Zhang for his help to improve the quality of original figures and thank Mr. D.F. Cao and Prof. J. Bloemendal for polishing the language. This study was funded by the National Natural Science Foundation of China (Grant No. 41171168, 41571182).