Implications
The use of DNA information in genetic evaluations is increasing in popularity. Procuring sufficient genomic information to generate a large population of genotyped and phenotyped animals from which to develop genomic predictions is, however, costly. Because an animal receives a relatively random half of its genome from its sire, we hypothesised that the genotype of a non-genotyped sire could be predicted from the genotypes of its offspring; we also hypothesised that the accuracy of prediction could be improved if the genotype of the sire’s mate was also used. Results confirm these hypotheses thereby proving an approach to generate a larger population of genotyped and phenotyped individuals for use in genomic evaluations at no additional cost.
Introduction
Genomic evaluations based on dense genome-wide single nucleotide polymorphisms (SNPs) (Meuwissen et al., Reference Meuwissen, Hayes and Goddard2001) are now commonly used in cattle evaluations worldwide (Hayes et al., Reference Hayes, Bowman, Chamberlain and Goddard2009; Berry et al., Reference Berry, Garcia and Garrick2016). The exploitation of genomic selection in sheep, however, is less widespread (Rupp et al., Reference Rupp, Mucha, Larroque, McEwan and Conington2016). The poorer uptake in sheep is due to a combination of reasons including the existence of multiple breeds, smaller population sizes, especially relative to the effective population size, and the cost per genotype compared with the value of the animal (Rupp et al., Reference Rupp, Mucha, Larroque, McEwan and Conington2016).
Genotype imputation is a process of predicting the unobserved genotypes of an individual based on the phased haplotypes generated from a reference population genotyped with a high-density panel, and the phased haplotype of (less dense) genotypes in the individual to be imputed (Marchini and Howie, Reference Marchini and Howie2010). The availability of low-density panel genotypes on an individual can be used to aid imputation of the missing genotypes to high-density panels when information from a reference population exists, particularly when close relatives are included in this reference population (Berry and Kearney, Reference Berry and Kearney2011; García-Ruiz et al., Reference García-Ruiz, Ruiz-Lopez, Wiggans, Van Tassell and Montaldo2015). Successful imputation from lower to higher density genotypes in sheep has already been documented (Hayes et al., Reference Hayes, Bowman, Daetwyler, Kijas and van der Werf2012; Bolormaa et al., Reference Bolormaa, Gore, van der Werf, Hayes and Daetwyler2015). Nonetheless, such a strategy still incurs a cost of genotyping the candidate animals on a lower density panel. Moreover, the animals genotyped on low-density panels are generally the younger animals, usually potential parental candidates of the next generation. Thus, the information content of these animals, with respect to their contribution to subsequent genomic evaluations, is generally low. Older animals with more accurate estimates of genetic merit may contribute relatively more to the accuracy of genomic evaluations if genotyped and also related to the candidate population (Daetwyler et al., Reference Daetwyler, Villanueva and Woolliams2008). Such genotyping, however, still incurs a cost. For difficult or expensive to measure traits, the cost of genotyping is often less than the cost of phenotyping. In such situations, it is generally beneficial to genotype the individuals with phenotypic information; however, biological samples of these animals may no longer exist precluding the ability to directly genotype the animal.
Based on the known inheritance patterns of chromosomes, each offspring inherits half its DNA from each parent. Therefore, it may be possible to generate the genotype of an individual based on the genotype of its offspring. Berry et al. (Reference Berry, McParland, Kearney, Sargolzaei and Mullen2014) documented a mean genotype concordance rate per animal of 0.952 for 55 non-genotyped dairy sires (varying from 0.933 to 0.986 per sire) imputed from the genotypes of 12 half-sib progeny. The high accuracy of imputing the genotypes of non-genotyped individuals using information from genotypes of progeny has been substantiated elsewhere both from simulations (Boison et al., Reference Boison, Neves, Pérez O’Brien, Utsunomiya, Carvalheiro, da Silvac, Sölkner and Garcia2014; Bouwman et al., Reference Bouwman, Hickey, Calus and Veerkamp2014) and real-life data in cattle (VanRaden et al., Reference VanRaden, Null, Sargolzaei, Wiggans, Tooker, Cole, Sonstegard, Connor, Winters, van Kaam, Valentini, Van Doormaal, Faust and Doak2013; Boison et al., Reference Boison, Neves, Pérez O’Brien, Utsunomiya, Carvalheiro, da Silvac, Sölkner and Garcia2014; Piccoli et al., Reference Piccoli, Braccini, Cardoso, Sargolzaei, Larmer and Schenkel2014). No study to-date, however, has attempted to impute genotypes of non-genotyped individuals in sheep but also no study based on real-life data has explicitly considered the impact on the accuracy of imputation of having genotype information from both the mate and the resulting progeny of the animal to be imputed.
The objective of the present study was to quantify the ability to impute the complete genotype of an animal by exploiting the genotypes of its progeny, with or without considering the genotype of the progeny’s other parent in the reference population. Results from this study, if successful, will be useful in enlarging the population of genotyped (and phenotyped) individuals for subsequent use in genomic predictions thereby potentially increasing the accuracy of the generated genomic evaluations.
Material and methods
Genotype data
Single nucleotide polymorphism genotype data from 12 733 individuals of multiple breeds genotyped on either the Illumina OvineSNP50 Beadchip (n=3441 animals) or a custom Illumina Infinium panel (n=9292) were available. The Illumina OvineSNP50 Beadchip contains 51 135 biallelic SNPs. The custom Illumina Infinium panel consists of 15 000 SNPs. Only the 11 302 SNPs common to both platforms were retained for analysis.
Only animals and SNPs with a call rate >95% were retained. Furthermore, only SNPs with a known genomic position were retained. SNPs that did not adhere to Mendelian inheritance (i.e. >0.2% of the homozygous parent–offspring SNPs compared were opposite) were not considered further. A total of 11 129 SNPs on 12 733 animals remained. Sex verification based on the sex chromosomes was also undertaken. Male progeny do not contribute to the accuracy of imputation of a sire’s X chromosome; nonetheless, imputation accuracy is presented across all autosomal and X chromosome SNPs. The mean number of female progeny per sire where genotypes of 10 progeny were included was 8.95.
Parentage analysis was first applied to parent–offspring pairs to confirm relationships. Parent–offspring pairs with >0.2% of SNP genotypes as opposing homozygotes were assumed to represent a conflict. The extent of parentage mis-identification was 10.0% for sires (i.e. 271 from 2702 sire-offspring genotyped pairs) and 7.6% for dams (i.e. 297 from 3908 dam–offspring genotyped pairs). Both parents were incorrectly identified in the pedigree file for a total 2.1% of the 1602 animals with genotypes on both parents. The incorrectly assigned parent(s) was subsequently set to missing in the pedigree file used in the imputation.
Imputation strategies
All imputation was undertaken for the whole genome simultaneously using FImpute V2.2 (Sargolzaei et al., Reference Sargolzaei, Chesnais and Schenkel2014) combining family- and population-based imputation. The algorithm for family imputation was modified for the present study to facilitate more accurate imputation of non-genotyped parents from offspring genotypes. The modification was specific to back imputation of parental genotypes by using very reliable haplotype phases and therefore ignoring phases with low accuracy in this step. Pseudo-code used in FImpute for the prediction of genotypes for non-genotyped animals is given in Supplementary Material 1.
Three alternative scenarios were investigated based on the data available for the study: (1) imputation of the genotypes of 41 sires with at least 15 genotyped progeny but without including the genotypes of the dams of the progeny in the reference population, (2) imputation of the genotypes of 21 sires with at least 10 genotyped progeny where the genotype of the dam was also included in the reference population, and (3) imputation of the genotype of the same 21 sires but without including the genotype of the dam in the imputation process. In all cases, the full genotype of the sire was masked and was imputed from his relatives. Also, in all cases, the genotypes of all other animals in the population were included in the reference population, which did not contain the genotype of the sire itself, either of its parents, any of its descendants, or any female mated to the sire to generate the genotyped progeny (except in the scenario which investigated the usefulness of the female mate’s genotype). The reference population consisted of 11 233 animals.
The impact of the number of genotyped offspring (with or without dam genotypes in the reference population) on the accuracy of imputing the sire’s genotype was estimated from a progeny group size of four up to 10 or 15 depending on the scenario investigated. Initially, four progeny (who also had a genotyped dam) were randomly selected per sire and all four were included in the reference population. An additional progeny per sire, which was selected randomly, was subsequently added to the reference population to provide five progeny per sire in the reference population; this was sequentially iterated with a new progeny added at each iteration. Therefore, for comparison purposes, the same sires were always included in the calculation of accuracy across varying number of paternal-progeny genotypes and the impact on accuracy of including the genotype of an additional progeny in the reference population could be directly compared with the previous iteration. Furthermore, the impact on the accuracy of imputation of not including the dam genotype was also quantified.
Accuracy statistics
Call rate of the imputed genotypes per sire was defined as the proportion of all 11 129 SNPs per sire where a genotype was generated; similarly, the call rate per SNP was defined as the proportion of imputed genotypes per SNP. Statistics used to compare concordance between the imputed genotypes of the sire and the true genotypes of the sire included: (1) genotype concordance rate – defined as the average proportion of correctly imputed genotypes per sire, and (2) allele concordance rate – defined as the average proportion of correctly imputed alleles per sire; in this instance a genotype imputed to be heterozygote but was truly homozygote was assumed to have one correct allele imputed. The correlation between the true and imputed allele count was also quantified; genotypes were defined as 0, 1 or 2 to represent homozygous, heterozygous and the opposite homozygous. Furthermore, when calculating the mean correlation between the true and imputed allele count per sire, a supplementary correlation measure was used which adjusted each genotype (i.e. coded as 0, 1, 2) for the respective SNP allele frequency as suggested by Mulder et al. (Reference Mulder, Calus, Druet and Schrooten2012) to account for differences in allele frequency per SNP. To achieve this, twice the SNP allele frequency of the allele represented by the homozygous 2 genotype was subtracted from both the true and imputed genotype of that SNP before estimating the correlation. The allele frequency per SNP used was based on the reference population used in the imputation.
Results
Sire imputation from progeny genotypes with no information on dam genotype
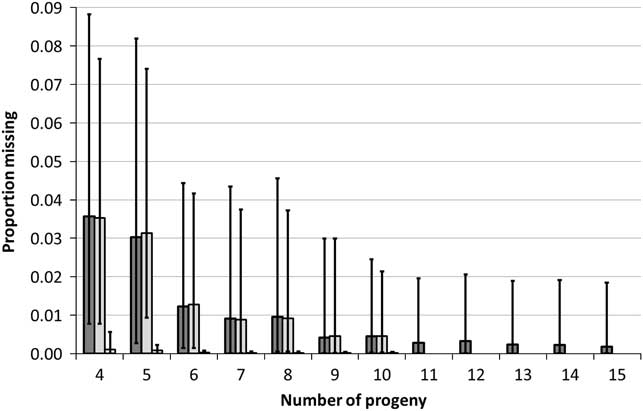
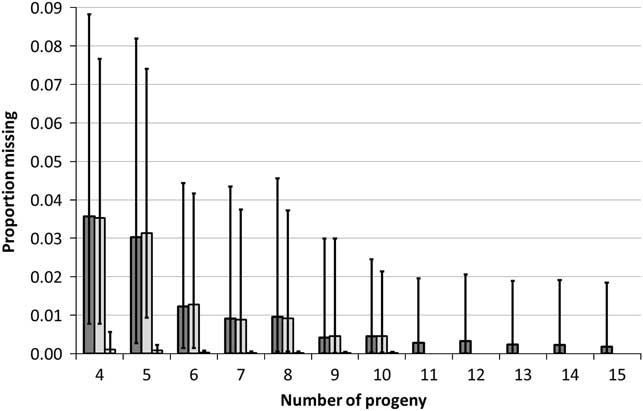
The mean proportion of genotypes (proportion of autosomal SNPs in parenthesis) per sire that could not be imputed decreased from 0.036 (0.029) when genotypes on four progeny were included in the analysis, to 0.004 (0.004) and to 0.0023 (0.0018) when genotypes on nine and 13 progeny, respectively, were included (Figure 1); the mean proportion of genotypes that could not be imputed did not vary much by adding two more progeny (i.e. 15 progeny) in the reference population. Moreover, the variability in the proportion of genotypes per sire that could not be called reduced until the genotypes from 11 progeny were included in the analysis after which it remained constant.
Mean proportion of genotypes per sire (minimum and maximum proportion per individual represented with error bars) that could not be called across different number of genotyped progeny representing, from left to right (i.e. dark to light coloured bars), (a) all 41 sires without the dam genotype included, (b) the 21 sires with the dam genotypes available but not included (up to 10 progeny), and (c) the 21 sires with the dam genotypes included (up to 10 progeny).
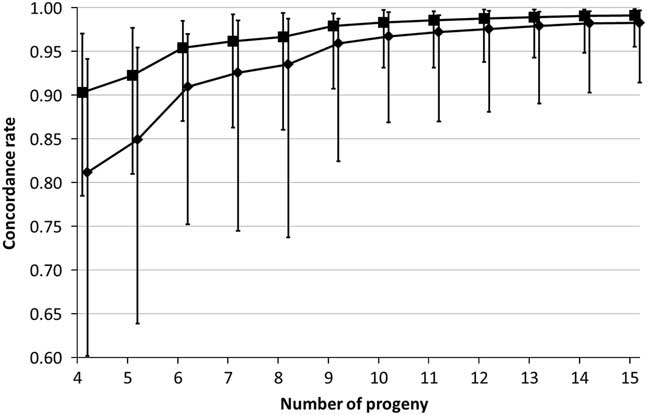
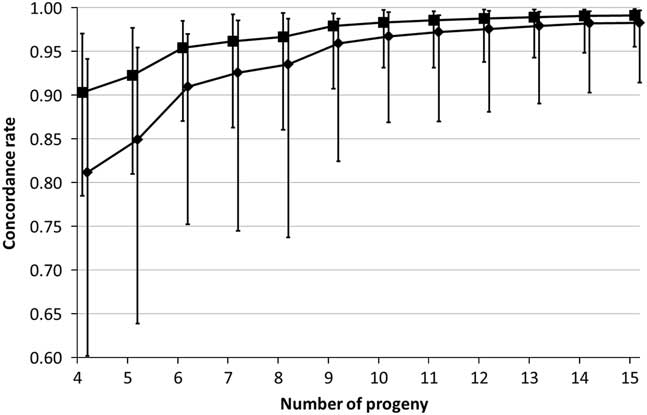
Both the mean allele and genotype concordance rate per sire (Figure 2) increased consistently as the number of progeny genotypes included in the reference population was increased. The difference between mean allele and mean genotype concordance rate reduced as the number of genotyped progeny per sire increased, suggesting that as the number of progeny genotypes increased, proportionally more of the incorrectly imputed genotypes had only one allele incorrectly imputed. Allele concordance rate increased linearly by 0.002 (SE=0.0002; R 2=0.96) per extra progeny genotyped from 10 to 15 progeny. The variability in mean concordance rate per sire constantly reduced with increasing number of genotyped progeny in the reference population. The difference between the minimum and maximum mean allele concordance rate per imputed sire was 0.186 when only four progeny were genotyped, but was 0.086 when nine progeny were genotyped; the difference between the minimum and maximum mean allele concordance rate per imputed sire when 15 progeny genotypes were used was 0.043. An allele concordance rate of at least 0.95 (mean of 0.991) for all 41 sires was achieved when at least 15 progeny genotypes were included in the reference population.
Mean allele (square) and genotype (diamond) concordance rate per sire with different number of genotyped progeny but no genotyped mates included in the imputation process; the minimum and maximum concordance rate per sire are depicted using the error bars.
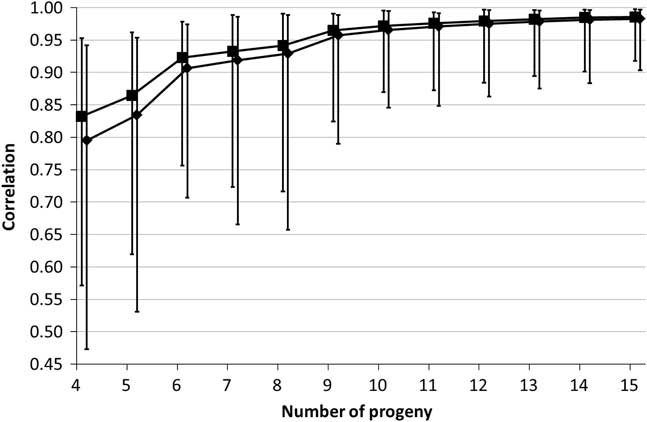
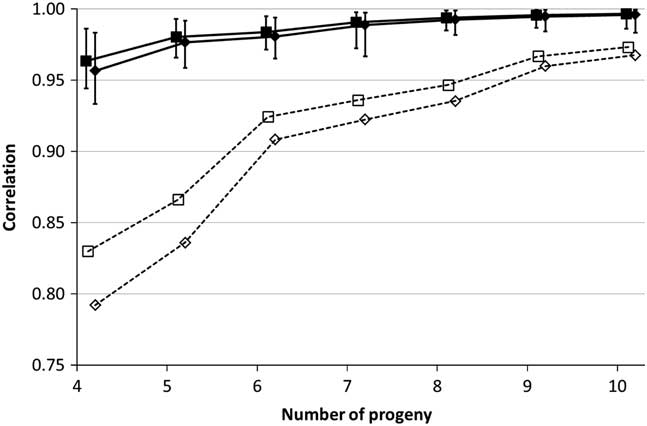
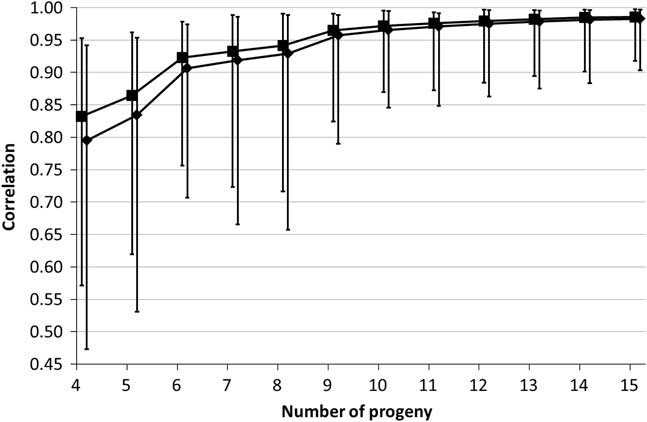
Correlations between imputed and true allele count were weaker after adjustment for the allele frequency in the reference population especially for the fewer number of progeny genotyped (Figure 3). The mean correlation between imputed and true allele count, within sire, increased as the number of genotyped progeny included in the reference population increased. However, as the number of genotyped progeny increased from 10 to 15, the mean correlation adjusted for allele frequency increased linearly, on average, by only 0.003 (SE=0.0004; R 2=0.95) per additional genotyped progeny included in the reference population. The mean raw (adjusted for allele frequency) correlation between imputed and true allele count, within sire, was 0.965 (0.958) when the genotypes of nine progeny were included in the reference population; however, the within-sire mean raw (adjusted for allele frequency) correlation was as low as 0.824 (0.790) for individual sires when the genotypes of nine progeny were included in the reference population (Figure 3). The correlation adjusted for allele frequency between imputed and true allele count for all sires was >0.90 only when the genotypes of 15 progeny were included in the reference population.
Mean unadjusted (square) and adjusted for allele frequency (diamond) correlations per sire between true and imputed allele count with different number of genotyped progeny but no genotyped mates included in the imputation process; the minimum and maximum correlation per sire are depicted using the error bars.
Sire imputation from progeny genotypes when genotypes from dams are also included
The proportion of genotypes per sire not called by the imputation process reduced as the number of genotyped progeny included in the reference population increased (Figure 1). The mean proportion of genotypes per sire that could not be called was always less when the genotype of the dam was included in the process (Figure 1). The maximum proportion of genotypes not imputed per sire was 0.0056 and 0.0004 with four and 10 progeny, respectively. Nonetheless, the difference between whether or not the dam’s genotype was included in the analysis diminished as the number of genotyped progeny (and dams) increased. Relative to when the genotype of the dam was not included in the reference population, the proportion of genotypes that could not be imputed was 0.034 less when the genotypes of four progeny and their dams were included in the reference population but only 0.0044 less when the genotypes of 10 progeny and their dams were included in the reference population.
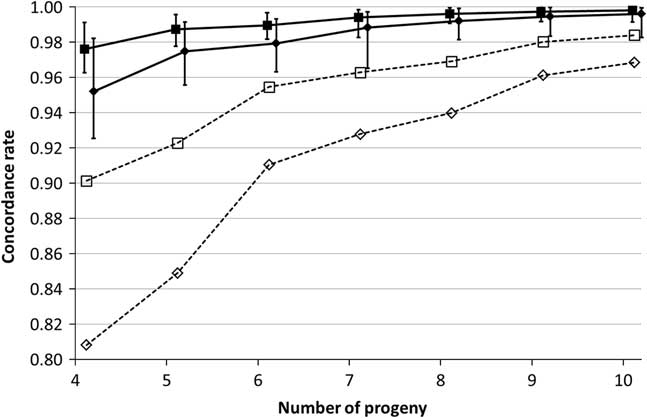
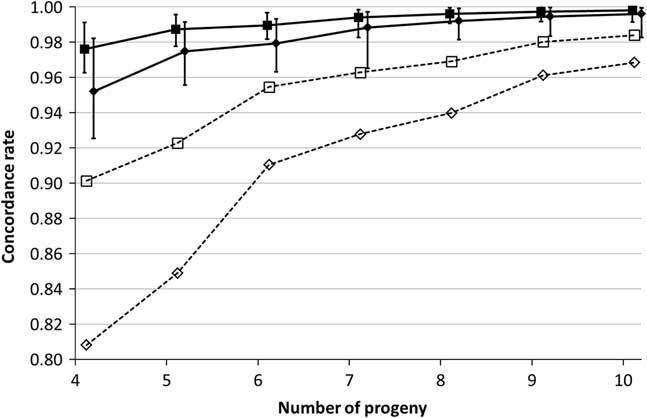
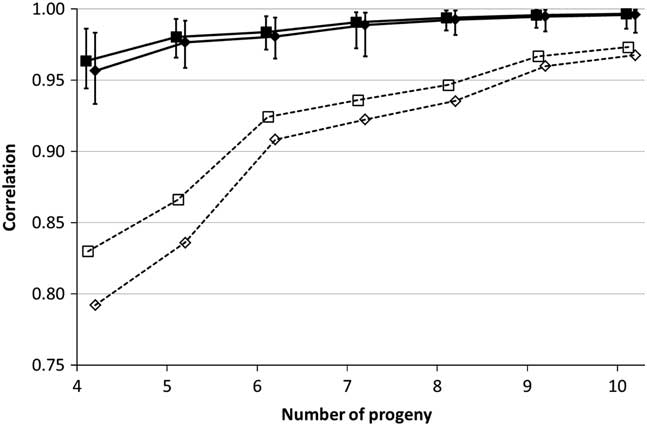
Mean allele and genotype concordance rate per sire (Figure 4) increased as the number of progeny genotypes in the analysis increased although the marginal improvement in imputation accuracy reduced as the number of progeny genotyped increased. Allele concordance rate when the genotypes of the dams were included in the reference population was 0.075 units greater when four progeny genotypes were included in the analysis but only 0.014 greater when 10 progeny genotypes were included in the analysis. A similar conclusion was evident for the mean correlation between the true and imputed allele counts (Figure 5). Relative to when the genotypes of the dams were not included in the imputation process, the mean raw (adjusted for allele frequency) correlation between true and imputed allele count, within sire, was 0.134 (0.164) greater when four progeny (and dam) genotypes were in the reference population but only 0.023 (0.028) greater when the genotypes of 10 progeny (and their dams) were also included in the reference population. Irrespective of the measure of imputation accuracy, genotypes from more than 10 progeny (without the respective dam genotypes) was required to achieve the same imputation accuracy as having genotypes from five progeny and their dams included in the imputation process.
Mean allele (square) and genotype (diamond) concordance per sire with different number of genotyped progeny but with the genotype of the dam of each progeny in the analysis (continuous line with filled in marker symbols), or with no genotype of the dam the progeny in the analysis (broken line with open marker symbols) for the same imputed sires; the minimum and maximum concordance rate per sire when the genotype of the dam was included in the analysis are depicted using the error bars.
Mean unadjusted (square) and adjusted for allele frequency (diamond) correlations per sire between true and imputed allele count with different number of genotyped progeny but with the genotype of the dam of each progeny in the analysis (continuous line with filled in marker symbols), or with no genotype of the dam the progeny in the analysis (broken line with open marker symbols) for the same imputed animals; the minimum and maximum correlation per sire when the genotype of the dam was included in the analysis are depicted using the error bars.
Imputation accuracy by single nucleotide polymorphism
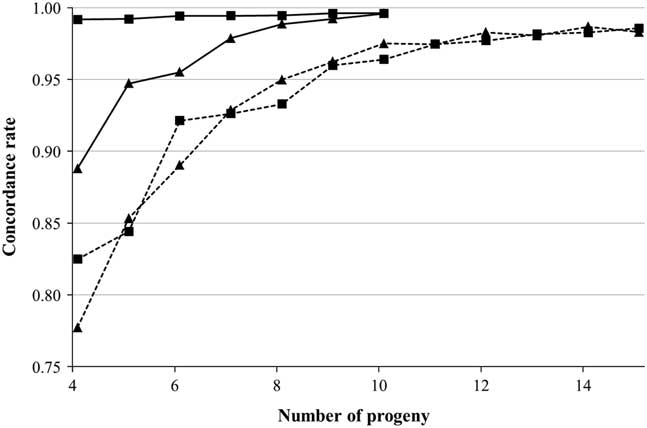
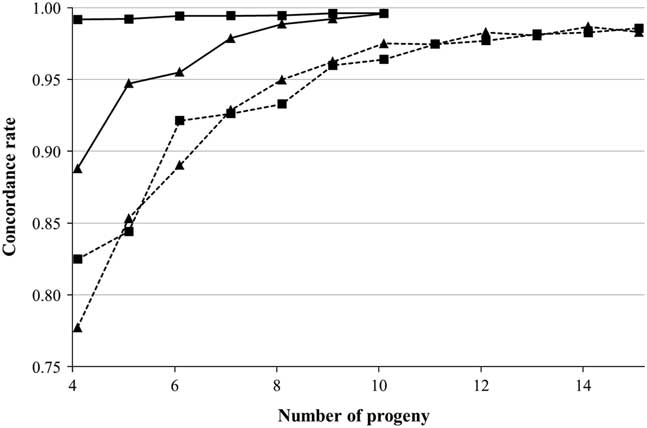
Irrespective of the number of genotypes used in the imputation, the accuracy of prediction of sire homozygous genotypes was always >0.99 when the genotypes of the dam were also used; the accuracy of prediction of sire heterozygous genotypes increased as the number of progeny plus dam genotypes were used (Figure 6). When no dam genotype was used, the accuracy of both homozygous and heterozygous genotypes increased consistently as the number of progeny genotypes used increased.
Mean genotype concordance rate per non-genotyped sire for homozygous single nucleotide polymorphisms (SNPs) (squares) or heterozygous SNPs (triangles) when the genotypes of the mate of the sire was used (continuous line) or was not used (broken line).
The genotypes not called in the imputation process were generally confined to certain SNPs. When genotypes were available on 10 progeny and their dams, genotypes were imputed for all sires for 98% of the SNPs. Of the 11 129 SNPs included in the analysis, genotypes were not called for 5% of the sires for 218 of the SNPs, while genotypes of an additional 2 SNPs were not called for 10% of the sires, whereas 15% of sires had no genotype called for a further three SNPs. Of the 223 SNPs that did not have 100% of their genotypes imputed in the non-genotyped sires, 202 resided on the sex-specific region of the X chromosome.
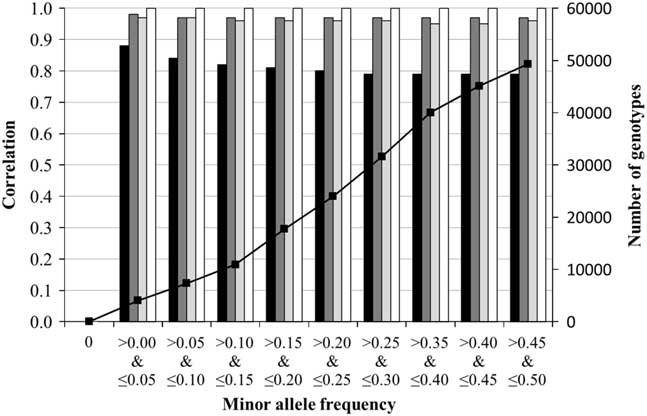
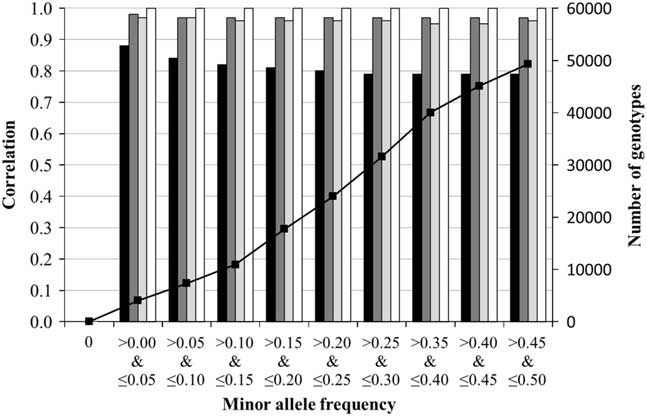
The mean correlation adjusted for allele frequency between true and imputed allele count within chromosome is represented in Supplementary Material 2 with or without the genotype of the dam included in the reference population. As expected, the mean correlation between true and imputed allele count per chromosome was always superior when the genotype of the dam of the progeny was also included. The mean correlation per chromosome was similar for all autosomes but was worst for the pseudo-autosomal region of the X chromosome and was greatest for the non-pseudo-autosomal region of the X chromosome; only nine SNPs were present in the pseudo-autosomal region of the X chromosome. Although only subtle, there was a tendency for the mean adjusted correlation between true and imputed allele count per minor allele frequency bin to reduce as minor allele frequency (MAF) increased (Figure 7).
Correlation between true and imputed allele count adjusted for allele frequency (vertical bars linked to the primary Y-axis) and number of genotypes (line linked to the secondary Y-axis) by minor allele frequency bin from left to right (reducing in bar darkness) where (a) genotypes on four progeny but no dam genotypes, (b) genotypes on 10 progeny but with no dam genotypes, (c) genotypes on four progeny with dam genotypes, and (d) genotypes on 10 progeny with dam genotypes.
Discussion
The importance of a large population of genotyped and phenotyped individuals for achieving high accuracy of genomic predictions is well established (Daetwyler et al., Reference Daetwyler, Villanueva and Woolliams2008). The benefit for genomic predictions of having a strong relationship between the reference population and the candidate population is also well known (Pszczola et al., Reference Pszczola, Strabel, Mulder and Calus2012). Therefore, generating a large population of genotyped and phenotyped individuals from family lines representative of the candidate population is crucial to achieving high accuracy of genomic predictions. Being able to generate this population without incurring the associated costs would be extremely beneficial. Although the exchange of genotypes to develop larger reference populations is now commonplace (Cromie et al., Reference Cromie, Berry, Wickham, Kearney, Pena, van Kaam, Gengler, Szyda, Schnyder, Coffey, Moster, Hagiya, Weller, Abernethy and Spelman2010; Dassonneville et al., Reference Dassonneville, Brøndum, Druet, Fritz, Guillaume, Guldbrandtsen, Lund, Ducrocq and Su2011; Veerkamp et al., Reference Veerkamp, Coffey, Berry, de Haas, Strandberg, Bovenhuis, Calus and Wall2012; de Haas et al., Reference de Haas, Pryce, Calus, Wall, Berry, Løvendahl, Krattenmacher, Miglior, Weigel, Spurlock, Macdonald, Hulsegge and Veerkamp2015), imputing parental genotypes from the genotypes of direct progeny is another option. Because several progeny are required to accurately impute a parent’s genotype (the present study; Berry et al., Reference Berry, McParland, Kearney, Sargolzaei and Mullen2014; Bouwman et al., Reference Bouwman, Hickey, Calus and Veerkamp2014; Piccoli et al., Reference Piccoli, Braccini, Cardoso, Sargolzaei, Larmer and Schenkel2014) the genotypes to be imputed may be well represented in the population and is thus likely to be relatively strongly related to the candidate population. Although the imputed genotype of the parent would have been generated from progeny genotypes already available, those progeny may not actually have phenotypic information for inclusion in genomic predictions. Furthermore, especially for low heritability traits, a marginal information content for genomic prediction of the sire, if high reliability, may exist over and above the contribution of the genotypes and phenotypes of his progeny. Because of the shorter generation interval of sheep (Norberg and Sørensen, Reference Norberg and Sørensen2007) relative to other species (McParland et al., Reference McParland, Kearney, Rath and Berry2007), and the lesser use of artificial insemination in sheep, the (candidate) sire may no longer be alive or have semen available for genotyping. One approach to incorporating the information of this ungenotyped animal into a genomic prediction strategy is through the use of one-step genomic evaluations (Aguilar et al., Reference Aguilar, Misztal, Johnson, Legarra, Tsuruta and Lawlor2010; Christensen and Lund, Reference Christensen and Lund2010). Another option, however, is to impute the genotype of the sire from the genotypes of its progeny. Results from the present study indicate that the latter option of imputing an animal’s genotype from the genotypes of its progeny is indeed possible assuming genotypes on sufficient progeny are available. An allele concordance rate of at least 0.95 per animal can be achieved when at least 15 progeny genotypes (with no dam genotype) are included in the reference population, although the results from the present study are only relevant for a genotype panel density of 11 129 SNPs as used in the present study. The accuracy of imputing the genotype of the sire can be further augmented by also incorporating the genotype of the sire’s mate used to generate the progeny in the imputation reference population. Only genotypes on four progeny and their dams are required to ensure an allele concordance rate of >0.95 for all imputed sires.
The number of SNPs included in the present study was 11 129. Berry et al. (Reference Berry, McParland, Kearney, Sargolzaei and Mullen2014) using a database of cattle genotypes reported an improvement in accuracy of imputation of non-genotyped parents as the density of the genotype panel increased; Berry et al. (Reference Berry, McParland, Kearney, Sargolzaei and Mullen2014) also reported fewer genotypes that could not be imputed in non-genotyped sires as genotype panel density increased, with the proportion that could not be imputed, on average, almost halving from a density of 6501 autosomal SNPs to a density of 47 770 SNPs and halving again to a density of 735 151 SNPs. This therefore may suggest greater imputation accuracy could have been achievable in the present study if a higher density genotype panel was available.
Proportion of genotypes per sire not imputed
The reduction in the mean and variability in the proportion of genotypes per sire that could not be imputed as the number of progeny genotypes included in the reference population increased is consistent with results documented in other populations (Berry et al., Reference Berry, McParland, Kearney, Sargolzaei and Mullen2014). Unlike the present study, however, Berry et al. (Reference Berry, McParland, Kearney, Sargolzaei and Mullen2014) documented a continual reduction in the mean and variability in proportion of genotypes that could not be imputed in separate beef and dairy populations as the number of genotyped progeny per sire increased to the maximum investigated in their data set of eight and 12, respectively. However, 90% of the genotypes that were not imputed all of the time in the imputation process in the present study resided on the non-pseudo-autosomal region of the X chromosome; only autosomes were considered in the study of Berry et al. (Reference Berry, McParland, Kearney, Sargolzaei and Mullen2014). The mean (minimum, maximum) proportion of autosomal genotypes per sire not imputed in the present study was 0.0001 (0.0000, 0.0004) when genotypes on 10 progeny and their dams were in the reference population which is comparable with the values reported by Berry et al. (Reference Berry, McParland, Kearney, Sargolzaei and Mullen2014) in cattle when genotypes on 10 progeny were used; Berry et al. (Reference Berry, McParland, Kearney, Sargolzaei and Mullen2014) provided no information on whether the genotypes from the dams of these progeny were also included in their analysis. Therefore, the success of imputing the autosomal SNPs is very high once several progeny genotypes are used, especially if dam genotypes are also used in the imputation process. Little improvement in the proportion of genotypes imputed was achieved once genotypes of seven progeny and their dams were used or genotypes of 11 progeny without their respective dams’ genotypes.
Imputation accuracy by number of genotyped progeny
The increased accuracy of imputation of non-genotyped sires with increasing number of genotyped progeny corroborates many other previous studies either using real-life data from cattle (Berry et al., Reference Berry, McParland, Kearney, Sargolzaei and Mullen2014; Piccoli et al., Reference Piccoli, Braccini, Cardoso, Sargolzaei, Larmer and Schenkel2014) or based on simulated data (Bouwman et al., Reference Bouwman, Hickey, Calus and Veerkamp2014). This is not unexpected, because as the number of genotyped progeny per sire included in the reference population increases, the probability of the three alternative genotypes per sire are likely to diverge favouring one particularly genotype. The relative contribution of the genotype from an additional progeny to the imputed genotyped of their parent increased as SNP MAF increased (results not shown). This, therefore, substantiates the usefulness of genotype information from additional progeny to help reconcile the genotype of the parent, especially when the SNP is strongly segregating in that population. The weaker mean correlation between true and imputed allele count for the pseudo-autosomal region might be due to the short length of this region that makes both family and population imputation more difficult.
Selection index theory (Bouwman et al., Reference Bouwman, Hickey, Calus and Veerkamp2014) also confirms the contribution, albeit at a diminishing rate, of each additional progeny to the accuracy of imputing the genotype of a non-genotyped parent. Nonetheless, the actual imputation accuracy in the present study, as depicted by the adjusted correlation between imputed and true allele count, was always greater than expectations based on selection index theory; a similar conclusion was documented by Bouwman et al. (Reference Bouwman, Hickey, Calus and Veerkamp2014). Genealogical-based relationship coefficients as used in the selection index calculations, however, are based on probabilities of inheritance while the molecular-based relationships coefficients are based on actual inheritance and are therefore more accurate. One reason contributing to the discrepancy could therefore be a stronger than 0.5 relationship between (some of) the offspring and the sire owing to genomic inbreeding, which is not taken into account by selection index theory.
The stronger mean correlation per sire between the true and imputed allele count compared with the respective adjusted correlation is consistent with reported elsewhere (Bouwman et al., Reference Bouwman, Hickey, Calus and Veerkamp2014) with the difference being greatest when imputation accuracy was poorest; the difference between correlation estimates is because the raw correlation overestimates the correlation as a result of bias due to differences in MAF across loci. This is because different SNPs have different MAF, and thus also have a distribution with a different mean, while a Pearson correlation assumes that the correlated variables are bivariate normally distributed (Calus et al., Reference Calus, Bouwman, Hickey, Veerkamp and Mulder2014).
Impact of including the genotypes of both the mates of the sire and the resulting progeny in the reference population
Irrespective of the measure of imputation accuracy considered, or the number of progeny genotypes used in the analysis, including the genotype of the dam improved the imputation accuracy (Figures 4 and 5); for example, mean allele concordance rate improved by 0.01 to 0.07 percentage units when dam genotypes were also included in the imputation process. Although such a scenario has not been explicitly examined previously using real-life data, the conclusion is not unexpected. For example, it is not possible to resolve the locus genotype of a parent where a genotype for only a single progeny exists and that progeny is heterozygous at the locus. If however the dam is homozygous for that locus then the sire must be carrying at least one of the alternative alleles (ignoring genotyping errors and de novo mutations) so must be either heterozygous itself or homozygous for the alternative allele. The possible genotype of the sire is therefore reduced from three possibilities to two.
Relatively good consistency existed in the genotypes which were incorrectly called irrespective of the scenarios of whether or not the genotypes of the dams of the progeny were also included in the reference population. Of all 231 713 called sire genotypes, when 10 progeny genotypes were included in the reference population (with or without the dam genotypes also included), 96.56% were correctly called in both scenarios; 0.29% of genotypes correctly called when no dam genotype was included in the reference population had at least one allele incorrectly called when the dam genotype was included in the reference population while 2.98% of genotypes correctly called when the dam’s genotype was in the reference population had at least one allele incorrectly called when the dam’s genotype was not in the reference population.
Conclusions
Results from the present study indicate that is indeed possible to impute the complete genotype of a non-genotyped individual from the genotypes of its progeny; the accuracy of imputation can, however, be augmented by also including in the imputation process the genotype of the dams of the progeny (i.e. the mates of the sire). Although the threshold imputation accuracy deemed to be sufficient may differ depending on the end use, for genomic predictions at least, imputation based on the genotypes of seven progeny and their dams provide sufficiently high accuracy of imputation (allele concordance rate of 0.994), with little additional benefit thereafter; such an imputation accuracy could not be achieved with genotypes on just 15 progeny with no dam genotypes used. It should, however, be noted that all parentage conflicts were removed in the present study because the true genotypes of the sires were known. In real life, however, parentage conflicts may not be easily detected between the genotyped progeny and non-genotyped sires and therefore falsely assuming individuals are the progeny of a given sire could contribute to a reduction in accuracy of imputation.
Acknowledgements
Financial support from the Irish Department of Agriculture, Stimulus Research Fund project OVIGEN is gratefully acknowledged.
Supplementary Material
To view supplementary material for this article, please visit https://doi.org/10.1017/S1751731117001653