I. INTRODUCTION
The large elastic limit, the strength close to the theoretical limit, the excellent magnetic properties, and the good corrosion resistance of bulk metallic glasses (BMGs) make them promising candidates for a variety of applications such as micro-geared motor parts, pressure sensors, Coriolis flow meters, power inductors, and coating materials. Reference Inoue and Takeuchi1 However, the main limitation of these materials is their reduced macroscopic ductility at room temperature, resulting from an inhomogeneous deformation concentrated in narrow shear bands. Reference Schuh, Hufnagel and Ramamurty2
The poor ductility can be overcome by the incorporation of a ductile second phase in the glassy matrix to form composites, which exhibit a better balance between strength and ductility. Different types of BMG composites have been developed to date, Reference Eckert, Das, Pauly and Duhamel3 but considerable plastic strain during tensile or bending tests has only been obtained for composites with in situ formation of the second phase during solidification. Reference Hofmann, Suh, Wiest, Duan, Lind, Demetriou and Johnson4,Reference Wu, Xiao, Chen, Liu and Lu5
Among these in situ composites, significant tensile ductility has been observed only in two types of alloys so far: TiZrBe-based Reference Hofmann, Suh, Wiest, Duan, Lind, Demetriou and Johnson4,Reference Hofmann, Suh, Wiest, Lind, Demetriou and Johnson6 and shape memory BMG composites. Reference Das, Pauly, Boström, Durst, Göken and Eckert7,Reference Pauly8 The former precipitates dendrites of the cubic β-(Ti,Zr) phase in the glass matrix, whereas the latter combines spherical precipitates of a cubic shape memory phase within the glass. The shape memory BMG composites have certain advantages over the TiZrBe-based composites such as the absence of Be, which is a toxic element, and exhibit a strong work-hardening behavior linked to the presence of the shape memory phase.
The shape memory BMG composites are from two families: CuZr- Reference Das, Pauly, Boström, Durst, Göken and Eckert7 and TiCu-based Reference Gargarella, Pauly, Song, Hu, Barekar, Samadi Khoshkhoo, Teresiak, Wendrock, Kühn, Ruffing, Kerscher and Eckert9 alloys. Although the former has been systematically investigated, Reference Das, Pauly, Boström, Durst, Göken and Eckert7,Reference Pauly8,Reference Pauly, Gorantla, Wang, Kühn and Eckert10–Reference Song, Pauly, Zhang, Li, Gorantla, Narayanan, Kühn, Gemming and Eckert12 the latter is still not well understood. Reference Gargarella, Pauly, Song, Hu, Barekar, Samadi Khoshkhoo, Teresiak, Wendrock, Kühn, Ruffing, Kerscher and Eckert9 These two families of alloys are very similar in some aspects such as phase formation and microstructure (both of them form shape memory bulk metallic glass composites consisting of spherical precipitates of a cubic B2-type structure and glass Reference Pauly, Liu, Wang, Kühn, Mattern and Eckert11 ) and have similar chemical elements (Ti and/or Zr and Cu and/or Ni).
The effect of additions of different elements in CuZr-based alloys has been extensively investigated. Reference Song, Pauly, Zhang, Li, Gorantla, Narayanan, Kühn, Gemming and Eckert12–Reference Pauly, Das, Bednarcik, Mattern, Kim, Kim and Eckert15 Co additions to CuZr-based shape memory BMG composites are associated with a decrease in glass-forming ability (GFA), Reference Kosiba, Gargarella, Pauly, Kuhn and Eckert16 which is connected with an increasing thermal stability of the B2-CuZr phase and a lower stability of the liquid. Reference Javid, Mattern, Pauly and Eckert13,Reference Song, Pauly, Zhang, Gargarella, Li, Barekar, Kühn, Stoica and Eckert17 The substitution of Cu for Co in B2-CuZr has also been reported to decrease the stacking fault energy and consequently to promote the twinning propensity, which improves the ductility of CuZr-based shape memory bulk metallic glass composites. Reference Wu, Zhou, Song, Wang, Zhang, Ma, Wang and Lu18 It is worth investigating if similar effects on the addition of Co, e.g., increased stability of the B2 phase, decrease in GFA, and improved deformability, can also be observed for TiCu-based alloys.
The pseudo-binary TiCu–TiNi phase diagram reveals that the B2-Ti(Ni,Cu) phase undergoes martensitic transformation (MT) to the orthorhombic B19–Ti(Ni,Cu) structure during cooling at a temperature slightly above the room temperature (around 50 °C). Reference Cacciamani, Schuster, Effenberg and Ilyenko19 It was also observed that this transformation can also occur during deformation. Reference Gargarella, Pauly, Samadi Khoshkhoo, Kühn and Eckert20 Yet, the effect of Co on the MT of TiCu-based alloys was also not investigated so far.
The aim of the present work is to investigate the influence of Co additions on the phase formation, thermal stability, and mechanical properties of TiCu-based alloys. Six compositions with different amounts of Co were prepared by suction casting and investigated using X-ray diffraction (XRD), differential scanning calorimetry, dilatometry, optical and electron scanning microscopy, compression tests, and hardness.
II. EXPERIMENTAL PROCEDURE
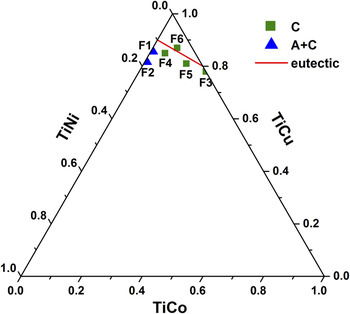
Ingots of six compositions, Ti50Cu43Ni7 (F1), Ti50Cu41Ni9 (F2), Ti50Cu39Co11 (F3), Ti50Cu42.5Ni5Co2.5 (F4), Ti50Cu40.5Ni2.5Co7 (F5), and Ti50Cu43.5Ni2.5Co4 (F6) (Fig. 1 and Table I), were prepared by arc melting elements with high purity (>99.5%) in a Ti-gettered Ar atmosphere using an Edmund Bühler arc melter (Edmund Bühler GmbH, Hechingen, Germany). Prior to melting, the elements were cleaned using acid solutions. These ingots were used to prepare rods with 2 mm diameter and 70 mm length by Cu-mold suction casting using an EDG Discovery (EDG Ltda, São Carlos, Brazil). The investigated compositions were selected near the eutectic region of the TiCu–TiCo–TiNi pseudo-ternary phase diagram (Fig. 1) because TiCu-rich systems strictly follow the empirical rule proposed by Inoue, Reference Inoue21 which states that the best GFA occurs around eutectic regions. Reference Men, Pang and Zhang22–Reference Wang, Ma and Xu24
The following compositions were selected for this study: F1 (Ti50Cu43Ni7), F2 (Ti50Cu41Ni9), F3 (Ti50Cu39Co11), F4 (Ti50Cu42.5Ni5Co2.5), F5 (Ti50Cu40.5Ni2.5Co7), and F6 (Ti50Cu43.5Ni2.5Co4). The phase formation and microstructure of F1 and F2 were previously investigated (see Ref. Reference Gargarella, Pauly, Song, Hu, Barekar, Samadi Khoshkhoo, Teresiak, Wendrock, Kühn, Ruffing, Kerscher and Eckert9). The triangles indicate composites consisting of glass and crystals and the squares indicate fully crystalline samples (A: amorphous, C: crystalline). The eutetic compositions Reference Lutskaya and Alisova26 are also indicated in the figure by a straight line.

Composition of the B2 phase in the different alloys measured by EDX, the austenite start transformation temperature (A s) measured by dilatometry and by DSC, the valence electron concentration c v and the number of valence electrons per atom e v/a of the B2 phase. The typical error for the EDX measurements is ±0.5 at.%.

The rods were characterized by XRD using a STOE STADI P XRD (STOE & Cie GmbH, Darmstadt, Germany) with an Mo-source (
 ${\lambda _{{{\rm{K}}_{\alpha {\rm{1}}}}}}$
= 0.7093 Å) in transmission mode. The glass transition and crystallization phenomena were studied at a heating rate of 30 K/min and the MT was analyzed at heating and cooling rates of 10 K/min. All measurements were carried out in an argon atmosphere using a Diamond Pyris Perkin–Elmer differential scanning calorimeter (DSC; PerkinElmer Instruments, Shelton, Connecticut).
To get more information about the MT, dilatometry studies were carried out at a heating and cooling rate of 10 K/min using a Netzsch CC 200 LT dilatometer (NETZSCH-Gerätebau GmbH, Selb, Germany) in the temperature range of 148–423 K. Rods with 2 mm diameter and ∼25 mm length were used. Their top and bottom surfaces were grounded and polished before the experiments, and their coplanarity was confirmed with a caliper.
The rods were divided into two parts, named here as middle and bottom, since the locally slightly different cooling rate may cause differences in the microstructure along the rod length, Reference Barekar, Pauly, Kumar, Kühn, Dhindaw and Eckert25 and their microstructure was studied by scanning electron microscopy (SEM) using an SEM Zeiss Gemini 1530 (Carl Zeiss Microscopy GmbH, Jena, Germany). The compositions of the different phases were measured by energy-dispersive X-ray (EDX) analysis using a Bruker Xflash 4010 spectrometer (Bruker Corporation, Billerica, Massachusetts) attached to the SEM.
The mechanical properties were evaluated by means of compression tests using an INSTRON 5869 (INSTRON, Norwood, Massachusetts) at a constant deformation rate of 0.0001 s−1 and the deformation was measured using a laser extensometer Fiedler Optoelektronik (Fiedler Optoelektronik GmbH, Lützen, Germany). The volume fraction of phases in each sample was measured using the systematic manual point count method (ASTM E 562-08 standard).
DSC and microscopy results for the 2 mm diameter rods of alloys Ti50Cu43Ni7 (F1) and Ti50Cu41Ni9 (F2) were already published (see Ref. Reference Gargarella, Pauly, Song, Hu, Barekar, Samadi Khoshkhoo, Teresiak, Wendrock, Kühn, Ruffing, Kerscher and Eckert9) and for this reason, they will not be shown here.
III. RESULTS AND DISCUSSION
A. Phase formation and thermal stability
The alloys investigated are depicted in the diagram in Fig. 1. The red line represents the eutectic compositions of the pseudo-ternary phase diagram of TiCu–TiNi–TiCo. Reference Lutskaya and Alisova26 The figure also summarizes the DSC results. These results (not shown here) revealed that crystallization peaks occur only for alloys F1 (Ti50Cu43Ni7) and F2 (Ti50Cu41Ni9) (see Ref. Reference Gargarella, Pauly, Song, Hu, Barekar, Samadi Khoshkhoo, Teresiak, Wendrock, Kühn, Ruffing, Kerscher and Eckert9), with an amount of amorphous phase around 10 vol%. The 2 mm diameter rods of other compositions are fully crystalline, as indicated in Fig. 1. These results already suggest that the addition of Co decreases the GFA, similar as observed for CuZr-based alloys. Reference Kosiba, Gargarella, Pauly, Kuhn and Eckert16
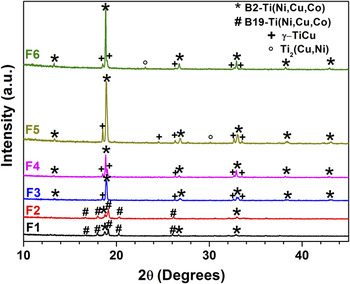
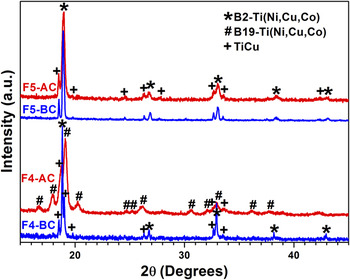
To investigate the microstructure and phase formation, these samples were further checked by XRD and SEM. The XRD results are depicted in Fig. 2. Cubic B2 Ti(Ni,Cu,Co) and tetragonal γ-TiCu phases are detected in all samples. For the samples without Co (F1 and F2), orthorhombic B19 Ti(Cu,Ni,Co) also forms in contrast with the Co-added alloys (F3 to F6), where only B2 and γ-TiCu phases occur, which can be inferred by the different peak intensities and peak shapes.
XRD results of the alloys indicated in Fig. 1 (rod/middle part): F1 (Ti50Cu43Ni7), F2 (Ti50Cu41Ni9), F3 (Ti50Cu39Co11), F4 (Ti50Cu42.5Ni5Co2.5), F5 (Ti50Cu40.5Ni2.5Co7), and F6 (Ti50Cu43.5Ni2.5Co4). No martensite (B19) was detected for the alloys with Co (F3 to F6). This suggests that B2 Ti(Cu,Ni,Co) is stabilized by the Co additions.

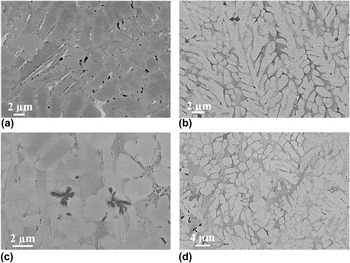
The microstructures of the Ti50Cu43Ni7 and Ti50Cu41Ni9 rods were already described in Ref. Reference Gargarella, Pauly, Song, Hu, Barekar, Samadi Khoshkhoo, Teresiak, Wendrock, Kühn, Ruffing, Kerscher and Eckert9: B2 Ti(Cu,Ni) dendrites are formed together with the γ-TiCu phase around the center region of the rods, whereas martensite is formed in the outer surface region together with the glass. The backscattered electron images of other samples are shown in Fig. 3. A similar phase formation is seen in the case of the F3, F4, F5, and F6 samples, and a similar microstructure was observed for the middle and bottom part of each rod. Dendrites of the B2 phase are developed together with the γ-TiCu. Black precipitates of the Ti2Ni phase are also seen (Fig. 3) and their composition was measured to be Ti62Cu26Co5Ni7 in the Ti50Cu42.5Ni5Co2.5 alloy (F4). The B2 and γ-TiCu phases are expected to form as predicted by the equilibrium phase diagram Reference Lutskaya and Alisova26 in contrast to the “Big Cube” phase, Ti2Ni (space group Fd3m). This phase can dissolve a large amount of oxygen Reference Mueller and Knott27 and is stabilized by the presence of oxygen, Reference Pauly8 as is commonly seen in rapid solidified TiCu-based alloys.
Microstructure of (a) F3 (Ti50Cu39Co11), (b) F4 (Ti50Cu42.5Ni5Co2.5), (c) F5 (Ti50Cu40.5Ni2.5Co7), and (d) F6 (Ti50Cu43.5Ni2.5Co4) rods (middle part). Dendrites of the B2 phase are observed together with γ-TiCu and black Ti2Ni precipitates.

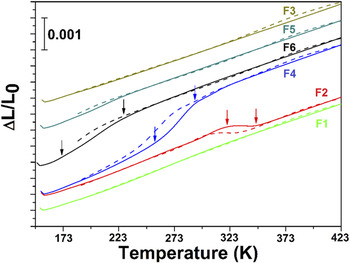
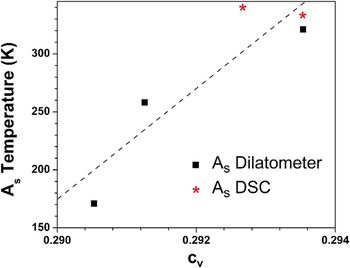
Dilatometry studies were also carried out in a temperature range of 148–423 K (Fig. 4) to measure the MT temperature of these alloys. A clear MT was observed only for the F2, F4, and F6 alloys with an martensite-to-austenite transformation temperature (A s) around 321 ± 2, 258 ± 2, and 171 ± 2 K, respectively. The transformation observed in two heating–cooling cycles shows a perfect reversibility, without changes in the transformation characteristics. Although no MT was observed for F1 by dilatometry, a small transformation peak can be seen by DSC (see Ref. Reference Gargarella, Pauly, Song, Hu, Barekar, Samadi Khoshkhoo, Teresiak, Wendrock, Kühn, Ruffing, Kerscher and Eckert9) at 340 K (A s). A small difference was observed comparing the A s measured by DSC and the dilatometry for F2 (Ti50Cu41Ni9), which is probably caused by the different nature of these tests. A s was measured as 333 ± 2 K by DSC (see Ref. Reference Gargarella, Pauly, Song, Hu, Barekar, Samadi Khoshkhoo, Teresiak, Wendrock, Kühn, Ruffing, Kerscher and Eckert9) and as 321 ± 2 K by dilatometry (Table I). It was not possible to detect the MT of the Co-added samples by DSC probably because the transformation temperatures were below the DSC temperature limit.
Dilatometry of the different Ti–Cu–Ni–Co rods (middle part). The full lines correspond to the first heating whereas the dashed lines correspond to the second cooling. The martensite-to-austenite start (A s) and final (A f) transformation temperatures are indicated in the figure by arrows, respectively.

The linear thermal expansion coefficient, αl, ranges between 1.17 and 1.23 × 10⁻⁵ K−1 (in the case of alloys, which show a MT, αl was measured at the higher temperatures) in the range usually observed for TiCu-based alloys. Reference Carow-Watamura, Louzguine, Takeuchi, Kawazoe, Carow-Watamura and Yu28,29
It has been demonstrated that the MT temperatures of TiNi-based shape memory alloys depend on the number (e v/a) and concentration (c v) of valence electrons of the alloys. Reference Zarinejad and Liu30 The e v/a and c v values can be calculated using equations:
 $${{{e_{\rm{v}}}} \over a} = \sum\limits_{i = 0}^n {{f_i}e_{\rm{v}}^i} \quad ,$$
 $${c_{\rm{v}}} = {{\sum\limits_{i = 0}^n {{f_i}e_{\rm{v}}^i} } \over {\sum\limits_{i = 0}^n {{f_i}{Z_i}} }}\quad ,$$
where f
i
,
 $e_{\rm{v}}^i$
, and Z
i
are the atomic fraction, number of valence electrons, and atomic number of each element i of the alloy, respectively. The explanation for this correlation is that the valence electrons act as glue that keeps the other electrons and the kernel cohesive, generating the metallic bonds. Therefore, the electronic configuration of the alloy will influence its physical properties.
Reference Zarinejad and Liu30
A larger c
v means a lower transformation temperature for TiNi-based alloys
Reference Zarinejad and Liu30
as a result of the changes in the elastic constants.
Reference Otsuka and Ren31
Since this transformation occurs only in the B2 phase, it should be investigated if e v/a and c v calculated based on the composition of this phase instead of the composition of the alloy (as pointed in Ref. Reference Zarinejad and Liu30) scales with the transformation temperatures. Table I shows the compositions of the B2 phase in the different alloys measured by EDX together with the values of A s, e v/a, and c v. One can see that with the increasing c v and e v/a, the transformation temperature also seems to increase (Table I and Fig. 5) in an opposite trend as observed for other TiNi-based alloys. Reference Zarinejad and Liu30 The reasons for this behavior are not completely clear.
Concentration of valence electrons of the B2 phase (c v) and the martensite-to-austenite transformation temperature (A s, Table II). A s increases with increasing c v.

It is important to mention here that although the electronic structure of the B2 phase has an important influence in the phase transformation, other microestrutural features, such as grain sizes, precipitation, presence of other phases, texture, etc., will also affect the transformation characteristics. Reference Otsuka and Ren31
B. Mechanical properties
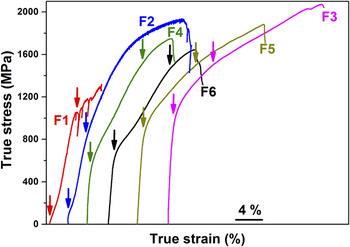
The compression test results for the 2 mm diameter rods are displayed in Fig. 6. The substitution of Ni by Co increases the yield strength (Table II). Ti50Cu41Ni9 (F2) exhibits a very low yield strength around 110 ± 50 MPa in contrast to Ti50Cu39Co11 (F3), which shows a significantly higher yield strength of 970 ± 50 MPa combined with a high fracture strain of 23% (Table II). A “double yielding” can be observed (indicated by a second arrow in the stress–strain curves of Fig. 6), as usually seen for shape memory alloys, Reference Otsuka and Ren31 and it is connected with the presence of the B2 or B19 Ti(Ni,Cu,Co) phases. Both phases may undergo a transformation during deformation, which is responsible for the characteristic “double yielding” behavior. Reference Otsuka and Ren31 The cubic B2 phase transforms to the B19 phase during deformation and the orthorhombic B19 undergoes martensite reorientation. Reference Otsuka and Ren31
Compression test results of F1–F6 rods (middle part, compositions given in Table I). The yield strength increases with increasing amount of Co from F1 = F2 < F4 < F6 < F5 < F3. The yield strength is indicated by the first arrow, whereas the second arrow in the curve of F4 and F6 indicates the “second” yielding.

Summary of the phases present in each sample, volume fraction of B2 phase estimated by image analysis, and mechanical properties of the 2 mm diameter rods under compressive loading. B2 and B19 refers to the cubic B2 Ti(Cu,Ni,Co) and orthorhombic B19 Ti(Cu,Ni,Co) phases, respectively. The Ti2Ni phase was not considered because its low volume fraction (<2%).

The XRD patterns taken before and after the deformation of alloys F4 and F5 are displayed in Fig. 7 (the F4 and F5 samples were deformed 12% and 20%, respectively). These results show that the B2 phase transforms to B19 during deformation in the case of F4, but no clear evidence is seen for F5. This difference should also be connected with the effect of the addition of Co since these two alloys have similar microstructure and phase formation [Figs. 3(b) and 3(c) and Table II]. The addition of Co decreases e v/a and c v of the B2 phase as was discussed previously, which shifts the MT to lower temperatures (Table I and Fig. 5). The fact that alloy F5 (Ti50Cu40.5Ni2.5Co7) does not exhibit a MT during deformation like alloy F4 (Ti50Cu42.5Ni5Co2.5) shows that the larger amount of Co in the former alloy may also impede the MT during deformation because larger stresses are required.
XRD results for the F4 (Ti50Cu42.5Ni5Co2.5) and F5 (Ti50Cu40.5Ni2.5Co7) rods (middle part) before (BC) and after compression (AC). The B2 phase in alloy F4 partially transforms to the B19 phase during deformation, which is not observed for alloy F5.

The low strength of F1 and F2 (Fig. 6) seems to be also connected with the presence of the martensitic B19 phase. The shear stress needed to start the reorientation of the martensite by means of twinning/detwinning is very low (0.11 and 0.17 for the {011}o compound or {111}o Type-I-twinning, respectively Reference Otsuka and Ren31 ) and this explains the low yield strength observed. Stress drops are also seen in the stress–strain curve of alloy F1 (Fig. 6), and they are connected with the brittleness of the amorphous phase formed at the outer surface of the 2 mm diameter rod. Reference Gargarella, Pauly, Song, Hu, Barekar, Samadi Khoshkhoo, Teresiak, Wendrock, Kühn, Ruffing, Kerscher and Eckert9 During deformation, the outer part of the rod cracks, which causes a stress drop, as registered in the stress–strain curve (Fig. 6).
The mechanical behavior depends on certain factors such as the presence of macroscopic defects (e.g., pores), the phases formed, their amount, size and morphology, and also their composition. For instance, the alloys F3 to F6 show an almost identical phase formation (Fig. 3 and Table II), with a similar volume fraction of phases [the amount of B2 phase ranges between 70 and 78 vol%, as estimated by image analyses (Table II)] and size (Fig. 3), but their mechanical behavior is completely different nonetheless, which may be connected with the different composition especially of the B2 phase.
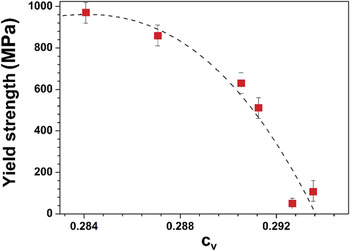
This compositional effect is depicted in Fig. 8, which correlates the yield strength of the present Ti–Cu-based alloys with the number and concentration of the valence electrons of the B2 phase. Reference Zarinejad and Liu30 Figure 8 shows that the yield strength of the alloys decreases with increasing the concentration of valence electrons (c v) in the B2 phase [a similar fashion was observed considering the number of valence electrons (e v/a)]. A high c v or e v/a means a larger amount of free electrons in the B2 atomic structure, which allows the atoms to move past one another with little difficulty. Reference Gschneidner, Ji, Wang, Ho, Russell, Mudryk, Becker and Larson32 This may facilitate the interface movement during transformation and could explain the decrease in yield strength with increasing c v, as observed in Fig. 8.

As was discussed, the addition of Co decreases the MT temperature during thermal cycling and makes the stress-induced MT more difficult to occur. Considering the similarities of phase formation and microstructure of the Co-added alloys, the significant difference in mechanical behavior can not only be explained by the changes in the transformation behavior of the B2 phase, which is the main phase in the alloys (ranging from 70 to 80 vol%), but also by the solid solution strength caused by the Co addition. Both mechanisms affect not only the strength but also the ductility and strain hardening of these alloys.
IV. CONCLUSIONS
The results show that the addition of Co stabilizes the B2 Ti(Cu,Ni,Co) phase at room temperature, which decreases the GFA of Ti–Cu–Ni alloys. The Co-added alloys show an almost identical phase formation and microstructure, but their mechanical behavior is completely different nonetheless, which is mainly connected with the different composition of the B2 phase. The addition of Co causes solid solution strength and makes the stress-induced MT of this phase more difficult, which increases the yield strength when a higher amount of Co is added and promotes a different work-hardening behavior. A clear correlation between c v or e v/a of the B2 phase and the yield strength was observed, which exemplify the influence of composition in the mechanical behavior of these alloys.
ACKNOWLEDGMENTS
The authors would like to thank S. Donath, M. Frey, U. Wilke, B. Bartusch, and D. Lohse for technical assistance and K. Song, E. Mazzer, R.D. Cava, and F.A. Javid for stimulating technical discussions. Financial support through the German Science Foundation (DFG) under the Leibniz Program (Grant No. EC 111/26-1), the European Research Council under the ERC Advanced Grant INTELHYB (Grant No. ERC-2013-ADG-340025), the São Paulo Research Foundation (FAPESP) under the Tematic Project No. 2013/05987-8 and DFG and Brazil’s Federal Agency for the Support and Improvement of Higher Education (CAPES) under the program Brazilian-German Collaborative Research Initiative on Manufacturing Technology (BRAGECRIM, EC111/28-1) are gratefully acknowledged.