1. INTRODUCTION
Autonomous navigation of flight vehicles remains a challenging problem. The Inertial Navigation system (INS) is an autonomous single source for all navigation data, capable of continuously updating the position, velocity and attitude of the vehicle, but has an unbounded growth in position and velocity errors. More accurate sensors can improve INS accuracy but this is usually expensive. Another approach is the Integrated Navigation System. The best-known technique is INS/GPS (Global Positioning System) integrated navigation. GPS can give accurate position information when satellites are visible. However, GPS signals are vulnerable to interference. When GPS measurements are unavailable, INS begins to drift out of calibration. In some cases moderate accuracy is acceptable for air navigation, such as a flight vehicle during its cruise phase. Therefore, an alternative approach is to use an integrated navigation system that includes a geophysical navigation system to aid the INS in performing at the desired accuracy level. There are two principal geophysical fields that are traditionally employed in INS: the terrain field and geomagnetic field (Li et al., Reference Li, Lu, Yin and Huang2011; Zheng et al., Reference Zheng, Wang, Wu, Chai and Wang2013). The INS/terrain approach has been reported to be successful in many applications. However, it is difficult to apply when the vehicle flies over flatlands, such as seas and deserts. In such areas, it is difficult or impossible for a vehicle to obtain its position with a terrain map. In addition, since the radio signals for height measurement can also be interfered with, making the vehicle vulnerable, the INS/terrain approach does not result in a completely autonomous navigation system.
Using the geomagnetic field properties of the planet for air navigation is a new independent navigation method. This field is already well mapped in geophysical system coordinates, and it can be considered as a solid source of guidance and navigation information (Goldenberg, Reference Goldenberg2006). The geomagnetic field is currently used in a wide range of commercial and military applications. It has been used in space to determine the orientation of a vehicle and can provide both attitude control and attitude perturbing torques. The United States developed a geomagnetic navigation system in 2003, and accuracy has been demonstrated as better than 30 m during flight testing (Zhou et al., Reference Zhou, Ge, Shi and Liu2008).
Geomagnetic measurements are easily influenced by outside interferential magnetic fields and it can be difficult to obtain a geomagnetic map for the whole flight range, so sole use may produce problems such as multi-value solutions or low reliability. The integrated navigation system has two advantages: firstly, INS provides a reference position for geomagnetic navigation to improve matching efficiency and accuracy; secondly, the location results of geomagnetic navigation can effectively improve the precision of the INS. Thus the flight vehicle can obtain its position, velocity and attitude using geophysical information without access to external sources of position such as GPS. Furthermore, a geomagnetic navigation system is available in all weathers, over all terrain, including areas such as sea and desert. In comparison with other active navigation systems, geomagnetic navigation works with radio-passive apparatus, thereby improving the resistance of the vehicle to radio intelligence and interference, and giving the flight vehicle a completely autonomous navigation system. The geomagnetic field is passive and difficult to alter. Therefore, interest in the development of geomagnetic navigation for flight vehicles has been increasing.
Previous research has suggested two methods of utilising geomagnetic data for navigation: geomagnetic matching and geomagnetic filtering (Guo et al., Reference Guo, Cai and Hu2013; Lin et al., Reference Lin, Yan and Tong2007; Ejaz et al., Reference Ejaz, Iqbal, Ahsarr and Nawaz2009). The objective of this research is to extract features and evaluate a geomagnetic matching navigation scheme by using real geomagnetic data. This paper describes an algorithm that uses entropy as an assisting feature, and then uses it for recognition of particular regions of the geomagnetic field. The input for this algorithm is the intensity of geomagnetic field.
The geomagnetic field is one of the earth vector fields, which is composed of three parts, the main field, the anomaly field and the disturbing field. The largest contributor to the field is the main magnetic field, which ranges in magnitude from 20,000 nT at the geomagnetic equator to about 65,000 nT at the poles, accounting for more than 95% of the total intensity. The main field is produced by the centrosphere and is well modelled by the International Geomagnetic Reference Field (IGRF) and the World Magnetic Model (WMM). The anomaly field is produced by magnetized crustal rock, accounting for more than 4% of the total intensity. The disturbing magnetic field, which is produced by the magnetic layer and ionosphere, varies strongly over time. Considering space distribution features, seven elements are often used to describe the geomagnetic field: the intensity of the total field F, horizontal component H, north component X, east component Y, vertical component Z, declination D and inclination I. In flight vehicle navigation it is necessary to determine the current location of the vehicle using information from the surrounding geomagnetic field. However, not all these components have enough distinct feature points, thus some features which are easy to match and recognize should be found.
The Goodrich company of America used three-dimensional geomagnetism vector matching to realize high-precision navigation and location on a plane. Psiaki and Huang (Reference Psiaki and Huang1993) used the intensity of the total field F as reference navigation information to achieve orbit determination with the employment of an Extended Kalman filter (EKF) and Batch Least-Squares filter. Qiao et al. (Reference Qiao, Wang and Zhang2007) selected F as the most appropriate feature for matching. They proposed several critical factors in the selection of features for matching according to theoretical analyses. The comprehensive analyses were carried out using the IGRF10 and WMM2005, and the selection result for geomagnetic matching was the intensity of the total field. Wang et al. (Reference Wang, Wang, Zhang and Qiao2009) extended this work to extract a new feature from the intensity of the total field. They chose total geomagnetic intensity gradient amplitude as the matching feature, and the results indicated that the gradient reference map produced abundant matching features, large variation ranges and the matching probability is improved when compared to that produced with total magnetic intensity as the matching feature.
Two crucial aspects of geomagnetic navigation will restrict its potential application: high accuracy mapping and precision measurement on board the aircraft. Solving these problems needs precision measurement. Precision geomagnetic measurement is still a challenging problem; geomagnetic stations, ships, aircraft and satellites can obtain the data. In this paper, the real geomagnetic field data of areas in Inner Mongolia are used for experiments, which were obtained by magnetometers on board aircraft. The aircraft flies along the planned measuring line and collects the data at different positions. The data are stored as measuring sets. Such sets do not always have the same number of set points, so they are converted into a rectangular array of intensity values. Thus a regional geomagnetic map can be obtained from the data. As it is real data for the region, the map has enough detail for geomagnetic navigation. To simulate geomagnetic matching as realistically as possible, the following scenario is assumed. Firstly, intensity data of the whole area of interest are obtained. Secondly, the intensity data for a small sub-region are obtained by the geomagnetometer installed on the flight vehicle. Thirdly, the sampling grid of the geomagnetometer does not coincide with sample positions of the reference terrain data.
Simulation experiments were carried out from the simple to more complicated situations. Firstly, white Gaussian noise was added into the reference data as the measuring set to evaluate the validity of the new feature. Secondly, the real data measured at two different times in the same area are separately used as reference data and measuring set to fulfil the matching procedure. This situation is quite close to the real situation when using geomagnetic information for matching. Finally, the new feature was evaluated from several aspects.
The organization of this paper is as follows. Section 2 describes the disputable factors in the selection of features for matching and extracts new features for matching from the real geomagnetic field data. Section 3 describes the matching algorithms that are based on Mean Absolute Difference (MAD). Section 4 presents the simulation studies that evaluate the performance of the new feature. The last section presents a summary.
2. FEATURE EXTRACTION
The geomagnetic field is subject to temporal variations at all times. The variations cover a huge range of timescales, from fractions of seconds to geological time spans. Due to its local and regional variability, the feature selection should take into account the following rules.
(1) Feature differs in different areas. This rule is the most important when choosing a feature for matching. Using features with larger relative variations always leads to better positioning results.
(2) To make a more precise reference map of the field, the long period variation of the feature should be stable. The key long period variation can be set to annual variation.
(3) Short term disturbance of the feature will not influence the matching results greatly. As described above, the geomagnetic field has various types of short-term variation. So to obtain better matching results, the short-term disturbance should be controlled to an acceptable degree.
(4) It is difficult to obtain accurate geomagnetic field information from a flying vehicle and thus the feature should be easily measurable to obtain the best feature information.
According to the second rule, the horizontal component H is not appropriate for use as a matching feature since it changes significantly in a magnetic storm. It follows from the data in WMM2010 that both the north component X and the east component Y vary less drastically than the total intensity of geomagnetic field F in different areas and the vertical component Z has a relatively large long-term disturbance. According to rules 3 and 1, all three of these components are unsuitable. The declination D and the inclination I are not easy to measure precisely by a vehicle-mounted magnetometer. Thus F is the most popular feature in geomagnetic matching.
In this paper, some improvements of feature extraction for geomagnetic matching are developed to enhance the matching performance of F. Geomagnetic entropy is extracted from the total intensity of geomagnetic field as a new feature for matching.
Entropy was first used in thermodynamics as a highly versatile physical quantity. It has been widely used in many fields as a criterion of mean information content since Shannon introduced it to information theory. Geomagnetic entropy reflects the quantity of information in the reference area. Define a probability vector P(k) that describes F, and suppose the size of one set of the measurement is L×1, where L is the number of the grids according to the length of the measuring set. f i(k) is the intensity of the ith measurement point of the number of the kth set. So P(k)=(P 1(k),…,P L(k))′ is obtained by
 $$p_i (k) = \displaystyle{{\,f_i (k)} \over {\sum {\,f_i (k)}}}, \;i = 1,2, \ldots, L$$
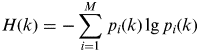
The local entropy identifier H(k) for each k is constructed:
 $$H(k) = - \sum\limits_{i = 1}^M {\,p_i (k)\,{\rm lg}{\kern 1pt}\, p_i (k)} $$
When P(k)=(0,…,1,…0)′, H(k)=0, this extreme means that the probability distribution differences achieve an optimum state, and the matching navigation system will perform well in such an area. When p 1(k)=p 2(k)=…=p L(k)=1/L, H(k) reaches its maximum value, this means that it is impossible for the matching system to get the correct position information in this area.
From the definition of geomagnetic entropy it is shown that entropy can be used to describe the variable frequency of geomagnetic information. It has two important properties. One is that the entropy can be applied to process and cancel the odd measurement points. The other is that the entropy can restrict the measurement error.
3. MATCHING ALGORITHMS
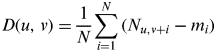
Geomagnetic matching is an autonomous navigation technique to locate the vehicle by correlating INS path profiles to a geomagnetic reference map. As the flight vehicle passes through the reference area of the geomagnetic field, the carried magnetometer gathers a set of geomagnetic measurements and compares this set with various corresponding data sets derived from the reference map. The matched point is used to correct the INS error. The classic matching methods include MAD, MSD (Mean Square Difference), NProd (Normalized product correlation) and algorithms based on Hausdorff distance etc. As the most commonly used algorithm in engineering, the MAD algorithm is selected to evaluate the geomagnetic matching.
 $$D(u,{\kern 1pt} v) = \displaystyle{1 \over N}\sum\limits_{i = 1}^N {(N_{u,v + i} - m_i )} $$
where N u,v+i is the sequence set on the reference map, m i is the measured geomagnetic set, N is the size of the data set. The minimum of the D(u,v) provides the vehicle's location.
The key to a geomagnetic matching system is to design a set of matching algorithms based on the measurement information. Using entropy as the assisting feature, the matching process has two steps. Firstly, the total intensity of geomagnetic field is used in rough matching to get an approximate range that includes the real position of the flight vehicle. Secondly, entropy is used as the feature to achieve precise matching in the previously gained approximate range.
3.1. Rough matching
When the magnetometer has obtained enough geomagnetic information for a measurement set, the set and corresponding sets in reference data are calculated for the rough matching. The MAD is compared between the measurement set and the different reference sets, choosing the sets with the minimum differences. When using MAD for matching, different numbers of grid points are selected for the procedure in order to make the most use of the measurement information. In this paper, we fixed the number of grid points for each measurement set at 20. After getting 20 points, the navigation test is started from 1 to 12 for the first matching, then from 1 to 13 for the second matching, until 1 to 20 at last. So with 20 points, nine matching procedures are developed in all. As they all start from the same point 1, the most frequent result occurred in the nine tests is derived as the final matching result. Thus a relatively smaller region that includes the real position is obtained.
3.2. Precise matching
After rough matching, entropy is applied to achieve precise matching. We compared the measuring set's entropy and the corresponding sets in the sub-region obtained by rough matching, then chose the set which had a relatively close entropy to the final matching result.
4. SIMULATION EXPERIMENTS
In the simulation experiments, two different situations were tested, one (Test 1) in which the measuring set was obtained by adding a white noise or coloured noise to the reference data, and the other (Test 2) in which the data was measured at two different times in the same area and then used as reference data and measuring set.
4.1. Test with New Feature
The flight vehicle with a speed of 300 m/s was flown along the ground of which the reference map of the geomagnetic field has been made. It is generally considered that the vehicle flies along a straight line at a planar surface and maintains an approximately constant height and velocity. Thus its movement can be described in o−xz coordinate. Geomagnetic data were processed into grid form before the simulation experiments, 23 km in length, 16 km in width. The size of the map grid is 500 m×500 m, which is shown in Figure 1. Simulation experiments have been tested in two cases: (a) the total intensity F only; and (b) F with the geomagnetic entropy.
Sketch map of matching paths.

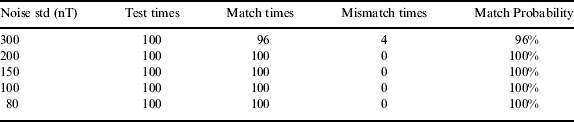
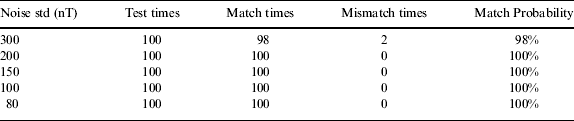
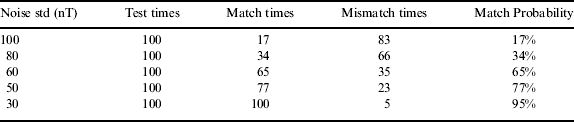
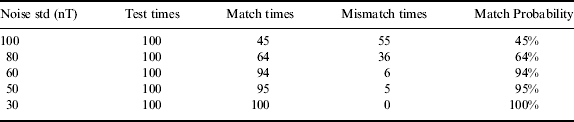
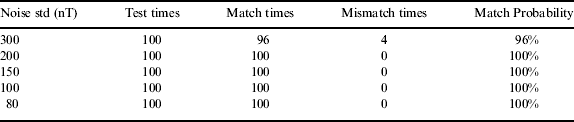
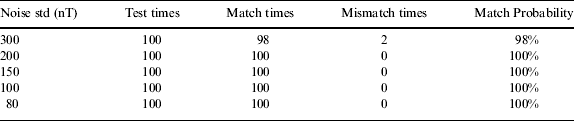
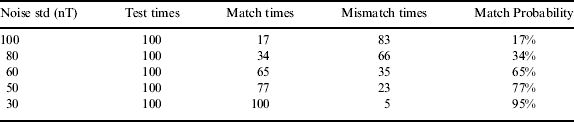
The flight paths were chosen as shown in Figure 1. The magnetic field intensity along with the linear track was recorded and a normal noise was added to simulate the value measured. The feature was tested with a variety of normal noise. The standard variances of the noise are 300nT, 200nT, 150nT, 100nT, 80nT respectively in the simulations of path 1, and they are 100nT, 80nT, 60nT, 50nT, 30nT respectively in the simulations of path 2. The match simulations can be considered to be successful if the position error can be confined in a map grid. Tables 1 to 4 show the results.
Matching results in case (a) path 1.
Matching results in case (b) path 1.
Matching results in case (a) path 2.
Matching results in case (b) path 2.
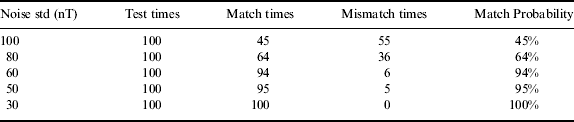
In comparison with the results in Tables 1–4, it was observed that the matching effect is most influenced by the flight path. The results of path 1 show that in areas where magnetic intensity changes drastically, the navigation is more accurate in spite of the relatively strong noise. From Tables 2 and 4, it can be seen that the match possibility is low, and the navigation system is sensitive to measurement noise when the area around the flight path in the reference map is not rough enough.
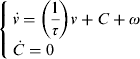
Besides white noise, the geomagnetic disturbance also shows the impact of coloured noise. In this paper, the coloured noise is modelled by a Gaussian Markov process plus a constant disturbance, which is given below
 $$\left\{ {\matrix{ {\dot v = \left( {\displaystyle{1 \over \tau}} \right)v + C + \omega} \cr {\dot C = 0} \cr}} \right.$$
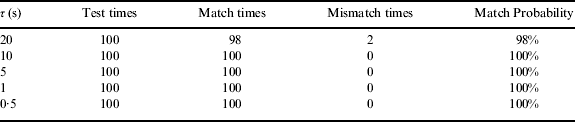
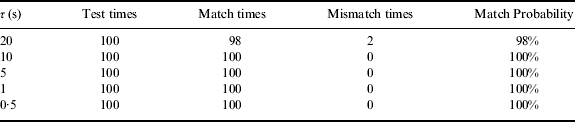
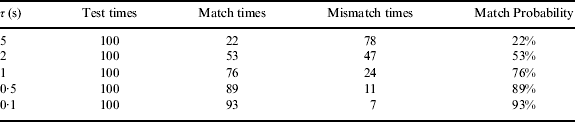
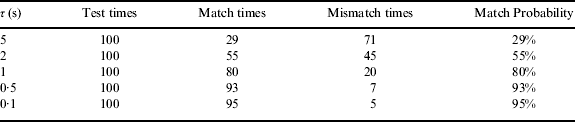
where τ is correlation time, C is constant disturbance and ω is additive white Gaussian noise. Two different simulation experiments have been tested in the same cases as the previous experiments. The standard variance of the white noise and C are 100nT in simulations of path 1, and the correlation times are 0·5 s, 1 s, 5 s, 10 s, 20 s respectively. In the simulations of path 2, both the standard variance of the white noise and C are set as 50nT and the correlation times are 0·1 s, 0·5 s, 1 s, 2 s, 5 s respectively. Tables 5 to 8 show the results.
Matching results of colored noising geomagnetic data in case (a) path 1.
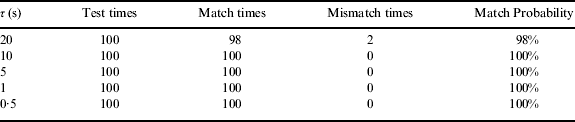
Matching results of colored noising geomagnetic data in case (b) path 1.
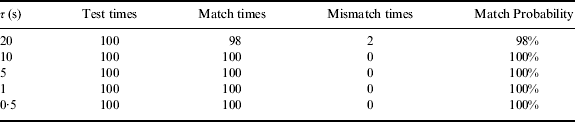
Matching results of colored noising geomagnetic data in case (a) path 2.
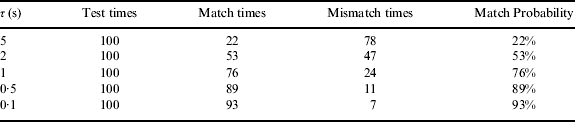
Matching results of colored noising geomagnetic data in case (b) path 2.
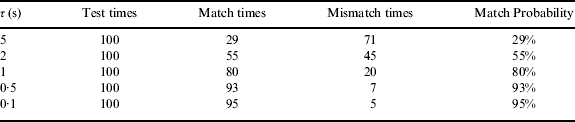
In the coloured noise experiments, the results also show the matching effect is most influenced by the flight path. The results of path 1 show that in areas where magnetic intensity changes drastically, the navigation is more accurate in spite of the change of the τ. From Tables 7 and 8, it can be seen that the match probability decreases when τ increases. The navigation system is very sensitive to τ and the constant disturbance. In comparison with the results in Tables 4 and 8, it can be observed that the positioning is more difficult when the coloured noise exists in areas around path 2.
Tables 1–8 show the navigation effect is improved significantly with the employment of entropy as assisting feature. Especially in path 2, the match probability is higher than results derived from those using only the total intensity as a feature. Furthermore, geomagnetic entropy is easy to calculate and no more measurement information is needed, hence the research results can be applied to engineering.
4.2. Test With Different Measuring Sets
In test 2, the data measured in the same area at different times are used separately as reference data and measuring set to achieve the matching procedure. The area distribution is shown in Figure 2. The data from areas 1, 2 and 4 were measured at one time, and the data in area 3 were measured a year later. The data from areas 1, 2 and 4 are considered as reference information, and the data in area 3 were selected as the measured set. The reference data were processed into grid form for the simulation experiments. The size of the map grid is 100 m×100 m. Every column of the data in area 3 is considered to be a measured set. So in such a situation, there are 21 measured sets in all. The match test is considered to be successful if the position error can be constrained within 200 m. Geomagnetic charts of total intensity in different areas are shown in Figures 3 and 4.
The area distribution.
Geomagnetic chart of total intensity in areas 1, 2 and 4.
Geomagnetic chart of total intensity in area 3.
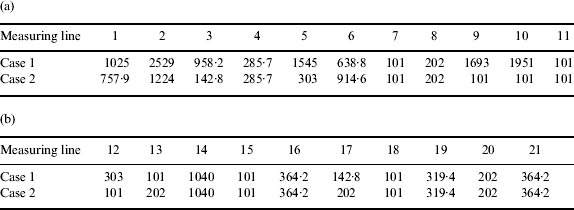
The MAD has been tried with a different measuring line. Initial INS error is Δx 0=1000 m, Δz 0=1000 m. Case 1 uses F as the matching feature, and both F and the geomagnetic entropy are used as matching features in case 2. The positioning error is calculated by
 $$\Delta P = \sqrt {\Delta x^2 + \Delta z^2} $$
The matching results are shown in Table 9.
Matching results of different measuring lines.
Matching results of different measuring lines.
Matching results of different measuring lines (a) 1–11; (b) 12–21.
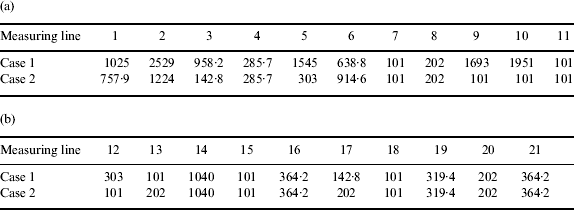
The results show that with the employment of entropy as an assisting feature, the navigation effect is improved significantly. There are 12 measuring sets of which the position error is less than 200 m. 16 of the 21 measuring lines have location errors under 400 m, whereas the results of using F only are 13 of 21 measuring lines less than 400 m. At lines 3, 5, 9 and 10, the improvement is especially significant. Both cases diverge at lines 1, 2, 6 and 14 due to insufficient location information at these lines. Therefore, during path planning, such sub-regions should be avoided.
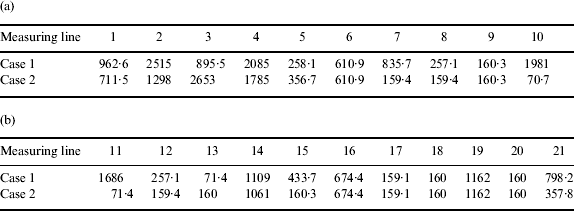
In the second experiment, the original INS position error is changed to Δx 0=1550 m, Δz 0=1550 m. Matching results are shown in Table 10.
Matching results of different measuring lines (a) 1–10; (b) 11–21.
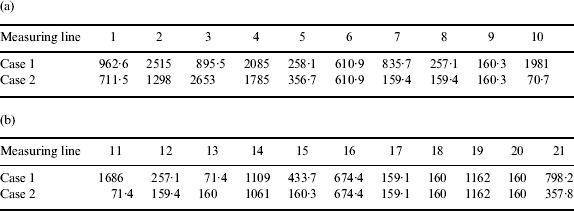
When comparing Tables 9 and 10, it can be observed that the matching results are affected by the original INS error, and the results obtained in Table 10 is worse than in Table 9. However, Table 10 shows that case 2 is much better than case 1. There are 11 measuring sets that can get a relatively good position with position error under 200 m. 13 lines of the 21 measuring lines can get a location error under 400 m, but the number of the lines when using F is only eight. Therefore the entropy is efficient as an assisting feature.
There are many factors that may influence the accuracy of geomagnetic matching, including flight path, initial INS error, space weather, geomagnetic storms and other magnetic disturbances. In this paper, the initial position error and flight path are changed to analyse the new feature's performance. In test 1, the geomagnetic disturbance is considered as Gaussian-type noise. In test 2, some temporal variations are included in the measuring set. It is well known that the geomagnetic field at all times is subject to temporal variations. There are many other geomagnetic disturbances, such as geomagnetic storms. The validity of the matching method in such cases needs to be re-evaluated. The effect of geomagnetic storms will be discussed in future work.
5. CONCLUSION
Geomagnetic entropy has been extracted as a new feature for geomagnetic matching. Using MAD as the measurement function, the performance of the new feature has been tested with a variety of measuring lines and sizes of map grids. With the employment of entropy as the assisting feature, the navigation effect is improved significantly. Match probability is much higher than the results derived from those using only total intensity as the feature especially in cases where the flight vehicle passes through an area without abundant magnetic information. The geomagnetic entropy is easy to calculate and no more measurement information is needed. This system could be used in flight vehicle applications where the system needs moderate accuracy but complete autonomy.
ACKNOWLEDGMENTS
The authors would like to thank China Scholarship Council for its support of his research in the United Kingdom.