




Introduction
Effective communication is a core competency in medical practice, extending well beyond patient–physician interactions to include academic presentations, community leadership, and interdisciplinary advocacy (Ha and Longnecker, Reference Ha and Longnecker2010). Despite the growing emphasis on communication skills training in residency education, training has focused predominantly on clinical consultation settings, with academic presentation skills remaining systematically neglected (Alsaiari et al., Reference Alsaiari, Abushal, Nora, Gusti and Nouri2022; Dansieh et al., Reference Dansieh, Owusu and Seidu2021; Marinho et al., Reference Ferreira Marinho, Mesquita de Medeiros, Côrtes Gama and Caldas Teixeira2016; Tejwani et al., Reference Tejwani, Ha and Isada2016).
Public speaking anxiety (PSA), also known as glossophobia, is among the most prevalent anxiety-related conditions in the general population, and medical trainees are not exempt (Dansieh et al., Reference Dansieh, Owusu and Seidu2021; Marinho et al., Reference Ferreira Marinho, Mesquita de Medeiros, Côrtes Gama and Caldas Teixeira2016). Within medical education, the formal curriculum’s failure to address academic presentation skills constitutes what Eisner termed the ‘null curriculum’ – the knowledge that educational systems choose not to teach, despite its measurable professional consequences (Flinders et al., Reference Flinders, Noddings and Thornton1986). Institutions expect residents to present at conferences, lead grand rounds, and advocate for their specialty, yet provide no structured preparation for these demands.
This study pursued two objectives: to characterise baseline levels and contextual triggers of PSA among family medicine residents and to examine whether a structured, evidence-based intervention was associated with reductions in PSA across cognitive, behavioural, and psychological dimensions. We hypothesised that a theory-grounded single-session intervention would be associated with immediate, measurable short-term reductions in PSAS scores.
Methods
Study design and setting
A quasi-experimental one-group pre-test–post-test design was used. The study was conducted at a tertiary training hospital’s Family Medicine Clinic [Blinded for peer review] during a three-month period. The intervention was delivered as a scheduled educational activity to the entire residency cohort; a control group was not included. The study is reported in accordance with the TREND (Transparent Reporting of Evaluations with Nonrandomized Designs) statement, the CRISP guidelines, and the TIDieR checklist (Des Jarlais et al., Reference Des Jarlais, Lyles and Crepaz2004; Hoffmann et al., Reference Hoffmann, Glasziou, Boutron, Milne, Perera, Moher, Altman, Barbour, Macdonald, Johnston, Lamb, Dixon-Woods, McCulloch, Wyatt, Chan and Michie2014; Phillips et al., Reference Phillips, Sturgiss, Glasziou, olde Hartman, Orkin, Prathivadi, Reeve, Russell and van Weel2023).
Participants
The target population comprised all 253 family medicine residents at the study site. A priori power analysis (OpenEpi; 95% CI, 5% margin of error) indicated a minimum required sample of 153 Dean et al., (Reference Dean, Sullivan and Soe2013). Of 216 residents who provided written informed consent (85.4% participation rate), 17 were excluded due to incomplete questionnaire forms (i.e., one or more items left unanswered in the pre-test or post-test PSAS, rendering subscale scores uninterpretable). Because information on the characteristics of excluded participants was unavailable/incomplete, selection bias related to missing questionnaire data cannot be excluded. The final analytic sample comprised 199 participants. Post-hoc power analysis (G*Power v3.1.9.7; effect size 0.50; α = 0.05) confirmed statistical power >95% (Faul et al., Reference Faul, Erdfelder, Lang and Buchner2007).
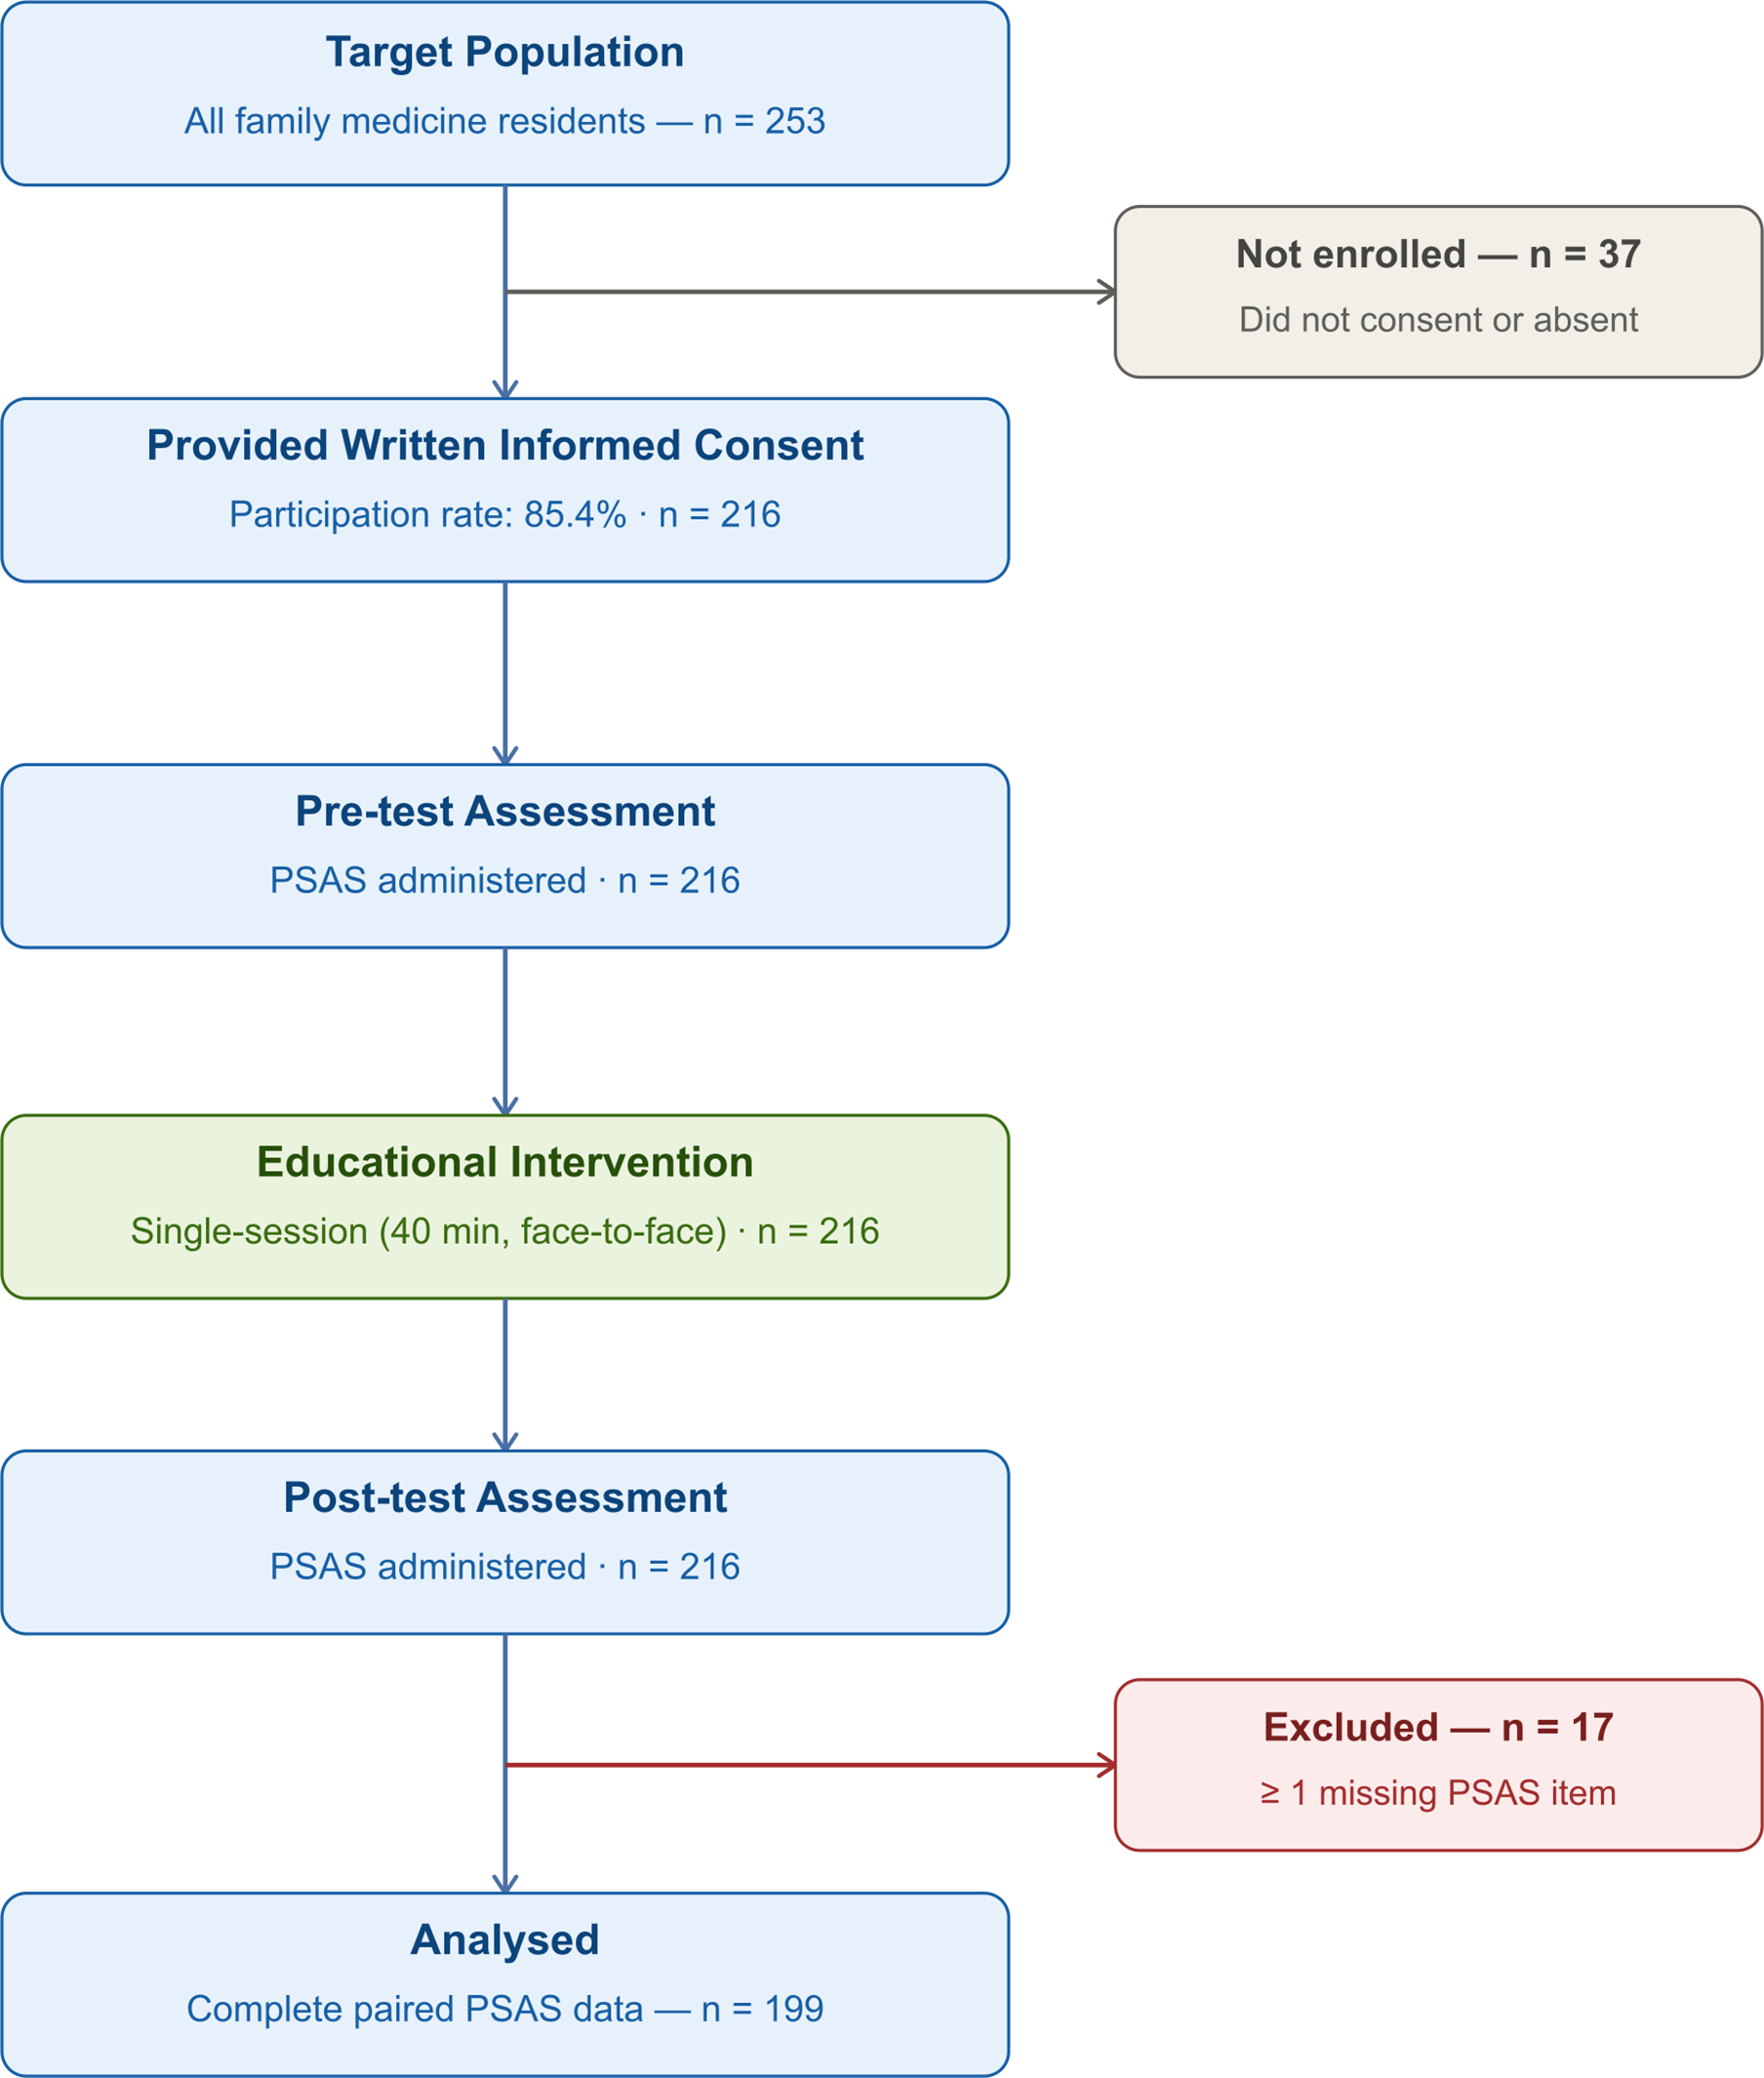
A TREND-compliant participant flow diagram is presented in Figure 1.
Flow diagram of study participants according to the transparent reporting of evaluations with nonrandomized designs (TREND) statement. The target population consisted of all family medicine residents enrolled in the training programme (N = 253). Of these, 37 residents (14.6%) were excluded prior to enrollment due to either refusal to provide written informed consent or absence during the recruitment period, yielding a consenting sample of 216 participants (participation rate: 85.4%). All 216 consenting participants completed the pre-test assessment (Public Speaking Anxiety Scale [PSAS]) and received the educational intervention, which consisted of a single face-to-face session of approximately 40 minutes’ duration. Following the intervention, all participants were administered the post-test PSAS. Seventeen participants (7.9% of enrolled) were subsequently excluded from the paired analysis due to the presence of one or more missing item responses on either the pre-test or post-test PSAS questionnaire. The final analytic sample comprised 199 participants with complete paired PSAS data. Abbreviations: PSAS, Public Speaking Anxiety Scale; TREND, Transparent Reporting of Evaluations with Nonrandomized Designs. Note: The figure caption is intentionally separate from the figure graphic in accordance with journal formatting guidelines. The title ‘Figure 1. TREND Participant Flow Diagram’ should appear as a caption below (or above, per journal style) the figure, not embedded within the graphic itself.
Data collection instruments
Data were collected via a two-part questionnaire. Part one captured sociodemographic and professional characteristics. Part two comprised the Public Speaking Anxiety Scale (PSAS), originally developed by Bartholomay and Houlihan (Reference Bartholomay and Houlihan2016) and validated in Turkish by Doğru Çabuker et al. (Reference Doğru Çabuker, Balcı Çelik and Aldemir2020). The PSAS contains 16 items rated on a five-point Likert scale (1 = Never, 5 = Always), yielding a total score and three sub-dimension scores: Cognitive (seven items; fear of negative evaluation and dysfunctional beliefs; possible range: 7–35), Behavioural (four items; observable avoidance and postural manifestations; possible range: 4–20), and Psychological (five items; somatic symptoms including voice trembling, palpitations, and perspiration; possible range: 5–25). The total scale possible range is 16–80. Higher scores indicate greater PSA.
Educational intervention
The intervention was developed in accordance with AMEE Guide No. 87 (Artino et al., Reference Artino, La Rochelle, Dezee and Gehlbach2014) and reported using the TIDieR checklist (Hoffmann et al., Reference Hoffmann, Glasziou, Boutron, Milne, Perera, Moher, Altman, Barbour, Macdonald, Johnston, Lamb, Dixon-Woods, McCulloch, Wyatt, Chan and Michie2014). A 54-slide multimedia presentation was developed according to Mayer’s Multimedia Learning Principles to optimise cognitive load (Mayer, Reference Mayer2020). The primary researcher delivered all sessions via a standardised narrator protocol, ensuring identical content delivery across all six groups (each comprising approximately 36 residents). Each session was delivered face-to-face and lasted approximately 40 minutes. The intervention comprised three sequential modules: (1) a Cognitive Module covering psychoeducation on PSA and cognitive restructuring; (2) a Psychological Module including active participant practice of the 4–7-8 diaphragmatic breathing technique and progressive muscle relaxation exercises; and (3) a Technical Module addressing non-verbal communication, vocal variety, slide design, and audience management strategies. Active practice components were standardised across all sessions using pre-structured facilitator notes. Individual speaking performance exercises and formal Q&A were not included, as the group size precluded this format; this constraint is acknowledged as a limitation bearing on the Behavioural sub-dimension outcomes. Pre-test assessment was administered immediately before, and post-test assessment immediately following, the intervention.
Ethics
The study was approved by the relevant institutional ethics committee (Date: [Blinded]; Protocol No: [Blinded]). Written informed consent was obtained from all participants.
Statistical analysis
Data were analysed using IBM SPSS Statistics v27.0 (Corp, 2020). Non-parametric tests were used following significant deviation from normality (Shapiro–Wilk): the Wilcoxon Signed-Rank Test for pre-test–post-test comparisons, the Mann–Whitney U test for two-group comparisons, and the Kruskal–Wallis H test for multi-group comparisons. For significant Kruskal–Wallis results, Dunn’s test with Bonferroni correction was applied for pairwise post-hoc comparisons. Statistical significance was set at p < 0.05. Mean score changes (Delta) with 95% confidence intervals (CI) and effect sizes (r) were also calculated.
Findings
Participant characteristics and baseline PSA profile
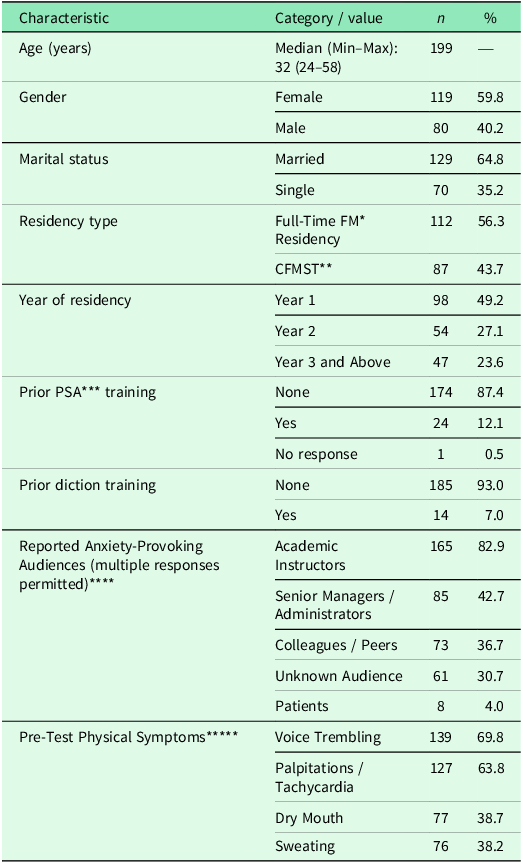
The 199 participants had a median age of 32 years (range: 24–58). The cohort was predominantly female (59.8%, n = 119) and married (64.8%, n = 129). A total of 87.4% (n = 174) of residents had never received formal PSA training, and 93.0% (n = 185) had no prior diction training (Table 1). Before the intervention, voice trembling (69.8%, n = 139) and palpitations (63.8%, n = 127) were the most frequently reported physical symptoms. When identifying their anxiety-provoking audiences (multiple responses permitted), 82.9% (n = 165) of residents reported academic instructors or professors, while only 4.0% (n = 8) reported peak anxiety during patient encounters. This 20-fold difference suggests that PSA in family medicine residents may be more consistent with hierarchical evaluation anxiety than with a generalised communication impairment – though this interpretation should be regarded as a hypothesis for future investigation rather than a conclusion the current data can directly support.
Demographic characteristics and public speaking experience of participants (n = 199)
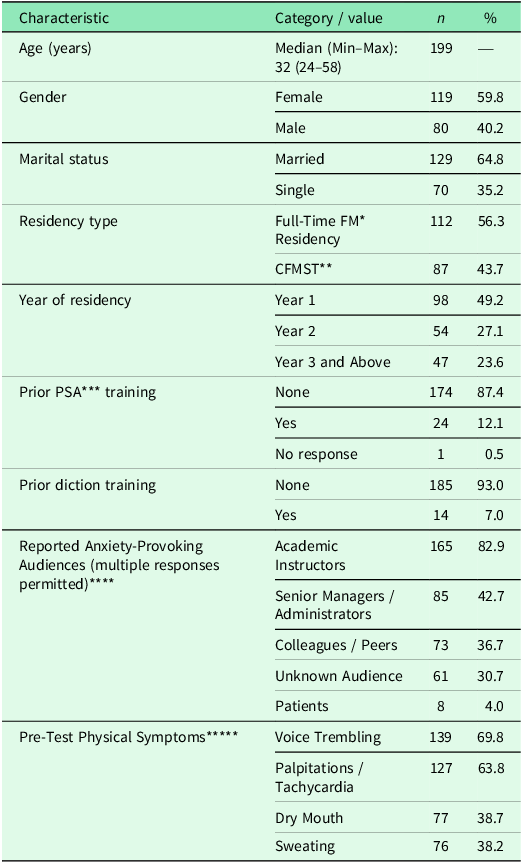
Table 1. Long description
A table with 10 rows and 4 columns. The columns are labeled Characteristic, Category/value, n, and %. The table presents demographic data and public speaking experience of 199 participants. Row 1: Age (years), Median (Min-Max): 32 (24-58), 199, -. Row 2: Gender, Female, 119, 59.8. Row 3: Gender, Male, 80, 40.2. Row 4: Marital status, Married, 129, 64.8. Row 5: Marital status, Single, 70, 35.2. Row 6: Residency type, Full-Time FM* Residency, 112, 56.3. Row 7: Residency type, CFMST**, 87, 43.7. Row 8: Year of residency, Year 1, 98, 49.2. Row 9: Year of residency, Year 2, 54, 27.1. Row 10: Year of residency, Year 3 and Above, 47, 23.6.
*FM = Family Medicine; **CFMST = Contracted Family Medicine Specialty Training. ***PSA = Public Speaking Anxiety; ‘No response’ indicates missing data for one participant. ****Audience types are not mutually exclusive; participants could select multiple options. *****Physical symptoms are not mutually exclusive.
Immediate pre-test–post-test changes in PSAS scores
Following the intervention, total PSAS scores were associated with statistically significant short-term reductions, though individual-level responses demonstrated notable heterogeneity: 66 participants (33.2%) demonstrated score improvement, defined as any decrease in total PSAS score from pre-test to post-test; 105 (52.8%) showed no change (delta = 0); and 28 (14.1%) showed score worsening, defined as any increase in total PSAS score. Across the full sample, the mean anxiety reduction was 1.71 (SD = 5.91) points (95% CI: 0.92 to 2.53; r = 0.32, p < 0.001). Statistically significant reductions were observed across all three sub-dimensions: Cognitive (Mean Delta = 0.45, SD = 2.31, 95% CI: 0.14 to 0.76, r = 0.20, p = 0.005), Behavioural (Mean Delta = 0.49, SD = 1.99, 95% CI: 0.22 to 0.77, r = 0.25, p < 0.001), and Psychological (Mean Delta = 0.77, SD = 2.66, 95% CI: 0.42 to 1.15, r = 0.30, p < 0.001) (Table 2). As no established threshold for clinically meaningful change currently exists for the PSAS in graduate medical education, the educational significance of these specific score shifts remains to be determined through future longitudinal validation.
Comparison of pre-test and post-test PSAS scores (n = 199)

Table 2. Long description
The table presents a comparison of pre-test and post-test PSAS scores across different sub-dimensions. It has 4 rows and 6 columns. The columns are labeled as Scale / sub-dimension, Pre-test median (Min–Max), Post-test median (Min–Max), Mean delta (95% CI), Z*, and P. The rows are labeled as Total PSAS Score, Cognitive Sub-dimension, Behavioural Sub-dimension, and Psychological Sub-dimension. Row 1: Total PSAS Score, Pre-test median (Min–Max) 44 (22–74), Post-test median (Min–Max) 41 (21–72), Mean delta (95% CI) 1.71 (0.92 to 2.53), Z* -4.556, P <0.001**. Row 2: Cognitive Sub-dimension, Pre-test median (Min–Max) 20 (8–32), Post-test median (Min–Max) 19 (7–31), Mean delta (95% CI) 0.45 (0.14 to 0.76), Z* -2.839, P 0.005**. Row 3: Behavioural Sub-dimension, Pre-test median (Min–Max) 11 (4–20), Post-test median (Min–Max) 10 (4–19), Mean delta (95% CI) 0.49 (0.22 to 0.77), Z* -3.537, P <0.001**. Row 4: Psychological Sub-dimension, Pre-test median (Min–Max) 15 (5–25), Post-test median (Min–Max) 13 (5–23), Mean delta (95% CI) 0.77 (0.42 to 1.15), Z* -4.170, P <0.001**.
* Wilcoxon Signed-Rank Test. **p < 0.05, statistically significant. PSAS = Public Speaking Anxiety Scale.
Subgroup analysis
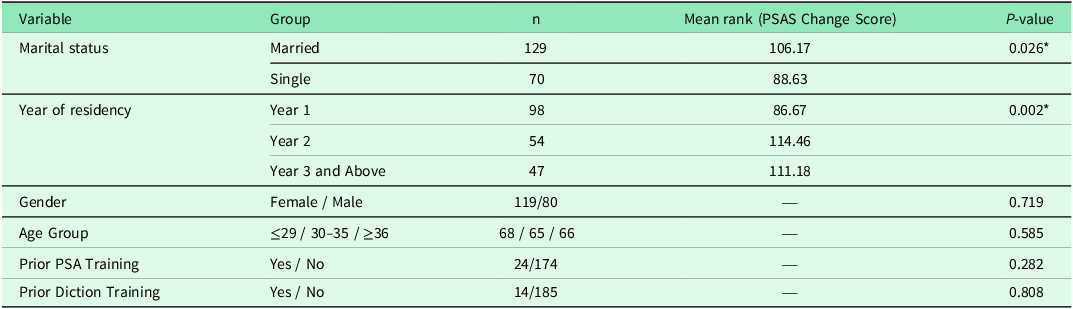
Improvement score analysis revealed differential training outcomes (Table 3). Married residents demonstrated significantly greater improvements than single residents (U = 3719.0; Z = −2.222; p = 0.026). Residents in Year 2 and above showed significantly larger gains than Year 1 residents (H = 12.230; df = 2; p = 0.002). Dunn’s post-hoc test with Bonferroni correction confirmed that Year 1 residents had significantly lower gain scores than Year 2 residents (p = 0.006) and Year 3 and above residents (p = 0.028), while no significant difference was found between Year 2 and Year 3+ residents (P = 1.000). Gender, age group, prior PSA training history, and prior diction training were not associated with differences in change scores (all p > 0.05). These subgroup findings are exploratory in nature and should be interpreted with caution given the number of comparisons conducted.
Exploratory subgroup analysis of short-term PSAS score changes
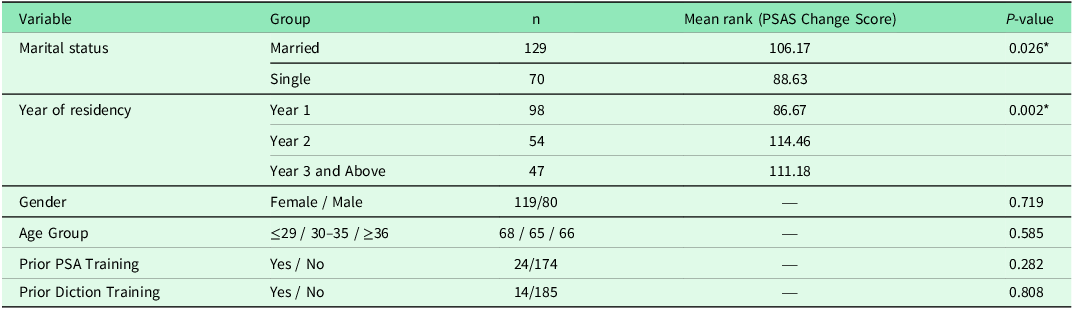
Table 3. Long description
A table with six rows and five columns comparing mean rank PSAS change scores across different variables. The columns are labeled Variable, Group, n, Mean rank (PSAS Change Score), and P-value. The variables include Marital status, Year of residency, Gender, Age Group, Prior PSA Training, and Prior Diction Training. For Marital status, Married individuals have a mean rank of 106.17 with 129 participants, and Single individuals have a mean rank of 88.63 with 70 participants, with a P-value of 0.026. For Year of residency, Year 1 has a mean rank of 86.67 with 98 participants, Year 2 has a mean rank of 114.46 with 54 participants, and Year 3 and Above has a mean rank of 111.18 with 47 participants, with a P-value of 0.002. Gender, Age Group, Prior PSA Training, and Prior Diction Training do not show significant differences in change scores, with P-values of 0.719, 0.585, 0.282, and 0.808 respectively.
* p < 0.05. PSAS score change = pre-test score minus post-test score, positive values indicate anxiety reduction (improvement). Mann–Whitney U (two groups) and Kruskal–Wallis H (three or more groups) tests were used as appropriate.
Discussion
This study highlights an educationally relevant pattern among family medicine residents: physicians who routinely communicate with patients may still experience pronounced anxiety when the audience shifts to academic superiors. The 20-fold disparity between anxiety reported with academic instructors (82.9%) versus patients (4.0%) may be consistent with hierarchical evaluation anxiety (Lintner and Belovecová, Reference Lintner and Belovecová2024; Salehi et al., Reference Salehi, Jacobs, Suhail‐Sindhu, Judson, Azizzadeh and Lee2020). However, it is also important to note that academic presentations and patient encounters represent fundamentally different communication settings – one formal and evaluative, the other relational and clinical – and this contextual difference may itself partly account for the observed disparity. Since hierarchical evaluation anxiety was not directly measured in the current study, this interpretation should be regarded as a hypothesis for future investigation rather than a conclusion drawn from the present data.
The observed baseline PSAS scores, combined with the finding that 87.4% of residents had received no formal preparation, provide evidence of the ‘null curriculum’ effect in family medicine residency (Flinders et al., Reference Flinders, Noddings and Thornton1986; Ghadir Pourbairamian et al., Reference Pourbairamian, Bigdeli, Kamran, Yamani, Sohrabi, Ahmadi and Sandars2022). This stance is inconsistent with competency-based medical education frameworks and with the growing recognition that unaddressed PSA may exacerbate the Imposter Syndrome frequently reported among medical trainees (Alhazmi et al., Reference Alhazmi, Alraddadi, Alabdulkarim and Al-Rowais2022; Chodoff et al., Reference Chodoff, Conyers, Wright and Levine2023).
From a practical perspective, the single-session design appears feasible for integration into time-intensive primary care residency curricula and was associated with statistically significant short-term improvements. The observed reductions across all three PSAS sub-dimensions – including the Behavioural sub-dimension, which captures observable presentation behaviours – may suggest short-term perceptual shifts regarding presentation behaviours rather than confirmed skill acquisition. These findings are consistent with the broader literature on cognitive–behavioural and multimodal approaches to PSA (García-Monge et al., Reference García-Monge, Guijarro-Romero, Santamaría-Vázquez, Martínez-Álvarez and Bores-Calle2023; McWilliam et al., Reference McWilliam, Beattie and Callow2025).
Although the overall reduction in PSAS scores reached statistical significance, the practical significance of this change warrants caution. The absolute mean change was modest (Mean Delta = 1.71 on a possible range of 16–80), and no established threshold for clinically meaningful change exists for the PSAS in resident populations, making it difficult to determine whether the observed score shifts reflect educationally meaningful reductions in experienced anxiety. Individual-level analysis revealed that 66 participants (33.2%) showed improvement, 105 (52.8%) showed no change, and 28 (14.1%) reported higher post-test scores, indicating considerable heterogeneity in response. Single-session interventions may be insufficient for residents with more entrenched hierarchical evaluation anxiety or severe somatic symptoms, for whom brief exposure may temporarily heighten awareness of anxiety without providing adequate consolidation time. This pattern is consistent with the broader PSA intervention literature, which suggests that dosage, practice opportunities, and psychological readiness are important moderators of response (McWilliam et al., Reference McWilliam, Beattie and Callow2025). Score increases in 14.1% of participants may also reflect heightened self-awareness following psychoeducation – a phenomenon documented in anxiety measurement research where sensitivity to symptoms temporarily elevates self-reported scores before improvement occurs. Future research should identify baseline predictors of response to enable more targeted allocation of educational resources.
The differential gains across subgroups offer additional insights for programme planners, although these findings are exploratory and should not be over-interpreted. The greater training benefit among married residents may reflect the role of social support in consolidating new skills, though this remains speculative and warrants prospective investigation. The advantage observed among senior residents may reflect a more consolidated professional identity; however, this mechanism was not directly measured and represents a hypothesis for future investigation.
Implications for policy and practice
Academic presentation skills warrant consideration as part of residency training, with institutions providing structured support rather than leaving it to incidental development. The 40-minute format may be feasible for incorporation into residency teaching schedules, although feasibility and implementation outcomes were not formally assessed. However, policy planners should note that single-session interventions offer viable baseline support at best, and controlled longitudinal studies are needed before strong curricular recommendations can be made.
Limitations
Several limitations warrant acknowledgement. The single-centre quasi-experimental design without a control group limits causal inference; observed reductions may partly reflect test familiarity effects or natural anxiety dissipation. A further limitation concerns the potential for demand characteristics and social desirability bias. Because post-test assessment was administered immediately after the session by the same investigator who delivered the training, residents in this hierarchical educational environment may have been inclined to report lower anxiety scores to align with perceived expectations. The absence of an independent or blinded assessor means this source of bias cannot be ruled out and may have inflated the observed post-test score reductions. Reliance on self-report instruments rather than objective behavioural measures (e.g., video-coded presentations) introduces subjectivity. Critically, post-test assessment was conducted immediately following the intervention, precluding evaluation of sustained effects. Future research should employ multi-centre randomised designs with longitudinal follow-up and objective outcome measures.
Conclusion
Academic instructors were the most frequently reported anxiety-provoking audience among participating residents. The single-session intervention was associated with a small immediate reduction in self-reported PSAS scores; however, individual responses were heterogeneous, and causal or sustained effects cannot be inferred. Future research should employ controlled, longitudinal designs to determine whether short-term reductions translate into sustained improvements in professional communication.
Data availability statement
The datasets generated and analysed during the current study are not publicly available because they contain potentially identifiable participant information and are subject to institutional and ethical restrictions. Data are available from the corresponding author upon reasonable request and with permission of the relevant ethics committee.
Acknowledgements
The authors declare that generative AI language tools were used only for language refinement and journal guideline compliance checking. No AI tool was used to generate research hypotheses, collect or analyse data, interpret results, or draw scientific conclusions. The authors take full responsibility for the accuracy, integrity, and originality of the manuscript.
Author contributions (CRediT)
M.K.: Conceptualisation; Methodology; Software; Investigation; Data Curation; Formal Analysis; Writing – Original Draft. E.S.: Conceptualisation; Methodology; Supervision; Validation; Writing – Review & Editing.
Financial support
This research received no specific grant from any funding agency, commercial or not-for-profit sectors.
Competing interests
The authors declare that they have no competing interests.
Ethical standards
The authors assert that all procedures comply with the ethical standards of the relevant national and institutional guidelines and the Declaration of Helsinki (World Medical Association, 2013). The study was approved by the relevant institutional ethics committee (Date: [Blinded]; Protocol No: [Blinded]). Written informed consent was obtained from all participants.



 Open access

