INTRODUCTION
Recent experiments (Chen et al., Reference Chen, Wilks, Bonlie, Liang, Myatt, Price, Meyerhofer and Beiersdorfer2009; Reference Chen, Meyerhofer, Wilks, Cauble, Dollar, Falk, Gregori, Hazi, Moses, Murphy, Myatt, Park, Seely, Shepherd, Spitkovsky, Stoeckl, Szabo, Tommasini, Zulick and Beiersdorfer2011; Reference Chen, Sheppard, Meyerhofer, Hazi, Link, Anderson, Baldis, Fedosejev, Gronberg, Izumi, Kerr, Marley, Park, Tommasini, Wilks and Williams2013) showed that lasers are a good tool to make beams of positrons with high energy and density. The experiment usually consists of a target made from a high-Z material which is irradiated by a high-power laser of intensity 1019 W/cm2 and higher. Electrons accelerated in the preplasma produce positrons in the target via two mechanisms: Trident and Bethe-Heitler (Lang, Reference Lang2006; Berestetskii et al., Reference Berestetskii, Pitaevskii and Lifshitz1984). The leading mechanism is usually the latter, as was shown in Nakashima and Takabe (Reference Nakashima and Takabe2002), Trident can be significant in the case of targets thinner than 20 µm. Beams of positrons and electrons could provide an insight into the electron-positron pair plasma and consequently some astrophysical and related applications (Chen et al., Reference Chen, Meyerhofer, Wilks, Cauble, Dollar, Falk, Gregori, Hazi, Moses, Murphy, Myatt, Park, Seely, Shepherd, Spitkovsky, Stoeckl, Szabo, Tommasini, Zulick and Beiersdorfer2011; Myatt et al., Reference Myatt, Delettrez, Maximov, Meyerhofer, Short, Stoeckl and Storm2009).
During the experiments of Chen et al. (Reference Chen, Sheppard, Meyerhofer, Hazi, Link, Anderson, Baldis, Fedosejev, Gronberg, Izumi, Kerr, Marley, Park, Tommasini, Wilks and Williams2013) at the Titan and Omega EP facilities, spectra of positrons were measured achieving peak energies up to 20 MeV. The number of positrons was 1010–1012. Measurements of the positron beam emittance were taken showing that the values are better being compared to a conventional accelerator source. So far, the laser sources have not reach all their qualities because they have a lower repetition rate. However, the ELI-Beamlines facility promises a very high (10 Hz) repetition rate of, for example, 50 J pulses with the duration of 25 fs (Rus et al., Reference Rus, Bakule, Kramer, Korn, Green, Novak, Fibrich, Batysta, Thoma, Naylon, Mazanec, Vitek, Barros, Koutris, Hrebicek, Polan, Base, Homer, Koselja, Havlicek, Honsa, Novak, Zervos, Korous and Houzvicka2013).
Targets for the positron production are usually about 1 mm thick and detailed calculations must include several effects. First, a particle simulation of laser-matter interaction and second, an electron beam propagation through matter with a bremsstrahlung radiation and self-consistent fields. The radiation cannot be disregarded because the pair production, via Bethe-Heitler process, needs photons as well as self-consistent fields cause additional acceleration of positrons (Chen et al., Reference Chen, Meyerhofer, Wilks, Cauble, Dollar, Falk, Gregori, Hazi, Moses, Murphy, Myatt, Park, Seely, Shepherd, Spitkovsky, Stoeckl, Szabo, Tommasini, Zulick and Beiersdorfer2011; Yan et al., Reference Yan, Wu, Zhao, Teng, Yu, Liu, Dong, Wei, Fan, Cao, Yao and Gu2012). For these reasons, one needs to develop a complex calculation of all the effects to fully describe positron generation. We tried to approach such detailed calculations by simulations of a laser-plasma interaction using the particle-in-cell (PIC) code PICLS (Sentoku & Kemp, Reference Sentoku and Kemp2008) and a Monte-Carlo (MC) transport code FLUKA (Battistoni et al., Reference Battistoni, Muraro, Sala, Cerutti, Ferrari, Roesler, Fasso‘ and Ranft2007; Ferrari et al., Reference Ferrari, Sala, Fasso‘ and Ranft2005). We investigated laser intensities in the range from 1019 to 1022 W/cm2 where positron production via Breit-Wheeler process is not considerable yet (Ridgers et al., Reference Ridgers, Brady, Duclous, Kirk, Bennett, Arber and Bell2012) and these intensities correspond to the parameters of the ELI facility.
NUMERICAL MODEL
In this section, we present how the numerical model describes the laser-matter interaction after the ablation of the target surface, a measurement of an electron spectrum and consequent electron propagation through the matter covering positron production.
For the interaction, we assume an exponential density profile of lead preplasma. The length of the preplasma is characterized by a distance where the density drops to e −1 multiple of the solid target density. The ionization degree is set to Z = 40 and the laser beam duration is fixed to 33 fs, and its wavelength is set to 1 µm. We model the laser interaction within this plasma using a one-dimensional, collisionless, PIC method with grid resolution 137 cells per wavelength, and 40 electron macro-particles per cell. In this simulation, the length of the solid part of the lead target is only 10 microns due to demands on CPU. There is a problem because electrons in a thin target act differently from the electrons in a thick target. In a thin target, an effect called refluxing occurs (Myatt et al., Reference Myatt, Delettrez, Maximov, Meyerhofer, Short, Stoeckl and Storm2009) which makes electrons to return back at the rear side of target. That is not a behavior of the thick targets we have considered. In our simulations, we prevented this effect by setting the rear side of the target as a refractive boundary. Each electron that reaches this boundary is turned backwards and its energy is set to the thermal energy (0.025 eV).
At first glance one could try to measure a spectrum of electrons from the PIC code independently of their positions and use this spectrum as an input for a MC simulation. This approach neglects the information about the direction of particles and tends not to be accurate, since it can involve electrons flying outward of the target. We tried to enhance this by inserting a virtual interface in the PIC code, between the plasma and solid target. Electrons that fly through this interface toward the solid target determine a spectrum that is sampled as an input for MC. This implies that all interaction which would happen behind this interface is not taken into account in the MC simulation. We can afford such cut-off since the critical surface is much more further from the interface than the skin depth of laser which is for lead solid density about 5 nm. The number of macro-particles detected at the interface is converted to fluence and this quantity is used to get absolute numbers of the electrons and secondary particles.
ELECTRON ACCELERATION IN A SOLID TARGET WITH A PRE-FORMED PLASMA
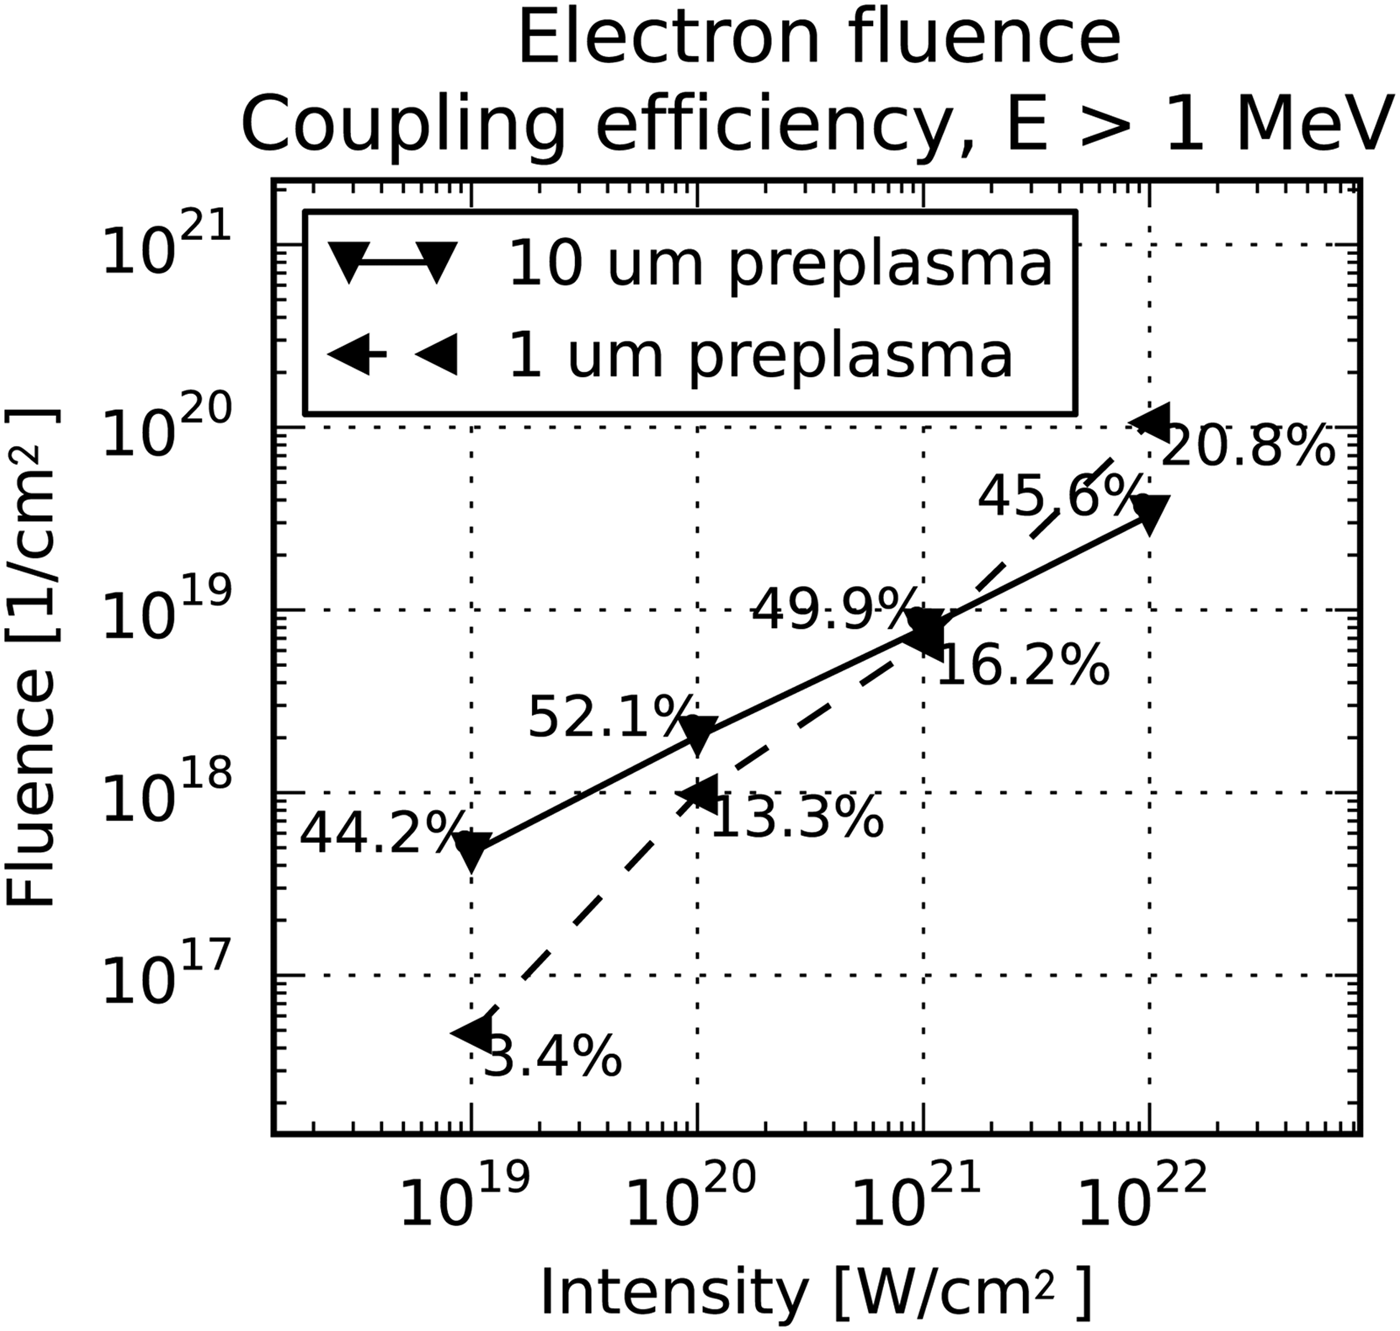
Let us present results from measurements taken at the detector between the preplasma and the solid target, as it is depicted in Figure 1. Spectra measured at this interface are shown in Figure 2. Note an expectable trend that while the intensity of laser is being increased, the number of accelerated electrons and maximum energy is higher. Indeed, the length of preplasma significantly influences laser absorption, which is obvious from the spectra figures as well. We can also prove this effect by calculating the laser electron coupling efficiency (expressing how much laser energy is transferred to electrons). For 10 µm preplasma 40–50% of the laser energy is transferred to electrons with an energy higher than 1 MeV, whereas coupling reaches 20% for 1 micron preplasma. The coupling values and electron fluence of electrons flying toward the target is shown in Figure 3. Another quantity to watch is the maximum energy of electrons. Compare, for example, 66 MeV reached within 1 µm with 265 MeV for 10 µm in the case of 1021 W/cm2 laser intensity. Thus, preplasma length also greatly affects the maximum energy that electrons reach.
(Color online) This drawing illustrates which part of target is simulated using the one-dimensional PIC code PICLS and which by the MC code FLUKA. PIC simulates the left region containing the exponential preplasma and a part of solid target. The whole solid part of target is treated by MC. The lines marking detector positions show where the particles were measured. The left detector is set up in PICLS and measures electrons accelerated in the preplasma and the right one, in FLUKA, detects electrons and also secondary particles: positrons and photons.

(Color online) Spectra of electron energies measured in PICLS at the interface between the preplasma and the solid target. The number of macro-particles was converted to the fluence of real particles. The spectra continue to higher energies than it is depicted. The spectra are plotted for two lengths fo preplasma: (a) 1 µm and (b) 10 µm length of preplasma.
The plot shows the fluence of electrons measured in PICLS at the interface between the preplasma and the solid target. Numbers that accompany the points describe the energy conversion efficiency from the laser beam to the measured electrons. Only the electrons with energies higher than 1 MeV are taken into account.
We see, from the simulations that a laser with an intensity greater than 1020 W/cm2 creates good conditions for positron generation since there is an appreciable number of electrons that carry much more energy than the threshold for pair production (2m ec 2 ≅ 1 MeV). Assuming the laser power 1021 W/cm2 and the 10 µm focal spot (corresponding surface is 78.5 × 10⁻⁸ cm2) we deduce that there are 1.8 × 10¹² or 4.0 × 10¹² hot electrons in the beam for 1 and 10 µm preplasma respectively. Therefore, the yield of electrons can be improved adjusting the size of the preplasma.
ELECTRON TRANSPORT AND POSITRON GENERATION
Positrons and photons are measured using a FLUKA detector on the rear surface of the target as indicated in Figure 1. The detector provides relative yields of secondary particles, i.e., the number of particles produced by one initial electron. Despite the FLUKA code being fully three-dimensional, we neglect any angular distribution of the source. This is because we do not get any useful angular distribution data from the PIC simulation, which is one-dimensional.
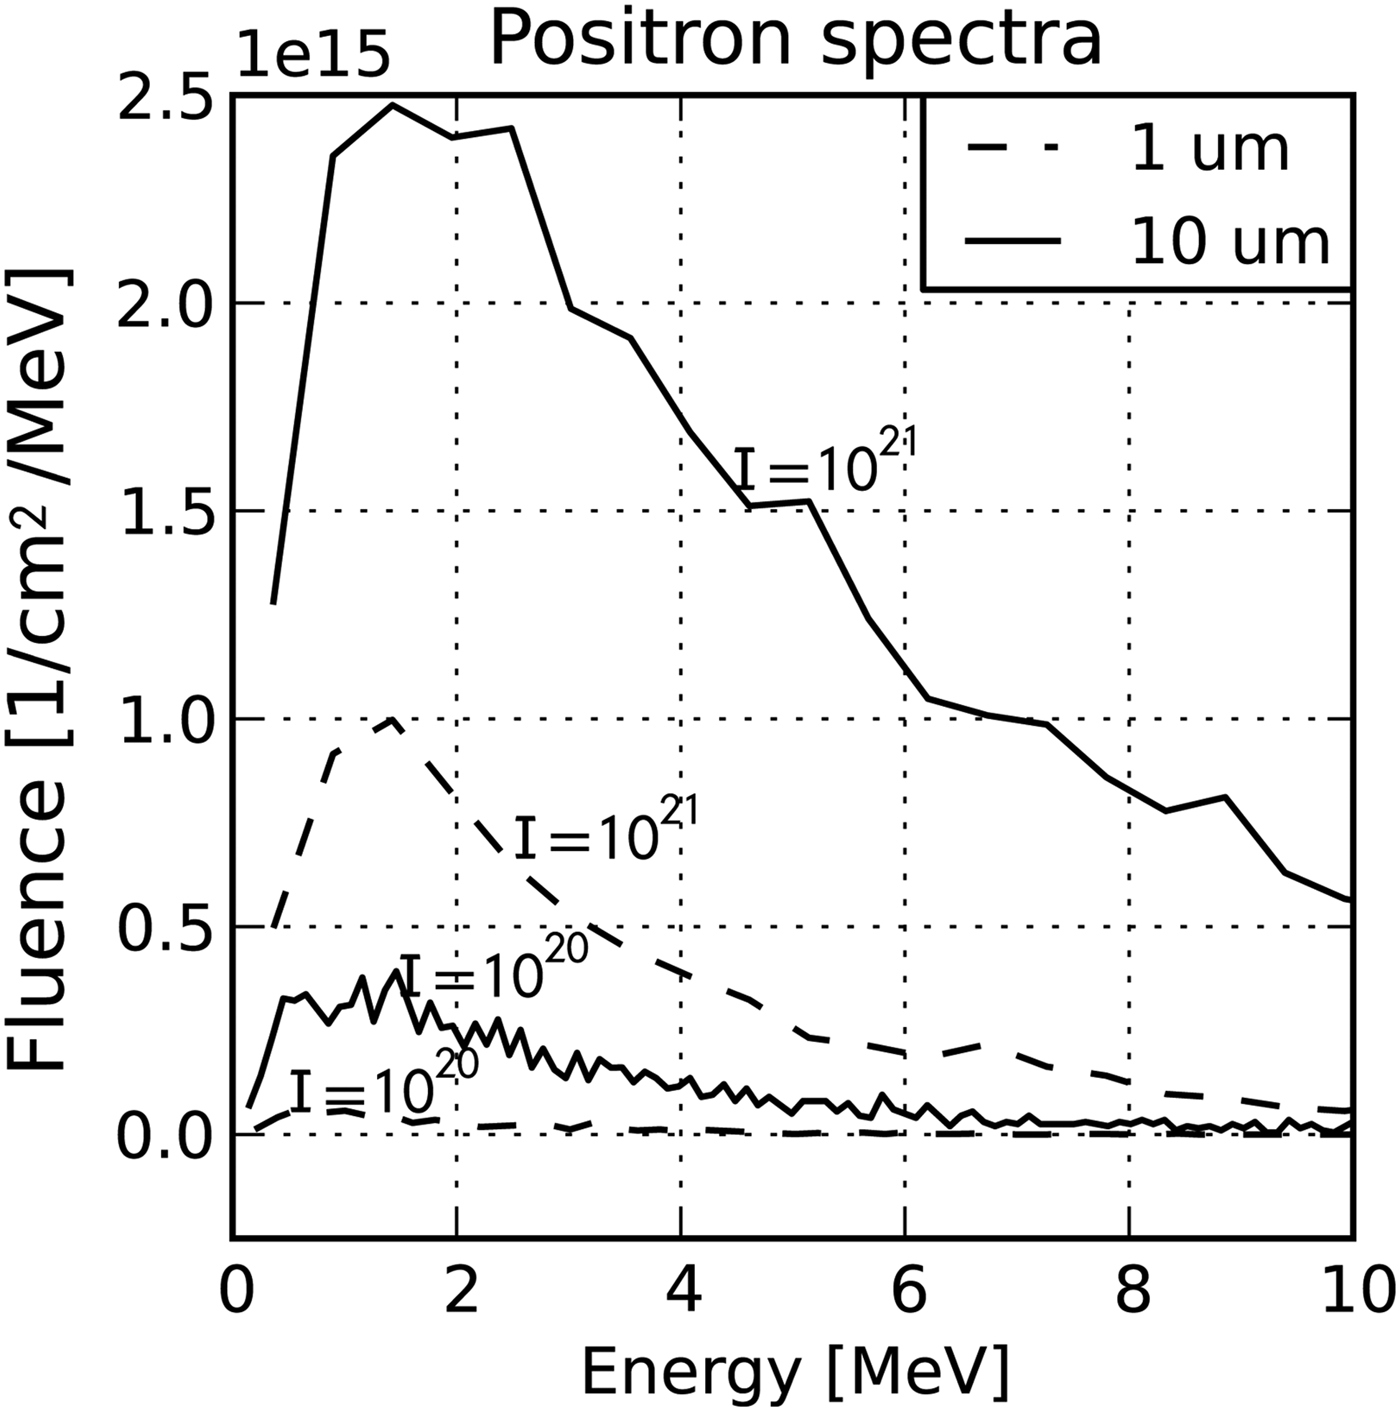
We present a comparison of positron spectra for different laser intensities and two preplasma lengths as shown in Figure 4. Clearly, the number and the energy of positrons rises with intensity and length of preplasma. This is an obvious consequence of the behavior of the electron spectra (Fig. 2). Some of those positron spectra from Figure 4 are magnified and displayed for the range from 0 to 10 MeV in Figure 5. Our simulations show that the peak energy of spectra is not higher than about 2 MeV. However, in (Chen et al., Reference Chen, Meyerhofer, Wilks, Cauble, Dollar, Falk, Gregori, Hazi, Moses, Murphy, Myatt, Park, Seely, Shepherd, Spitkovsky, Stoeckl, Szabo, Tommasini, Zulick and Beiersdorfer2011) significantly higher peak energies were measured — up to tens MeV. This is because our simulations do not consider so called sheath field which is a consequence of electric fields that occur at the target rear.
(Color online) Positron spectra resulting from MC simulation measured at the rear side of target. The spectra are depicted for two cases: (a) 1 µm preplasma and (b) 10 µm preplasma. Note that there is a fluence at the vertical axis which is obtained by multiplying spectra from MC by the fluence measured in PIC. The lines are for various laser intensities. Units are Wcm2.
A comparison of spectra from positrons emerging from the target in the low energy range, from 0 to 10 MeV. Intensities, 1020 and 1021 Wcm2, were selected. The results for 1 µm preplasma have a dashed line and the 10 µm preplasma have a solid line.
Spectra of particles emerging from the target are visible in Figure 6. Note how the number of electron particles decreases after the passage through the 19 mm target and copies the curve of the positron spectrum in the region of higher energies. There were also neutrons detected that originate from photo-nuclear reactions, but their number is too small to be shown in the figure. We obtained about 107 neutrons uniformly distributed around the target for the case 1021 W/cm2, 10 micron preplasma and 10 micron focal spot.
(Color online) The influence of the target thickness on the positron generation and the spectra of emerging particles. (a) Spectra for 1 mm target. The upper solid line represents emerging electrons. The lower one positrons. (b) Spectra for 19 mm target. Unlike 1 mm case the number of electrons decreased and the lines for electrons and positrons almost merged together. The only difference is in the low energy part of the spectra.
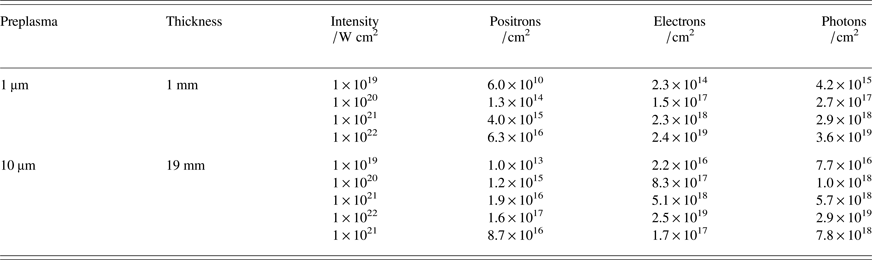
In Table 1, you can see yields of positrons and photons. The values of relative yields were multiplied by the electron densities. These densities were obtained from PIC and they are depicted in Figure 3. Looking at the positron yields we read that we could achieve up to 1017 particles per cm2.
The fluence of emerging particles from the target according to MC simulation for various parameters of preplasma, target thickness and laser intensity. Relative numbers from FLUKA were multiplied by the fluence obtained from PIC.
Let us assume a laser beam that would match with future ELI lasers (Rus et al., Reference Rus, Bakule, Kramer, Korn, Green, Novak, Fibrich, Batysta, Thoma, Naylon, Mazanec, Vitek, Barros, Koutris, Hrebicek, Polan, Base, Homer, Koselja, Havlicek, Honsa, Novak, Zervos, Korous and Houzvicka2013) which are expected to deliver short pulses with a repetition rate of 10 Hz. If the laser, of intensity 1021 W/cm2, had a focal spot of 10 µm in diameter and the duration was 33 fs, the positron yield would be 1.5 × 10¹⁰. The peak energy of the positron spectrum is around 2 MeV, in this case, neglecting the acceleration by sheath field. The maximum energy of positrons reaches 50 MeV.
The ratio of positrons to electrons that escape the target is also of importance because we are interested in the creation of pair plasma. Our study shows that one way how to make a better ratio is to achieve higher intensities in the laser-matter interaction. The ratio ranges from 2 × 10⁻⁴ to 6.5 × 10⁻³ positrons per one electron assuming a 1 mm target. Another way how to approach the neutrality of electron-positron beam is using thicker targets. We did several MC simulations for various target thicknesses for the intensity 1021 W/cm2 with 10 µm preplasma. Increasing the thickness of the lead target leads to the the number of positrons increasing, and the number of electrons decreasing. Moreover, in the region of high energy the numbers of electrons and positrons equalise. It is visible in Figure 6 where you can compare how the spectra have changed with the thicker target. We managed to adjust the electron positron ratio up to about 0.5 (see Fig. 7) with 19 mm target. We can also use the target thickness to get maximum yield of positrons which is in our case depicted also in Figure 7 and determines the optimal thickness in the range 5–10 mm. Similar scaling study was done by Luo et al. (Reference Luo, Zhuo, Ma, Yang, Zhao and Yu2012) where positrons created by Compton-scattering gamma-ray source were investigated.
(Color online) Development of the number of positrons and electrons emerging from the target with respect to the target thickness. The right vertical axis representing the fluence is in logarithmic scale. The black line and the left axis is dedicated to the ratio of the fluences. These results are for a preplasma of 10 µm preplasma and the intensity 1021 W/cm2.
Let us now discuss the omitted angular distributions that plays a role in positron beam usability. This is important when laser sources are compared with conventional accelerator sources. Divergence of the electron beam created in the preplasma usually varies from 20° to 40° (Debayle et al., Reference Debayle, Honrubia, D'Humiéres and Tikhonchuk2010). In the case of 22.5°, a beam created within 8 µm focal spot propagating through 1 mm thick target spreads over 800 µm. Positrons follow the divergence of electrons because they are created along the electrons' trajectory. Recently, the size of the positron beam and its divergence was measured (Chen et al., Reference Chen, Sheppard, Meyerhofer, Hazi, Link, Anderson, Baldis, Fedosejev, Gronberg, Izumi, Kerr, Marley, Park, Tommasini, Wilks and Williams2013). The size ranged from 400 µm to 800 µm and divergence from 20 to 40 degrees. The authors stated that parameters of the beam are comparable to beams obtained at linear accelerator. It is good to point out that increasing the target thickness, increases the diameter of the particle beam. Thus, during electron positron ratio optimising, the quality of the beam can be lost because of the scattering in the target.
SUMMARY
We have introduced a one-dimensional simulation method for the calculations of thick target experiments for positron production. Very detailed simulation based on PIC scheme has been already developed (Moritaka et al., Reference Moritaka, Baiotti, Lin, Weiwu, Sakawa, Kuramitsu, Morita and Takabe2013), however, only thin targets around 10 microns were investigated. Using our method we can estimate absolute number of generated positrons, and the ratio of positrons to electrons, for thicker targets assuming short-pulse lasers like ELI-Beamlines or similar (PETAL (Blanchot et al., Reference Blanchot, Behar, Berthier, Bignon, Boubault, Chappuis, Coïc, Damiens-Dupont, Ebrardt, Gautheron, Gibert, Hartmann, Hugonnot, Laborde, Lebeaux, Luce, Montant, Noailles, Néauport, Raffestin, Remy, Roques, Sautarel, Sautet, Sauteret and Rouyer2008) for instance).
We get an estimate of 1.5 × 10¹⁰ and 1.3 × 10¹¹ positrons per shot for 1 mm targets with 10 micron preplasma and assuming the intensity 1021 and 1022 W/cm2, respectively. The majority of positrons have energies in the range from 1–2 MeV. These values do not coincide with experimental observations that show positrons to have higher energies. The observations of higher energies are attributed to so called sheath field. Analysis of this effect by means of MC simulations is in the article by Yan et al. (Reference Yan, Wu, Zhao, Teng, Yu, Liu, Dong, Wei, Fan, Cao, Yao and Gu2012) and thorough simulations in Chen et al. (Reference Chen, Sheppard, Meyerhofer, Hazi, Link, Anderson, Baldis, Fedosejev, Gronberg, Izumi, Kerr, Marley, Park, Tommasini, Wilks and Williams2013). More detailed calculations of the sheath field effect could be done using full temporal and spatial information about electron and positron beams. Upgrading to a two or three-dimensional PIC simulation could provide this information about electrons, to be inherited by positrons in the MC code. Thus, the electric fields at the rear of the target would be fully described. We also show that by means of target thickness scaling we can reduce the number of electrons while keeping enough positrons in order to reach an interesting ratio of these particles. Such ratio encourages applications in electron-positron plasma studies.
ACKNOWLEDGEMENT
This work was supported by the grant SGS10/299/OHK4/3T/14 of Czech Technical University in Prague.