INTRODUCTION
Acid sulphate soils (ASSs) are mostly found in tropical and sub-tropical coastal areas or former coastlines located inland because of optimal environmental conditions for sulphide mineral formation in seawater (Dent & Pons Reference Dent and Pons1995; Boman et al. Reference Boman, Fröjdö, Backlund and Åström2010). They are formed through the oxidation of sulphide minerals in soils and often have low soil pH values of <4 (Dent & Pons Reference Dent and Pons1995). More than 17 million ha of ASS are found worldwide, including 6·5 million ha in Asia, 4·5 million ha in Africa, 3 million ha in Australia and 3 million ha in Latin America, with the remainder found in Europe (Andriesse & van Mensvoort Reference Andriesse, van Mensvoort and Lal2006). It has been estimated that 0·11 million ha of ASS are found in China, mostly distributed in Guangdong Province (Lin Reference Lin1999). Since ASS often coincide with areas of higher population density where climatic conditions are hot and humid (Andriesse & van Mensvoort Reference Andriesse, van Mensvoort and Lal2006), these soils have been traditionally reclaimed for rice cultivation (Lin Reference Lin1999). Such land reclamation has little impact on the natural hydrology and reduces pyrite oxidation, thus preventing severe acidification of acid sulphate paddy soils (Dent & Pons Reference Dent and Pons1995; Lin Reference Lin1999). In addition, the readily available irrigation from nearby rivers in the Pearl River Delta leaches acid toxins from the soils. Therefore, rice cultivation is regarded as an appropriate use for ASS in the Pearl River Delta (Lin Reference Lin1999). However, even though rice can grow in ASS with pH <4·0 (Kang et al. Reference Kang, Seo, Lee, Vijarnsorn and Ishii2010), production in these soils is often severely limited as a result of the high acidity (Krairapanond et al. Reference Krairapanond, Jugsujinda and Patrick1993). With the oxidation of Fe-sulphide in ASS and the acidification of ASS, many metals (e.g. iron (Fe), aluminium (Al), manganese (Mn) and arsenic (As)) are easily mobilized and released in toxic quantities in soil water, so that they become detrimental to plants or aquatic organisms (Lin et al. Reference Lin, McConchie, Bush, Sullivan and Rosicky2001; Toivonen & Österholm Reference Toivonen and Österholm2011). In addition, extremely acidic soil conditions enhance the loss of some essential nutrient elements (e.g. magnesium (Mg), copper (Cu) and zinc (Zn)) and reduce the availability of phosphorous (P), leading to deficiencies (Golez & Kyuma Reference Golez and Kyuma1997; Lin Reference Lin2002). Rice plants growing in ASS are characterized by the yellowing and purpling of leaves followed by the appearance of brown spots and scorching, and rice roots are also found to decay due to sulphide injury (Mathew et al. Reference Mathew, Panda and Nair2001). The growth of rice in these soils is therefore inhibited, and rice cultivation is difficult without improvements in soil pH.
With increasing demands for sustainable food production, how to best utilize the ASS that typify much of South and East Asia remains a significant challenge. To overcome the problems associated with rice cultivation in ASS outlined above, farmers have traditionally applied lime or other chemical neutralizers such as rock phosphate to reduce soil acidity, which has proven to be effective and practical (Von Willert & Stehouwer Reference Von Willert and Stehouwer2003). However, rice production in ASS is complex (Mathew et al. Reference Mathew, Panda and Nair2001) due to the existence and dynamic nature of many acidity fractions in ASS (Vithana et al. Reference Vithana, Sullivan, Bush and Burton2013). Acidity is a direct, important and prime limiting factor for rice growth on ASS (Vithana et al. Reference Vithana, Sullivan, Bush and Burton2013). The acidity that exists in ASS arises from soluble and exchangeable acidic pools, and retained acidity (RA), which are conceptualized as the acidity retained in poorly soluble Fe/Al hydroxy sulphates. The assumed relationship between acidity or sulphate in soils and the growth of rice in ASS landscapes has generated considerable interest. In ASS reclaimed to cultivate rice, agricultural experts and farmers may only be concerned with the pH of the plough payer. However, the acidity in ASS is often produced by the oxidation of pyrite buried in deeper layers of potentially ASS or the hydrolysis of Jarosite or other mineral-sulphates in the upper layers of actual ASS (Glover et al. Reference Glover, Whitworth, Kappen, Baldwin, Rees, Webb and Silvester2011; Vithana et al. Reference Vithana, Sullivan, Bush and Burton2013). The upward flux by capillary action carries the acidity from the sub-soil to the rice root zone, leading to acidification of the rice growth environment (Mathew et al. Reference Mathew, Panda and Nair2001; Glover et al. Reference Glover, Whitworth, Kappen, Baldwin, Rees, Webb and Silvester2011). Upward water fluxes imply suction, which can be caused by the extraction of water by roots due to transpiration, or evaporation from the upper layers in dry seasons. Therefore, the acid characteristics of the sub-soil should be taken into account in the amelioration of acid sulphate paddy soils. The present study aimed to determine the relationships between the active acid fractions of different layers of the ASS and rice yield, and to determine the sensitive acidity at key depths of ASS that affect rice production.
MATERIALS AND METHODS
Study site and sampling
The four experimental fields used in the present study were located at Bajia Village (22°40′N, 112°27′E, 1 m asl) Chonglou Town, Guangdong Province, China. The study area was located in the western part of the Pearl River Delta, which contains 6020·27 ha of ASS. In general, the ASS in this area formed as a result of artificial drainage for agricultural purposes that caused the oxidation of sulphide-bearing sediments.
At present, most of the ASS in this area have been reclaimed for rice cultivation (Wang & Luo Reference Wang and Luo2002). The soils have a thin, black/brown (10 YR 3/2 according to Munsell Color 1971), clay surface horizon (0–40 cm) overlying a yellowish (2·5 Y 7/6), silty clay sub-soil of similar thickness with red (10 R 5/6) mottles and yellow (2·5 Y 7/6) Jarosite mottles (40–80 cm). At depths below 80 cm, the underlying potential ASS layer is grey (2·5 GY 5/1) silty clay with some organic materials.
Soil samples were collected from four sites in June 2013. The four sites were selected to represent contrasting rice yields, due to the differences in their soil properties. The growth of rice planted on ASS is severely restricted (Lin Reference Lin1999), and the yield of rice in these soils is <5000 kg/ha in Guangdong Province. Additionally, some fields may be harvested only rarely due to high acidity. Since rice yield may be influenced by soil conditions, climate, fertilizer and cultivar, average rice yield over several years may be a more precise way to represent the actual production capacity of the local area. According to the preliminary survey results (5 years with ten rice crops), three fields with distinctly different rice yields were chosen for the present study and designated Fields A, B and C: rice yields in these fields were approximately 4500, 3000 and 1500 kg/ha, respectively, according to preliminary survey results. A fourth field, Field D, which represents abandoned land, was selected as the control treatment. Due to the lack of effective irrigation and drainage on Field D, bare ASS scald with little vegetation was formed. The rice yield reported for each sampling site is the average of 5 years. The soil samples were collected using an auger (width 45 mm) to a depth of 140 cm at 20 cm intervals at eight locations in each sampling site. The soil sampling depth was based on the appearance of a transitional horizon (Boman et al. Reference Boman, Åström and Frojdo2008). At a minimum, the plough layer, the most acidic horizon (Jarosite layer) and the transitional horizon (between the oxidized and the reduced layers) were sampled. After collection, the soil samples were placed in air-tight plastic bags and the air extruded before the bag was sealed. Another bag was then placed over the first bag. All samples were immediately frozen using liquid N in the field and kept frozen during transportation. The samples were taken to the laboratory within 24 h and were oven-dried at 85 °C to a constant weight, to kill any bacteria and rapidly remove water to minimize the oxidation of sulphides (Ahern et al. Reference Ahern, McElnea and Sullivan2004). The oven-dried samples were then finely ground into soil pellets with a diameter <2 mm and stored in air-tight plastic bags.
Analytical methods
All of the reagents were of analytical grade and prepared using deionized water. The soil moisture content was determined by heating a subsample at 85 °C to a constant weight. The soil pH-water (H2O) and pH-potassium chloride (KCl) were measured by inserting a pH probe (calibrated with standard buffer solution at pH 4·00 and 6·89) into a slurry with a soil:H2O ratio of 1 : 2·5 and a slurry with a soil:1 M KCl ratio of 1 : 2·5, respectively, which were prepared using 10 g of the oven-dried soils and 25 ml of either deionized water or 1 M KCl. The soluble and exchangeable acidity (ExA) were measured using the methods described by Lin et al. (Reference Lin, Melville and Valentine1999) with some modifications. The soluble acidity (SA) was estimated by titrating 1 : 5 soil:water extracts with 0·01 M sodium hydroxide (NaOH) solution to a pH of 5·5. The ExA was determined from the difference between the titratable acidity in 1 : 5 soil:1 M KCl extracts and the soluble acidity.
The sulphur fractions that contributed to the existing acidity were separated using a series of extractant solutions in deionized water (1 : 5), 0·1 M ethylenediaminetetraacetic acid (EDTA) solution (1 : 20) and 1 M hydrochloride (HCl) solution (1 : 25) (Lin et al. Reference Lin, Melville, Islam, Wilson, Yang and van Oploo1998). The EDTA-extractable sulphate includes soluble sulphate, gypsum and adsorbed sulphate, whereas the HCl-extractable sulphate includes EDTA-extractable sulphate, Jarosite and other relatively insoluble Fe/Al hydroxyl sulphate minerals (McElnea et al. Reference McElnea, Ahern and Menzies2002). The exchangeable sulphate (ES) was obtained by subtracting the water-extractable sulphate (SS) from the EDTA-extractable sulphate. The net acid-soluble sulphate (NAS) was determined by subtracting the EDTA-extractable sulphate from the HCl-extractable sulphate.
Data analysis
All of the data were statistically analysed using SPSS 18·0 software, and the mean values obtained for each treatment group were subjected to multiple-comparison analyses using the Least Significant Difference (LSD) test and a significance level of P < 0·05.
The study of the acid characteristics of regional ASS is intrinsically a multivariate problem because of the large number of acidic parameters (variables) associated with the different sampling sites (observations). Multivariate statistical methods provide information, from which relationships can then be inferred. In the present study, a correlogram of different acidic variables (pH-H2O, pH-KCl, SA, ExA, SS, ES and NAS) was created using the ‘corrgram’ package in R (R Development Core Team 2013) to calculate their correlation coefficients. The seven acidic variables in seven layers at the four sampling sites were analysed through principal component analysis (PCA) using the R statistical software (R Development Core Team 2013). The PCA was implemented using ‘Factor analysis and data Mining with R’ (FactoMineR) package (Husson et al. Reference Husson, Josse, Lê and Mazet2011). The approach used to implement the PCA in FactoMineR is described in detail by Lê et al. (Reference Lê, Josse and Husson2008). The key feature of this package is the possibility of taking into account different types of variances (quantitative or categorical), different types of data structures (partitions based on the variables or on the individuals) and finally supplementary information (supplementary individuals and variables).
RESULTS
pH
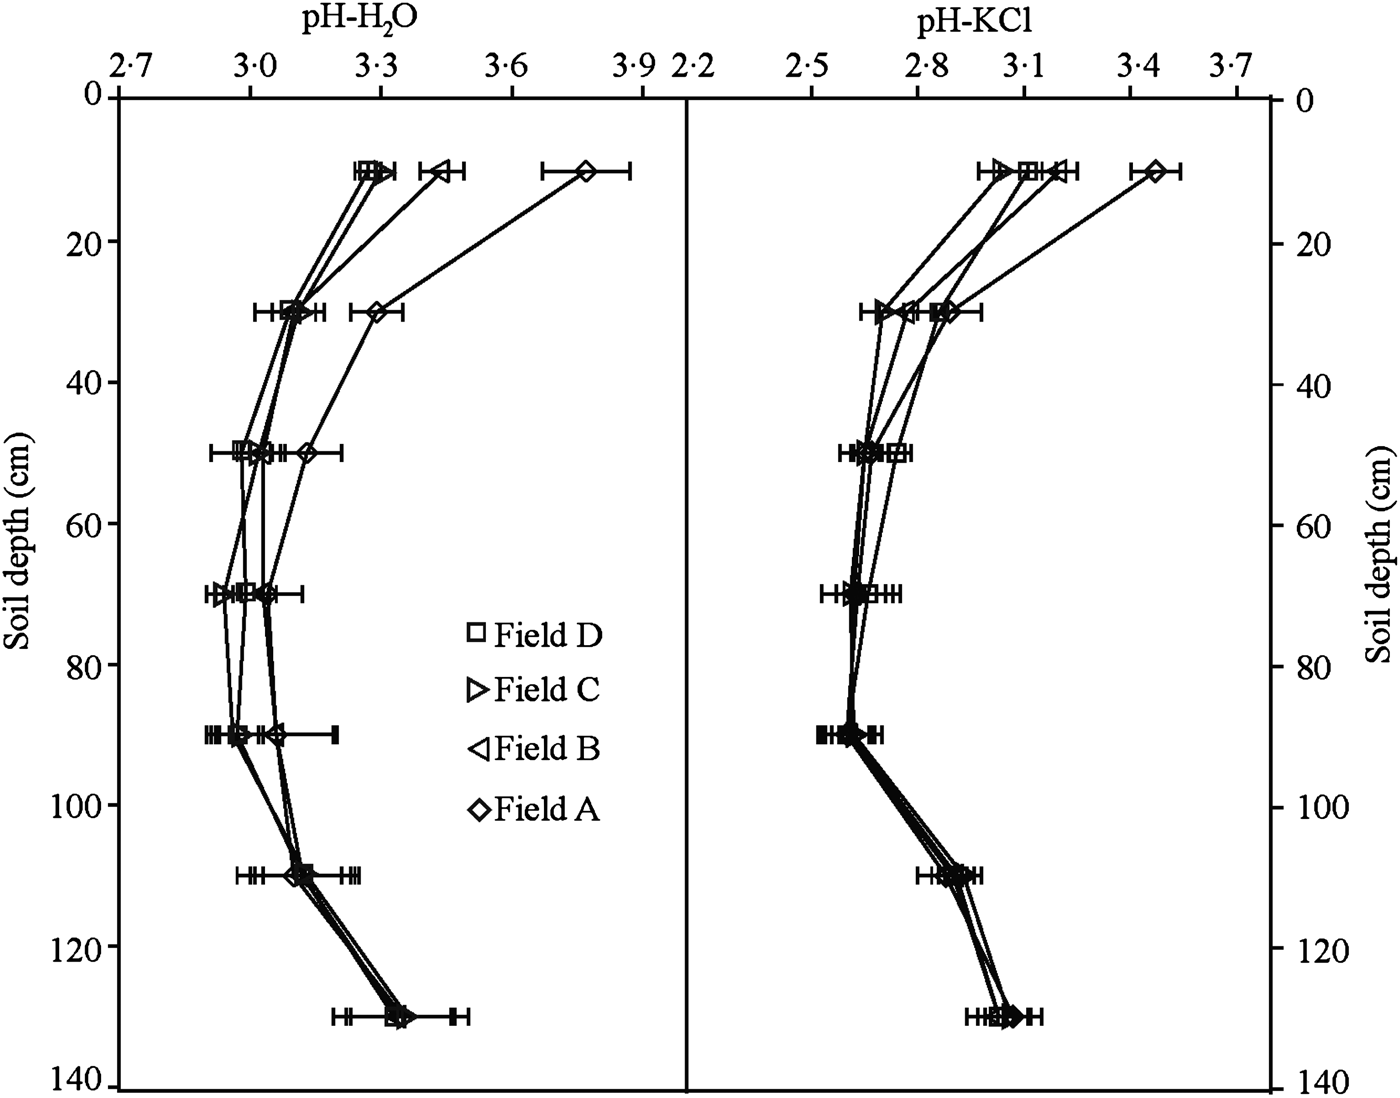
The pH values of the ASS (pH-H2O: 2·77–3·92, pH-KCl: 2·37–3·73) were very low at all of the sampling sites (Fig. 1). The pH values were relatively high in the topsoil (average pH values of pH-H2O 3·45 and pH-KCl 3·20), but decreased sharply at a depth of 80–100 cm and then increased at a depth of 120–140 cm. The lowest pH in the entire sampling soil profile was found at depths of 80–100 cm (average pH-H2O 3·00 and pH-KCl 2·65). Soil pH decreased by 0·30, 0·11, 0·02 and 0·03 (pH-H2O) and 0·40, 0·13, 0·03 and 0·01 (pH-KCl) with descending depth from 0 to 100 cm at 20-cm intervals. Therefore, rice cultivation reduced soil pH mostly in the plough layer, and the reduction extent decreased with depth.
Vertical distribution of pH-H2O and pH-KCl in the sampled fields. The bars indicate the standard error of the mean (n = 8).

The soil pH-H2O at a depth of 0–60 cm and the soil pH-KCl at a depth of 0–20 cm presented significant differences between the different sampling sites (P < 0·05). The soil pH-H2O at a depth of 0–20 cm and the soil pH-KCl at a depth of 0–20 cm in the 4500-kg sampling field were significantly higher than those obtained in the other sampling fields (P < 0·05). The pH-H2O in soils at a depth of 0–20 cm in Field B was higher than that observed in Fields C and D (P < 0·05). No differences in the pH values in soils at a depth of 80–140 cm were found between the sampling fields.
Actual acidity
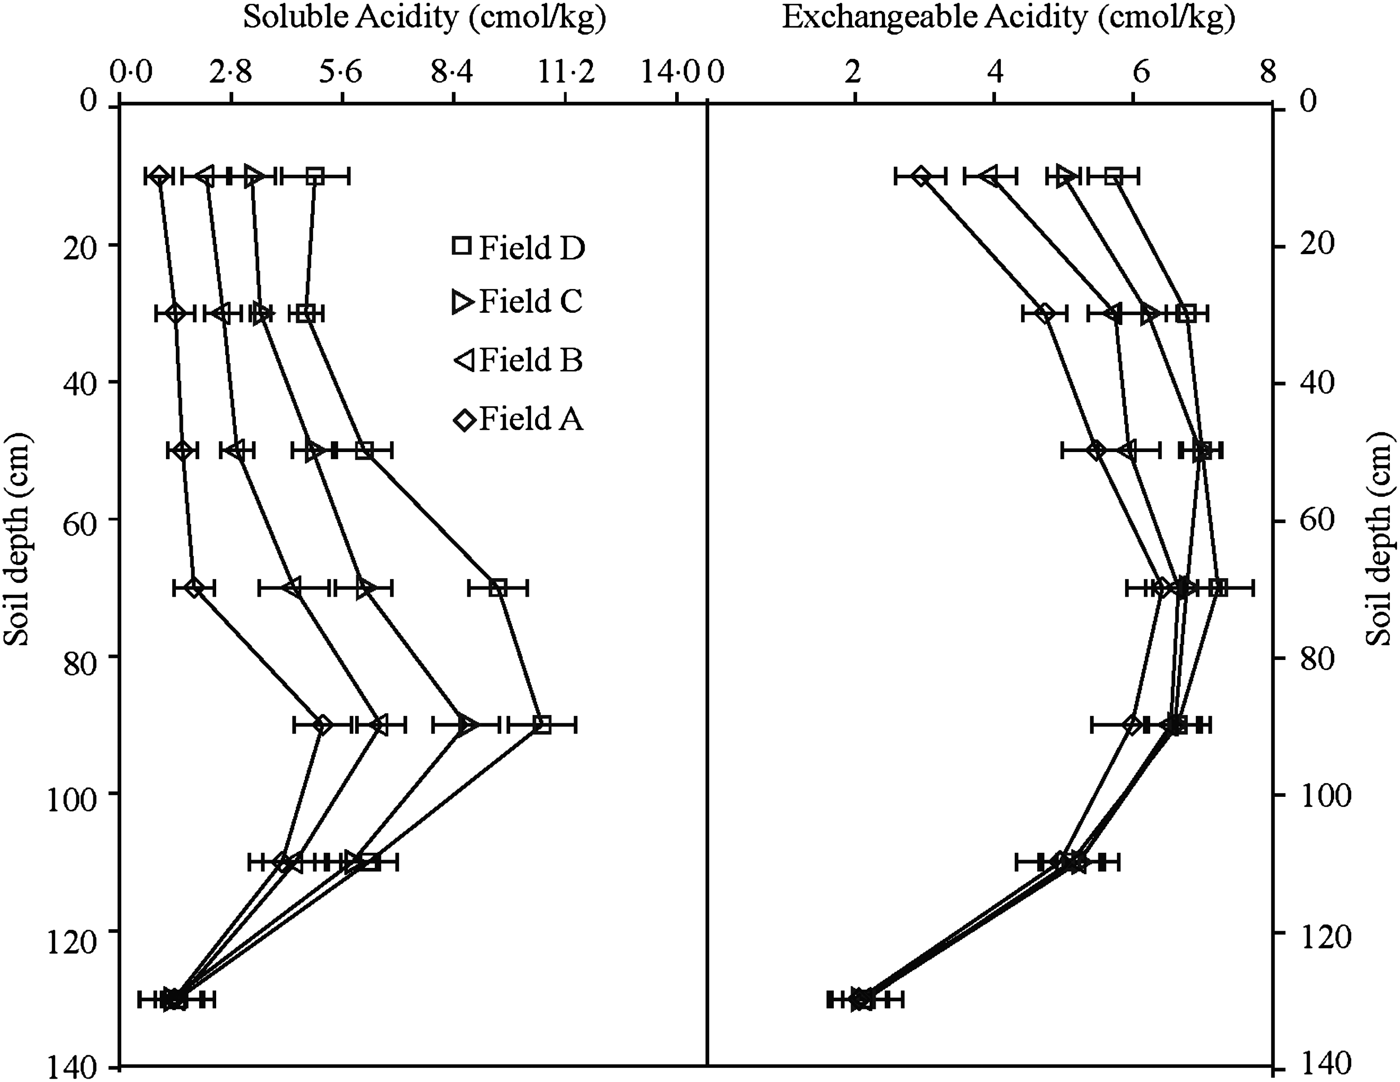
The actual acidity (AA) is the existing acidity already present in and readily released into the soil and arises from the soluble acidity and the ExA (Vithana et al. Reference Vithana, Sullivan, Bush and Burton2013). Both the SA and ExA were relatively low in the topsoil at all of the sampling fields and increased sharply with depth from 0 to 100 cm (for SA) and from to 0 to 80 cm (for ExA); these values continued to decrease with further decreases in depth, i.e. 120–140 cm (Fig. 2). The SA and ExA values of the plough layer in the cultivated rice fields were lower than those observed in the uncultivated fields and were negatively correlated with rice yields (Fig. 2). The vertical variation amplitude of the SA was more evident in the paddy soils with lower rice yields, particularly the uncultivated ASS. Compared with Field D, SA concentrations in soils at a depth of 0–100 cm in Field C, B and A were decreased by 1·86, 3·44 and 4·99 cmol/kg, respectively (P < 0·05). However, SA concentrations in soils below a depth of 100 cm were similar in all of the sampled fields.
Vertical distribution of soluble acidity (SA) and exchangeable acidity (ExA) in the sampled fields. The bars indicate the standard error of the mean (n = 8).

The vertical distributions of ExA in all of the sampled fields were similar (Fig. 2). The ExA in soils at a depth of 0–40 cm decreased significantly in the following order: Field D > Field C > Field B > Field A. Compared with Field D, the ExA concentrations in soils at a depth of 0–40 cm in Fields C, B and A decreased by 0·64, 1·40 and 2·40 cmol/kg, respectively (P < 0·05). The ExA concentrations were similar in the sub-soil below 40 cm (Fig. 2).
Sulphate fractions
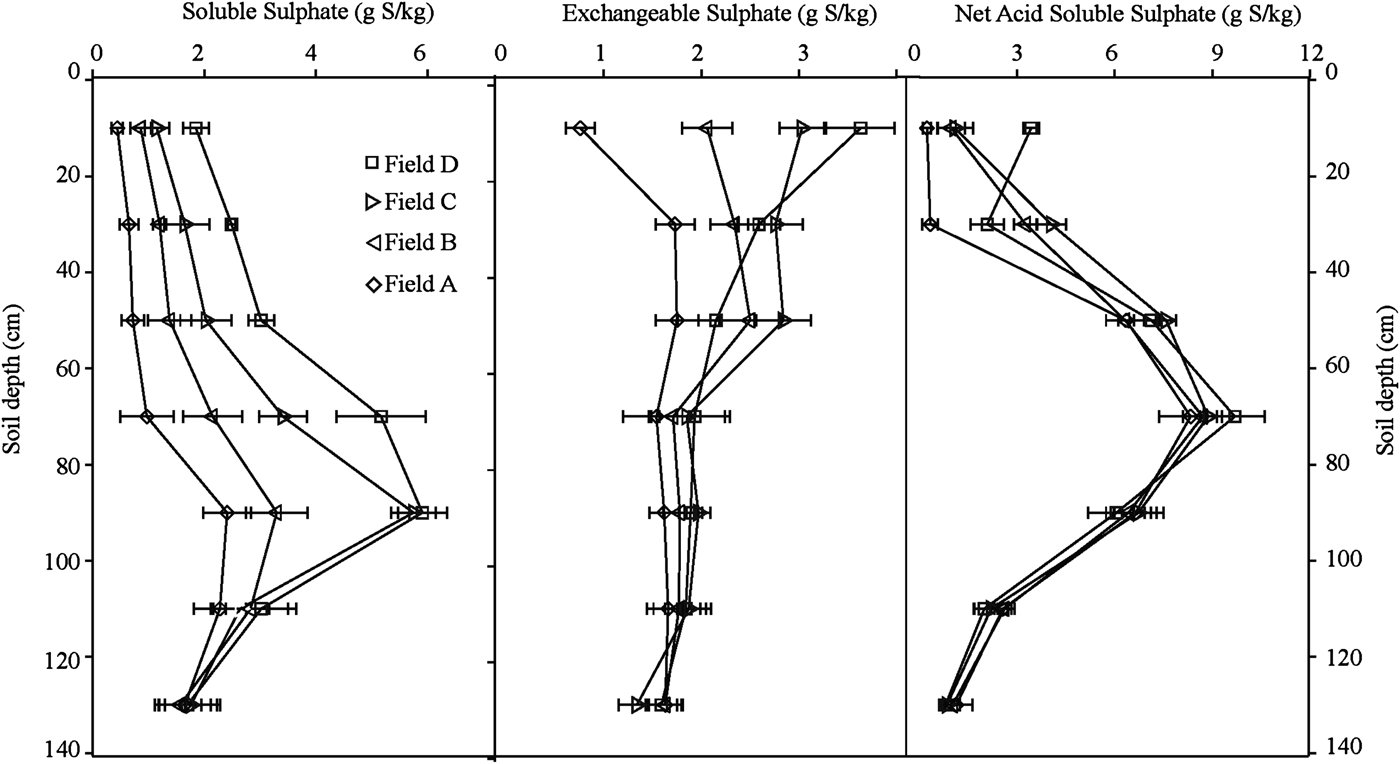
Sulphate is a product of pyrite oxidation and may form Fe/Al hydroxyl sulphate minerals to prevent the occurrence of extreme acidification in soils (Lin et al. Reference Lin, Melville, Islam, Wilson, Yang and van Oploo1998). However, the poorly soluble Fe/Al hydroxyl sulphate minerals hydrolyse with increases in pH and the release of acidity (Vithana et al. Reference Vithana, Sullivan, Bush and Burton2013). Thus, sulphate plays a key role in the acidification of ASS (Lin et al. Reference Lin, Melville, Islam, Wilson, Yang and van Oploo1998). The vertical distribution of SS and NAS values were similar to those found for SA and ExA, respectively (Fig. 3). However, the depth distribution of ES was uniform in all of the fields. Similar to SA, the SS concentrations in soils at a depth of 0–100 cm in Fields C, B and A were significantly lower than that observed in Field D (P < 0·05), and the SS decreased corresponding to rice yield in the field. Significant differences (P < 0·05) in the SS contents in soils at a depth of 0–100 cm were found among the different sampling fields in the following order: Field D > Field C > Field B > Field A (P < 0·05). Compared with Field D, the SS concentrations in soils at a depth of 0–100 cm in Fields C, B and A were decreased by 0·89, 1·91 and 2·65 g S/kg, respectively. The differences were most apparent in the upper layer of the soil. However, the ES and NAS at each soil depth did not vary among the different sampling fields. Compared with the uncultivated soil, ES contents in the soils at a depth of 0–20 cm were increased significantly by 0·60, 1·57 and 2·87 g S/kg in Fields C, B and A, respectively (P < 0·05). The ES values in soils at a depth of 20–140 cm in the different fields were similar. The NAS in the plough layer in the uncultivated land was significantly higher than those in the rice fields (P < 0·05), but the NAS at the plough pan in rice fields was slightly higher than that in the uncultivated field.
Vertical distribution of soluble sulphate (SS), exchangeable sulphate (ES) and net acid soluble sulphate (NAS) in the sampled fields. The bars indicate the standard error of the mean (n = 8).

Correlation between variables
As shown in Fig. 4, the pH-H2O was strongly positively correlated with pH-KCl, whereas all of the values were strongly negatively correlated with the SA, ExA, SS and NAS values. In addition, the distributions obtained for the SA and SS data were similar, and their correlation coefficients were as high as 0·95 (P < 0·01). The correlation coefficients between ES, SA and ExA were not significant, implying that gypsum and adsorbed-S may play a small role in the acidification of ASS. The NAS was strongly related to ExA (r = 0·67, P < 0·01) and was also significantly related to the SA (r = 0·56, P < 0·01) and SS (r = 0·48, P < 0·01).
Pearson correlation coefficients for relationships between different acid parameters (n = 8).

Assessment of the harmfulness of acidity on rice yield by principal component analysis
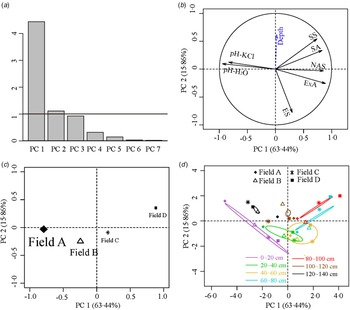
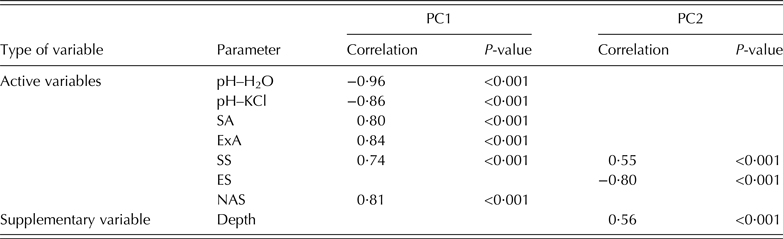
The results of PCA are present in Fig. 5. The first principal component (PC1) and the second principal component (PC2) were extracted because their eigenvalues were greater than unity, and the variables were retained if P < 0·05 (95% confidence level) (Fig. 5(a)) (Kaiser Reference Kaiser1958). These two principal components expressed 78·43% of the total variability (Fig. 5(b)), which suggests that most of the information provided by the seven initial variables was summarized using these two synthetic variables: PC1 mainly comprised of the variables ExA (with a correlation coefficient of 0·84, P < 0·01), pH-H2O (with a negative correlation of −0·96, P < 0·01), and NAS, SA, SS and pH-KCl (Table 1). However, PC2 was described by two quantitative variables only (SS and ES). Moreover, the supplementary quantitative variable depth was significantly linked to PC2 (with a positive correlation of 0·56, P < 0·01; Fig. 5).
Results of principal component analysis (PCA) of acidity parameters in acid sulphate soils (ASSs). (a) Eigenvalues associated with each dimension provided by the PCA. (b) Representation of the active and supplementary variables on planes 1–2. (c) Sampling sites on planes 1–2. (d) The confidence ellipses around the soil depth categories on the main plane induced by components 1 and 2.

Correlations of and explained variances by first principal component (PC1) and second principal component (PC 2)

The samples for Field A appeared on the negative side of PC1, whereas those for Fields B and C were closer to the positive side of this axis, and for Field D were closer to the positive side of PC1 and PC2 (Fig. 5(c)). Because the major contributing variables to PC1 were pH-H2O, pH-KCl, ExA, NAS, SA and SS (Fig. 5(c)), the decrease in the rice yield on ASS may be strongly related to the increase in acidity observed in the soil profile. More positive PC2 values were found for soil samples from Field D compared with the remaining samples.
Figure 5(d) shows the performance profile of every layer of the sampling fields on the PC1 and PC2 planes. The spatial distribution of soil layers at different depths is mainly separated by PC1. The soil layer at a depth of 40–100 cm was the most acidic soil section in all sampled fields.
The performance profiles of the different sampled fields at all of the layers were different, and the original variables that contributed to this disparity were different. pH-H2O, pH-KCl, ExA and NAS are the main variables that represent the acid features of the soil layers at depths of 0–40 and 120–140 cm, whereas SS, SA, ExA and NAS are the original variables that distinguished the extent of the acidity of the soil layer at a depth of 60–100 cm in the different sampled. However, the differences in the acid features at the depths of 40–60 and 100–120 cm were not significant among the different fields.
DISCUSSION
Change of acidity in acid sulphate soil used for rice cultivation
The acidity of ASS in the Pearl River Delta was the result of enclosing tidal land for agricultural cultivation, as it causes the oxidation of sulphide-bearing sediments (Boman et al. Reference Boman, Åström and Frojdo2008). As soil depth increases, the redox potential decreases, as does the oxidation rate of iron sulphide (Boman et al. Reference Boman, Åström and Frojdo2008). Therefore, the acidity released by the oxidation of iron sulphides decreased with increasing depth (Boman et al. Reference Boman, Åström and Frojdo2008, Reference Boman, Fröjdö, Backlund and Åström2010). The acidity and sulphate in all fields sampled in the present study increased markedly with descending depth from 0 to 100 cm and then decreased rapidly with descending depth from 100 to 140 cm, which is a common phenomenon in ASS used for agriculture (Mathew et al. Reference Mathew, Panda and Nair2001; Boman et al. Reference Boman, Fröjdö, Backlund and Åström2010). The higher pH values obtained in the plough layer are a result of leaching, liming and a relatively higher organic matter concentration (Boman et al. Reference Boman, Åström and Frojdo2008), and the decreasing soil pH in deeper layers is a feature of the ASS used for cultivation, caused by the oxidation of sulphides (Faltmarsch et al. Reference Faltmarsch, Österholm, Greger and Åström2009).
The acidity at a depth of 100–140 cm was similar in all of the sampled fields, which suggested that the conditions of the soil parent materials of the different fields were uniform. As soil depth decreases, the oxidation rate of sulphide increases, and the influence of agricultural measures on the acidity characteristic of soils is stronger. Tillage measures, such as straw mulching, soil surface ploughing and ditch digging, used in most acid sulphate paddy fields in the Pearl River Delta, may affect soil water movement, thereby affecting the acidity and sulphate movements in the soils (Minh et al. Reference Minh, Tuong, van Mensvoort and Bouma1997, Reference Minh, Tuong, van Mensvoort and Bouma1998; Ward et al. Reference Ward, Sullivan and Bush2004; Boman et al. Reference Boman, Åström and Frojdo2008; Kawahigashi et al. Reference Kawahigashi, Do, Nguyen and Sumida2008a ). The acidification of topsoil (0–40 cm) is probably caused by the upward transport of acid sulphate materials generated in the sub-soil through capillary action (Lin et al. Reference Lin, Melville and Valentine1999). Conversely, when ASS are used for rice cultivation, the land is often waterlogged, which may result in markedly lower upward transport of acid ions. Additionally, a low permeable layer exists in paddy fields at a depth of 20–40 cm due to long-term tillage practices, which may suppress the upward movement of soil water (Hanhart et al. Reference Hanhart, Ni, Bakker, Bil, Postma and van Mensvoort1997). Substantial acidic substances are prone to accumulate in this layer (20–40 cm), because of the low permeability. The ExA and sulphate content were substantially higher in the soils at a depth of 20–40 cm than those in the soils at the plough layer (0–20 cm).
As influenced by tillage measures, differences in the acidity and sulphate in different sampling fields were observed. The differences in the SA and sulphate observed in the soils at a depth of 60–100 cm in the different sampling fields were greater than those observed at 0–20 cm. However, the greatest differences in the ExA and sulphate were observed at 0–40 cm in the different sampling fields. Soluble acidity and sulphate are more readily leached downward under waterlogged cropping systems. In addition, the existence of a slightly permeable layer in paddy fields at a depth of 20–40 cm not only changed the upward movement of the acidic ions but also influenced the upward movement of sulphuric ions. The slightly permeable layer may strongly control the dynamics of water-soluble substances in ASSs (Kawahigashi et al. Reference Kawahigashi, Do, Nguyen and Sumida2008b ). Therefore, the acidity and sulphate content of the soils in the plough layer of paddy fields were significantly lower than those found in uncultivated ASS. Rice cultivation may slow ASS acidification and leach more SA and SS down to deeper layers of the soil profile (Dent & Pons Reference Dent and Pons1995).
Reduction in rice growth due to the acidity of acid sulphate soil
The tillage measures used for rice cultivation influence the acidity and sulphate content of ASS which subsequently affects crop growth (Husson et al. Reference Husson, Verburg, Phung and Van Mensvoort2000; Mathew et al. Reference Mathew, Panda and Nair2001; Shamshuddin et al. Reference Shamshuddin, Muhrizal, Fauziah and Husni2004; Kang et al. Reference Kang, Seo, Lee, Vijarnsorn and Ishii2010). The acidity-producing capability of ASS is a major consideration and has a lasting effect on the main characteristics of these soils (Fanning Reference Fanning and Lal2002). Acidity directly damages rice and also adversely affects rice growth by mobilizing many potentially toxic metals or limiting the bioavailability of essential nutrients (Ljung et al. Reference Ljung, Maley, Cook and Weinstein2009). Most of the metals ions, particularly Al, in the soil are mobilized in excess when the soil pH is <4, thereby inhibiting rice growth (Kinraide Reference Kinraide1997; Kang et al. Reference Kang, Seo, Lee, Vijarnsorn and Ishii2010). Phosphorus-sorption in ASS is greatly influenced by Al-oxides, Fe-oxides and Mn, which are governed by soil pH (Krairapanond et al. Reference Krairapanond, Jugsujinda and Patrick1993). Therefore, as the acidity accumulated in ASS increases, P availability in soil is more strongly depressed, leading to higher P-deficiency in the rice crop (Golez & Kyuma Reference Golez and Kyuma1997). Some researchers have found that nitrification in ASS may be suppressed because of the acidic soil conditions (Roelofs Reference Roelofs1983). In addition, calcium (Ca), Mg, K, Cu and nickel (Ni), which are essential to rice growth, have been shown to be mobilized and leached out from the acidic plough layer, leading to nutrient deficiency in rice (Åström Reference Åström1998; Claff et al. Reference Claff, Sullivan, Burton, Bush and Johnston2011). Symptoms of nutrient disorder in rice grown in ASS have been shown by yellowing and purpling of the leaves followed by the appearance of brown spots (Kawahigashi et al. Reference Kawahigashi, Do, Nguyen and Sumida2008a ). Therefore, the growth of rice in ASS is limited and its yield is significantly reduced (Mathew et al. Reference Mathew, Panda and Nair2001; Ljung et al. Reference Ljung, Maley, Cook and Weinstein2009). The most important factor constraining rice growth in ASS is acidity (Moore et al. Reference Moore, Attanandana and Patrick1990). In the present study, rice yield decreased with increases in the soil acidity through the profile, which reinforces the above-described argument.
Soluble acidity, ExA and RA are the active and main fractions of acidity in ASS (Vithana et al. Reference Vithana, Sullivan, Bush and Burton2013). The impact of acidity within deeper soil layers on rice growth appears difficult to assess. If acidity stored below ground is transferred to soils above the Jarosite horizon by the capillary movement of soil water, a negative feedback to rice growth would occur.
The soil acidity differed significantly in the ASS where the rice yielded from 1500 to 4500 kg/ha. As SA and SS in soils at 0–100 cm depth increased significantly, the yield of rice decreased. Soluble acidity and soluble sulphate (SA) in soils at 60–100 cm depth was a more sensitive indicator of soil quality that affected rice yield than that in soils at 0–40 cm depth. The ExA concentrations in soils at 0–40 cm also increased significantly in the ASS, where the rice yields decreased. The NAS in the most acidic soil layer (60–100 cm) was abundant and presented a strong correlation with rice yields. Rice growth was influenced directly by the soil conditions of the plough layer, but the soluble acidity, SA and NAS in soils at 0–20 cm depth, and ExA in soils at 0–40 cm may be the most sensitive indicators in assessing the soil quality that affected rice growth in ASS.
It has been suggested that soluble acid in ASS mostly exists as SA complexes (Lin et al. Reference Lin, Melville and Valentine1999; Wang & Luo Reference Wang and Luo2002). The SS and SA were mainly stored in soils at 60–100 cm depth and were more readily able to move upward with capillary action, so could reach the rice root zone rapidly. Although NAS releases acidity slowly, 1 mole of NAS can release 2 or 3 moles of acidity, and the NAS is a key source of acidity in ASS (Vithana et al. Reference Vithana, Sullivan, Bush and Burton2013). Therefore, NAS is the most important acidity pool in ASS and may significantly affect rice growth. Lin et al. (Reference Lin, Islam, Bush, Sullivan and Melville2000) suggested that NAS may pose little harm if no significant amount of SA has accumulated in the soil. However, the correlation between NAS and SA was found to be statistically significant in all of the sampling fields used in the present study. Net acid-soluble sulphur is often observed in extremely acidic ASS (i.e. pH <4·0) (Vithana et al. Reference Vithana, Sullivan, Bush and Burton2013), which may explain why it was significantly correlated to the SA and ExA. This finding suggests that the NAS content of the Jarosite layer should be taken into consideration when implementing amelioration of ASS where considerable SA has accumulated from the standpoint of rice cultivation.
CONCLUSIONS
The acidity and sulphate in paddy fields increased markedly with descending depth from topsoil to Jarosite horizon and then rapidly decreased with descending depth. Significant SA and SA in soils above the Jarosite horizon are reduced due to the tillage practices used in rice cultivation. Conversely, the soluble acidity, exchangeable acidity, SA and NSA contents of the ASS were significantly associated with the rice yield. Exchangeable acidity of soils in the plough layer (0–20 cm) is the most sensitive indicator of soil quality that affected rice yield. The soluble acidity, SA and NSA in soils at 60–100 cm depth were more sensitive indicators of soil quality affecting rice yield than in soils at 0–40 cm depth.
This project was supported by a Special Fund for Agro-scientific Research in the Public Interest of China (Grant No. 201003016) and Guangdong Science and Technology of China (Grant No. 2012A020100004).