Various methods, such as spot-mapping and radio-telemetry (in the following telemetry), exist to assess space use and movement of animals (Bibby et al. Reference BIBBY, BURGESS, HILL and MUSTOE2000). Space use depends on the ecology of a species and the degree of its ecological specialization. The size of territories (i.e. home ranges) may vary among regions, and among seasons, depending on the amount of resources available (Hansbauer et al. Reference HANSBAUER, STORCH, PIMENTEL and METZGER2008). The displacements may vary depending on the habitat configuration, with increasing movements in fragmented landscapes compared with interconnected ones (Hansbauer et al. Reference HANSBAUER, STORCH, PIMENTEL and METZGER2008); and displacements also show temporal variation, with restricted movement during the middle of the day due to high temperatures, and movement peaks during the morning and evening (Manu & Cresswell Reference MANU and CRESSWELL2013).
There are different methods available to collect data on space use and movement of animals, such as spot-mapping, including point and transect counts and ‘look-see counting’ (Withey et al. Reference WITHEY, BLOXTON, MARZLUFF, Millspaugh and Marzluff2001). Another technique is telemetry which allows the collection of data over larger spatial and temporal scales (Jeltsch et al. Reference JELTSCH, BONTE, PE'ER, REINEKING, LEIMGRUBER, BALKENHOL, SCHRÖDER, BUCHMANN, MUELLER, BLAUM, ZURELL, BÖHNING-GAESE, WIEGAND, ECCARD, HOFER, REEG, EGGERS and BAUER2013). Previous studies have shown that spot-mapping provides very valuable and detailed information on habitat selection and species behaviour. However, this method might fail to cover rare far-distance movements and therefore underestimate movement distances. Telemetry may overcome these biases, as it incorporates rare excursions and thus will produce a more realistic picture of the space use of species (Jeltsch et al. Reference JELTSCH, BONTE, PE'ER, REINEKING, LEIMGRUBER, BALKENHOL, SCHRÖDER, BUCHMANN, MUELLER, BLAUM, ZURELL, BÖHNING-GAESE, WIEGAND, ECCARD, HOFER, REEG, EGGERS and BAUER2013). In parallel, detailed observations on the behaviour of organisms including precise occurrence mapping (especially in fine-grained mosaic landscapes) might be problematic with this method.
Previous studies used only one of these two techniques, but did not evaluate potential advantages and limitations of either approach. In this study we used both methods to measure movement behaviour and habitat selection of the Hinde's babbler, Turdoides hindei. This bird species is a Kenyan endemic and depends on riparian vegetation. The species is a cooperative breeder and thus exists in distinct family groups differing in size (ranging between two to 10 individuals) (Shaw et al. Reference SHAW, NJOROGE, OTIENO and MLAMBA2014). In this study we observed four identical family groups, using spot-mapping and telemetry. Based on the data obtained we will identify differences of data obtained from the two methods and will discuss advantages and limitations of the two techniques.
We conducted this study in a 2-km2 area adjacent to Nzeeu River in south-east Kenya (1°23′53.30′′S, 38°0′44.02′′E). The rapidly growing human population in this region caused the vanishing of most pristine riparian thickets, and turned this landscape into a mosaic consisting of shrubs, open agricultural land and settlements (Redpath et al. Reference REDPATH, YOUNG, EVELY, ADAMS, SUTHERLAND, WHITEHOUSE, AMAR, LAMBERT, LINNELL, WATT and GUTIERREZ2013). We mapped the land cover manually with GPS devices (Garmin Etrex H, Kansas, USA) and categorized it into thicket (indigenous and exotic invasive Lantana camara shrubs), agricultural land (with vegetables and fodder crops) and settlements/roads. The land cover map was developed using Quantum GIS 2.4.0, and subsequently used to analyse space use of the species.
We observed four family groups of T. hindei by using spot-mapping and telemetry from mid-September to mid-November 2013 (spot-mapping) and in March 2015 and 2016 (telemetry). Due to the fact that all data were collected during the end of the dry season and thus represent identical seasonal stages, and the fact that land-cover did not change considerably during this time, we assume comparability of our data. The four family groups varied in the number of members (from three to seven individuals). This divergence allowed us to distinguish among the groups observed. For both techniques, locations were taken every 10 min between 7h00 and 17h00.
For spot-mapping, we followed the family groups by the detection of the contact calls over a period of three months, during September till November 2013. GPS coordinates of individuals were determined with a GPS device (Garmin Etrex H, Kansas, USA), after the respective family group moved further. A similar number of locations were measured for each of the four groups (about 250 per group). Data for each family group equally covered the course of the day.
We collected telemetry locations for five individuals of T. hindei belonging to the same four family groups as observed by spot-mapping during March 2015 and 2016. Birds were caught with mist nets and individually ringed. We attached a Pip Ag376 radio transmitter (Biotrack Ltd, Wareham, UK) using an under-wing loop of rubber band. Tags had a 25-ms signal at a pulse rate of 55 pulse min−1 (Biotrack Ltd, Wareham, Dorset, UK). The weight of the tags was about 1.5 g and thus below the accepted threshold value of a maximum of 4–5% of the body weight for the study species (mean weight measured: 65 g) (Kenward Reference KENWARD2001). The positions of each bird were estimated by triangulation using R-1000 telemetry receivers (Communication Specialist Inc. Orange, Canada) equipped with four-element Yagi-antennas (HB9CV; Wagener Telemetrieanlagen, Cologne, Germany). The bearing was taken simultaneously every 10 min using a compass. Telemetry locations were collected between 7h00 and 17h00. To avoid potential discrepancies from its typical behaviour, tracking of individuals started 1 d after the bird was caught and the transmitter was set (Kenward Reference KENWARD2001).
To account for differences in the number of locations collected among groups and individuals, we used subsets of 100 locations per individual i.e. group, which were randomly selected without replacement out of the entire data sets for each group and individual, respectively (n = 29 subsets based on the sample size per group/individual/100; for sample sizes per group/individual). We subsequently calculated home-range sizes based on each subset, for four groups observed and four radio-tagged individuals (here we included the four individuals with >100 data points), by using minimum convex polygons including 95% of locations (MCP95) and the fixed kernel method with 95%, 75% and 50% contours (K95, K75, K50). All calculations were performed using the R package ‘adehabitatHR’.
To assess habitat selection, bird locations were intersected with the land-cover map and locations were attributed to the respective land-cover category. Observed habitat selection was calculated for every subset separately and compared to random data points (i.e. expected habitat availability). Expected habitat availability was calculated by placing 100 data points randomly within a buffer of 160 m (mean distance of observed locations to the central point) around the mean coordinate of every subset. In the following we calculated percentages of every land-cover category per group and individual as number of data points attributed to a certain land-cover category in relation to the total number of observed and random locations.
To study diurnal variability in movement behaviour we divided locations into four temporal intervals: morning (7h00–9h30), forenoon (9h40–12h10), noon (12h20–14h50) and afternoon (15h00–17h20). Displacements were calculated as distance (m) moved per 10 min. For these analyses all locations collected for the four T. hindei groups (spot-mapping) and the five individuals (telemetry, here we considered also the individual with low numbers of fixes) were used and calculations were performed with the R package ‘adehabitatLT’.
To test for differences in home-range size, in habitat selection and in diurnal movement among spot-mapping vs. telemetry we applied linear mixed-effects models (lme) with a maximized log-likelihood implemented in the ‘nlme’ R package version 3.1-103. Models for home-range size additionally contained a home-range estimator (MCP95, K95, K75, K50), models for habitat selection (observed vs. expected habitat availability/use), and models for displacements contained the temporal interval (morning vs. forenoon vs. noon vs. afternoon) as explanatory variables. In all models we included two-way interactions. To achieve a normal error distribution or to avoid heteroscedasticity, home-range size and displacements were log(x + 1) transformed. To account for repeated measurements of groups and individuals due to the partition of each data set into subsets of 100 locations, individual identity (home-range size/habitat use: n = 8; displacements: n = 9; for details on the number of subsets used per bird group/individual) was included as a random effect. Different variances per bird group/individual or recording method were modelled using the varIdent variance structure implemented in the nlme library, whenever necessary to improve residual homogeneity. Significance of terms in the best model was assessed by calculating the F- and P-values of an ANOVA table. Contrasts between factor levels were investigated by least-squares means from the minimal adequate model using the R package ‘lsmeans’ version 2.17. For all analysis we used R 3.0.2.
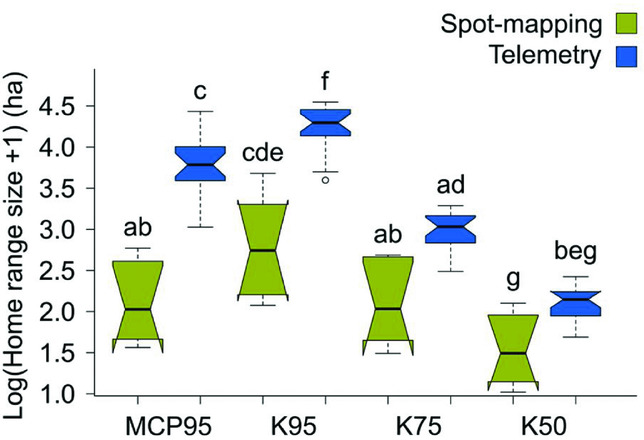
Our results showed significantly larger home-range sizes based on telemetry if compared with spot-mapping for MCP95 and K95 (interaction method × estimator; F3,102 = 122, P < 0.001), but not for K75 and K50 (Figure 1). Home-range size was smaller when based on spot-mapping (10 ± 2 ha; mean value calculated from the four home-range estimators) than on telemetry (35 ± 3 ha; F1,6 = 13.6, P = 0.01), and declined from K95 (56 ± 5 ha; mean value calculated from spot-mapping and telemetry) over MCP95 (34 ± 4 ha) to K75 (16 ± 1 ha) and K50 (6 ± 0 ha; F3,102 = 740, P < 0.001; for home-range sizes among groups/individuals).
Home-range sizes of Turdoides hindei assessed with spot-mapping and telemetry along Nzeeu River, south-east Kenya. Boxplots for comparisons between both tracking methods (spot-mapping vs. telemetry) of home-range sizes as a function of the home-range estimators (minimum convex polygons including 95% of locations (MCP95), fixed kernel method with 95%, 75% and 50% contours (K95, K75, K50)). Raw data were used to plot boxes. Whiskers extend to the most extreme data point which is no further than 1.5 times the interquartile range from the box. Notches give a 95% confidence interval for comparing medians. Differences between factor levels were investigated by least-squares means based upon parameter estimates from the minimal adequate model. Boxes sharing the same letter are not significantly different from one another.

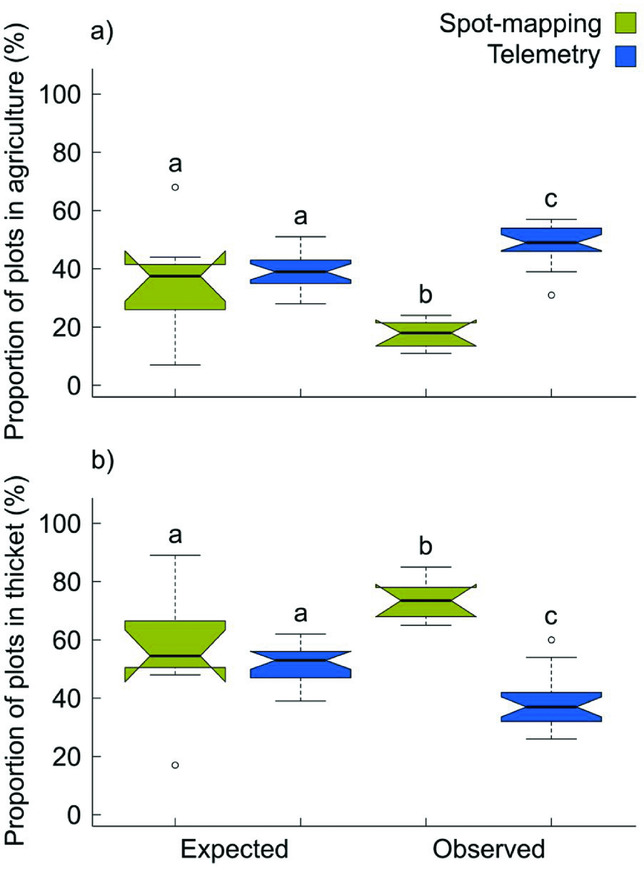
Data from spot-mapping showed that the usage of agricultural land was lower than randomly expected (interaction method × habitat selection; F1,48 = 154, P < 0.001; Figure 2a) and usage of thickets higher than expected (F1,48 = 89. 3, P < 0.001; Figure 2b), whereas based on telemetry the pattern was opposite (Figure 2a, b). Observed use of agricultural land was lower in the case of spot-mapping compared with telemetry (F1,6 = 226, P < 0.001; Figure 2a), whereas the reverse pattern was found for thickets (74% ± 2% vs. 38% ± 2%; F1,6 = 107, P < 0.001; Figure 2b). Observed habitat use of agricultural land (40% ± 3%; F1,48 = 17.3, P < 0.001) was higher than expected (38% ± 2%), with reverse patterns being shown for thickets (observed: 48% ± 3%; expected: 53% ± 2%; F1,48 = 18.5, P < 0.001). We observed that birds in thickets were mainly slowly foraging, roosting, and on the search for food sources (mainly on the ground); in contrast, in agricultural land, birds frequently used single trees as stepping stones to move and transgress these open landscapes.
Habitat selection of Turdoides hindei assessed with spot-mapping and telemetry along Nzeeu River, south-east Kenya. Boxplots for comparisons between both tracking methods (spot-mapping vs. telemetry) of habitat availability/use as a function of observed vs. expected locations for agricultural land (a), and thicket patches (b) (raw data were used to plot boxes). Whiskers extend to the most extreme data point which is no further than 1.5 times the interquartile range from the box. Notches give a 95% confidence interval for comparing medians. Differences between factor levels were investigated by least-squares means based upon parameter estimates from the minimal adequate model. Boxes sharing the same letter are not significantly different from one another.

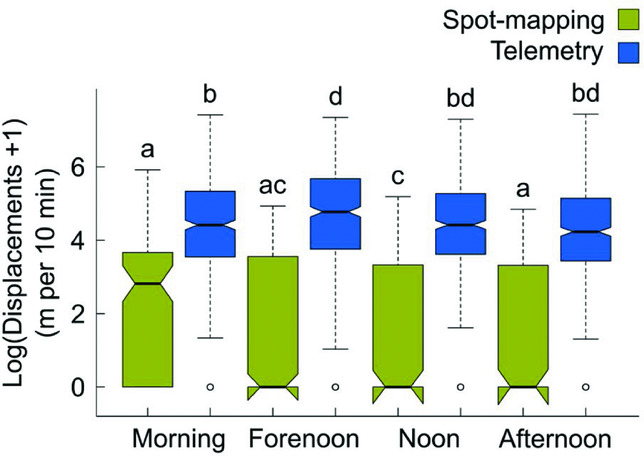
Displacements were shortest for spot-mapping at noon and longest when applying telemetry during forenoon (interaction method × day time; F3,2541 = 4.91, P < 0.01; Figure 3). Displacements from spot-mapping (20 ± 1 m per 10 min; mean value calculated from the four temporal intervals) were shorter than displacements from telemetry (182 ± 5 m per 10 min; F1,7 = 629, P < 0.001). Altogether, displacements increased from morning (143 ± 9 m per 10 min; mean value calculated from spot-mapping and telemetry) to forenoon (151 ± 9 m per 10 min), and decreased again to noon (133 ± 81 m per 10 min) and afternoon (138 ± 9 m per 10 min; F3,2541 = 6.63, P < 0.001). Minimum and maximum displacements for telemetry ranged from 0 to 372 m, and for telemetry from 0 to 1698 m.
Displacements of Turdoides hindei assessed with spot-mapping and telemetry along Nzeeu River, south-east Kenya. Boxplots for comparisons between both tracking methods (spot-mapping vs. telemetry) of mean displacements between each sequential pair of locations as a function of the different temporal intervals (raw data were used to plot boxes). Whiskers extend to the most extreme data point which is no further than 1.5 times the interquartile range from the box. Notches give a 95% confidence interval for comparing medians. Differences between factor levels were investigated by least-squares means based upon parameter estimates from the minimal adequate model. Boxes sharing the same letter are not significantly different from one another.

When comparing our data we found significant differences between both techniques applied: home-range sizes of telemetry data were four to five times larger than with spot-mapping (MCP95, K95), whereas home ranges for the core area (K75, K50) showed no significant difference, which is congruent with previous studies (Vander Wal & Rodgers Reference VANDER WAL and RODGERS2012). Displacements were nine times larger for telemetry than for spot-mapping (ranging from 0 to 1698 m for telemetry for telemetry and from 0 to 372 m for spot-mapping). These differences may arise from the nature of data-collection: For successful spot-mapping observers mainly perform data collection in habitat structures with highest success rates to find and track the targeted species (see Buckland et al. Reference BUCKLAND, MARSDEN and GREEN2008). In contrast, observers applying spot-mapping may miss moves of birds which are hidden in shrubs (Buckland et al. Reference BUCKLAND, MARSDEN and GREEN2008). Here, especially long-distance excursions might be impossible to track; this can produce restricted home-ranges and shorter displacements (Buckland et al. Reference BUCKLAND, MARSDEN and GREEN2008). In contrast, telemetry also includes rare excursions, and the observer bias as reported for spot-mapping can be largely excluded.
Looking at the habitat preferences, telemetry indicates that T. hindei can also be found in open agricultural land while spot-mapping clearly showed that T. hindei is mainly found in dense riparian thicket (with a proportion of 48% based on telemetry, in comparison to 17% based on spot-mapping). These contradictory results may arise from two non-exclusive coherences: The fine-grained mosaic of riparian thicket patches (mean patch size: 1.28 ± 0.25 ha) and agricultural land (mean patch size: 0.75 ± 0.11 ha), in combination with the inaccuracy of location estimates based on VHF triangulation (here, the inaccuracy of positioning was about 44 m). The probability that locations are displayed outside a riparian thicket due to high inaccuracy of triangulation (while in reality T. hindei is inside dense thicket, see Shaw et al. Reference SHAW, NJOROGE, OTIENO and MLAMBA2014) is very likely. In contrast, data from spot-mapping underline restricted movement and long-term roosting in dense thickets. However, rare excursions might be missed with this method. Thus, spot-mapping detects routine movements, habitat preferences of species and foraging at local scales (within habitat patches) and directly link movement ecology with species behaviour. However, telemetry considers rare long-distance movements and thus show longest displacements, which are of high relevance in regard of population dynamics and the potential to (re)colonize suitable habitats in fragmented environments.
In conclusion, the two techniques applied to the same family groups and individuals, and in the same study region and during identical seasons, showed diverging results. Nevertheless, when comparing techniques, data should be collected during identical time periods; thus, this remains a weak point in our study. Both techniques have their strengths but also various shortcomings. Scientists and conservationists on the ground have to consider the pros and cons, and should select the most convenient method, according to their research question, and the data requested. If habitat selection and behaviour of individuals are of interest, spot-mapping might be the best choice. Such information might provide important details on the habitat structure needed. However, data from telemetry might provide more realistic data on activity peaks and the distribution and size of kernels; such data can be used to quantify the space needed for a family group i.e. the size of a protected area needed to guarantee long-term persistence.
ACKNOWLEDGEMENTS
We thank Onesmus M. Kioko, Prester Kitonga, Stephen Mutinda, Claudia Dieckow, Jana Holler, Michelle Horn, Jana Igl, Janika Kerner, Dominik Meyer, Anke Müller, Anja Wiese, and Tine Busch for field assistance. This work was permitted by and conducted in close collaboration with the National Museums of Kenya (ornithology section). We thank Will Cresswell and one anonymous referee for their critical comments.