



1 Introduction
Wind-power variability occurs across a range of spatial and temporal scales due to several physical processes. Over very large scales, the summed power output of several geographically distant wind farms is smoothed due to individual wind farms being relatively uncorrelated. Whereas the power spectral density of the power output of a single turbine, or a small wind farm, has been shown to follow a power law of
 $\unicode[STIX]{x1D714}^{-5/3}$
(Apt Reference Apt2007), where
 $\unicode[STIX]{x1D714}$
is angular frequency, Katzenstein, Fertig & Apt (Reference Katzenstein, Fertig and Apt2010) observed a behaviour of
 $\unicode[STIX]{x1D714}^{-2.56}$
when considering the aggregated power of 20 wind farms. Bandi (Reference Bandi2017) later deduced a limit to the smoothing that can be achieved with wide geographic separation, corresponding to a power-law behaviour of
 $\unicode[STIX]{x1D714}^{-7/3}$
, arguing that the power fluctuations from many aggregate wind farms are dominated by the immutable variability of individual wind farms.
The
 $\unicode[STIX]{x1D714}^{-5/3}$
power law observed by Apt (Reference Apt2007) has been explained as stemming from the Kolmogorov
 $-5/3$
law for isotropic turbulence (Kolmogorov Reference Kolmogorov1941), as the power spectrum of a turbulent signal raised to any power will exhibit the same
 $\unicode[STIX]{x1D714}^{-5/3}$
behaviour (Milan, Wächter & Peinke Reference Milan, Wächter and Peinke2013; Tabar et al.
Reference Tabar, Anvari, Lohmann, Heinemann, Wächter, Milan, Lorenz and Peinke2014; Bandi Reference Bandi2017; Bossuyt, Meneveau & Meyers Reference Bossuyt, Meneveau and Meyers2017). This is relevant to the power spectra of wind turbines since
 $P\propto u^{3}$
, where
 $P$
is power and
 $u$
is the wind speed. However, deviations from
 $\unicode[STIX]{x1D714}^{-5/3}$
scaling have been observed at time scales typically smaller than tens of seconds for both wind farms and individual turbines, corresponding to the response time of a wind turbine (Apt Reference Apt2007; Milan et al.
Reference Milan, Wächter and Peinke2013; Chamorro et al.
Reference Chamorro, Lee, Olsen, Milliren, Marr, Arndt and Sotiropoulos2015; Bandi Reference Bandi2017). Tobin, Zhu & Chamorro (Reference Tobin, Zhu and Chamorro2015) sought to analytically explain deviation from Kolmogorov scaling due to rotor inertia, and arrived at a
 $\unicode[STIX]{x1D714}^{-11/3}$
power law. A trend consistent with this is seen in the spectra of Anvari et al. (Reference Anvari, Lohmann, Wächter, Milan, Lorenz, Heinemann, Tabar and Peinke2016). However, other processes have been shown to play a role in short-term power fluctuations. For instance, Anvari, Wächter & Peinke (Reference Anvari, Wächter and Peinke2017) observed high-frequency wind-farm fluctuations being affected on short time scales by the phase locking of the fluctuations of pairs of turbines.
Further, it has been observed (Stevens & Meneveau Reference Stevens and Meneveau2014) that the spectra of aggregate wind-farm power exhibit characteristic peaks at integer multiples of the advective frequency
 $\unicode[STIX]{x1D714}_{a}=2\unicode[STIX]{x03C0}/t_{a}$
, where
 $t_{a}$
is the time it takes for a passive tracer particle to travel between turbines. In attempting to explain this behaviour, formulations by Liu et al. (Reference Liu, Jin, Tobin and Chamorro2017) and Bossuyt et al. (Reference Bossuyt, Meneveau and Meyers2017) linked the power-production spectrum to the velocity spectrum, and incorporated the Kraichnan–Tennekes random-sweeping hypothesis (RSH) (Kraichnan Reference Kraichnan1964; Tennekes Reference Tennekes1975) to match with experimental wind-tunnel data. However, their approaches differed slightly; Bossuyt et al. treated the problem as a discrete sampling of the boundary layer, whereas Liu et al. focused on formulations for the two-point cross-spectrum. The RSH assumes that the turbulent velocity field is randomly advected by a large-scale sweeping velocity, and has been shown to be useful in modelling spatio-temporal spectra in turbulent boundary layers (Wilczek, Stevens & Meneveau Reference Wilczek, Stevens and Meneveau2015).
We attempt to explain the advection phenomenon by expanding on the work from Liu et al. (Reference Liu, Jin, Tobin and Chamorro2017) to derive analytical expressions for the cross-spectrum, and related coherence, of the power output of wind-turbine pairs using the RSH. We further test the ability of the RSH to predict the spectral correlation characteristics between turbine pairs with experimental wind-tunnel data across a range of flow characteristics, and evaluate the simplifying assumption used in both works that turbines act as passive probes of the turbulence.
2 Cross-spectra of wind-turbine pairs
2.1 Coherence spectrum
Consider the power spectrum
 $\unicode[STIX]{x1D6F7}(\unicode[STIX]{x1D714})$
of a signal
 $X(t)$
, which is defined as the Fourier transform of the signal’s autocovariance function
 $\unicode[STIX]{x1D6FE}(\unicode[STIX]{x1D70F})=\langle X(t)X(t+\unicode[STIX]{x1D70F})\rangle$
, as follows
 $$\begin{eqnarray}\unicode[STIX]{x1D6F7}_{X}(\unicode[STIX]{x1D714})=\int _{-\infty }^{\infty }\langle X(t)X(t+\unicode[STIX]{x1D70F})\rangle \text{e}^{-\text{i}\unicode[STIX]{x1D714}\unicode[STIX]{x1D70F}}\,\text{d}\unicode[STIX]{x1D70F}.\end{eqnarray}$$
Here,
 $\langle \cdot \rangle$
denotes the expected value. For a combined signal
 $X(t)=X_{1}(T)+X_{2}(t)$
, the autocovariance includes covariance terms, namely
 $\unicode[STIX]{x1D6FE}_{1,2}$
and
 $\unicode[STIX]{x1D6FE}_{2,1}$
, i.e.
 $$\begin{eqnarray}\unicode[STIX]{x1D6FE}_{X}=\langle [X_{1}(t)+X_{2}(t)][X_{1}(t+\unicode[STIX]{x1D70F})+X_{2}(t+\unicode[STIX]{x1D70F})]\rangle =\unicode[STIX]{x1D6FE}_{1}+\unicode[STIX]{x1D6FE}_{2}+\unicode[STIX]{x1D6FE}_{1,2}+\unicode[STIX]{x1D6FE}_{2,1},\end{eqnarray}$$
where
 $\unicode[STIX]{x1D6FE}_{1,2}(\unicode[STIX]{x1D70F})=\unicode[STIX]{x1D6FE}_{2,1}(-\unicode[STIX]{x1D70F})$
. This can be generalized to any number of combined signals
 $X_{i}$
for
 $i=1,2,\ldots ,N$
as:
 $$\begin{eqnarray}\unicode[STIX]{x1D6FE}_{N}=\mathop{\sum }_{i=1}^{N}\unicode[STIX]{x1D6FE}_{i}+\mathop{\sum }_{i=1}^{N-1}\mathop{\sum }_{j=i+1}^{N}[\unicode[STIX]{x1D6FE}_{i,j}+\unicode[STIX]{x1D6FE}_{j,i}].\end{eqnarray}$$
Because
 $\unicode[STIX]{x1D6FE}_{1,2}$
and
 $\unicode[STIX]{x1D6FE}_{2,1}$
are mirrored about
 $\unicode[STIX]{x1D70F}=0$
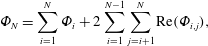
, their Fourier transforms are complex conjugates. Therefore, the combined power spectrum of the
 $N$
signals is given by:
 $$\begin{eqnarray}\unicode[STIX]{x1D6F7}_{N}=\mathop{\sum }_{i=1}^{N}\unicode[STIX]{x1D6F7}_{i}+2\mathop{\sum }_{i=1}^{N-1}\mathop{\sum }_{j=i+1}^{N}\text{Re}(\unicode[STIX]{x1D6F7}_{i,j}),\end{eqnarray}$$
where
 $\unicode[STIX]{x1D6F7}_{i,j}$
is the cross-spectrum of the signals
 $X_{i}$
and
 $X_{j}$
, and
 $\text{Re}(\cdot )$
is the real-part operator. When the two signals are perfectly correlated,
 $|\unicode[STIX]{x1D6F7}_{i,j}|=(\unicode[STIX]{x1D6F7}_{i}\unicode[STIX]{x1D6F7}_{j})^{1/2}$
. It is therefore natural to define the coherence spectrum
 $C_{i,j}$
as
 $$\begin{eqnarray}C_{i,j}(\unicode[STIX]{x1D714})=\frac{\unicode[STIX]{x1D6F7}_{i,j}(\unicode[STIX]{x1D714})}{\sqrt{\unicode[STIX]{x1D6F7}_{i}(\unicode[STIX]{x1D714})\unicode[STIX]{x1D6F7}_{j}(\unicode[STIX]{x1D714})}},\end{eqnarray}$$
although other related definitions exist.
2.2 The random-sweeping hypothesis
To predict the coherence of wind-turbine pairs, we use the Kraichnan–Tennekes random-sweeping hypothesis (Kraichnan Reference Kraichnan1964; Tennekes Reference Tennekes1975). In order to apply the RSH to turbine power production, it is convenient to treat wind turbines as passive probes of the turbulence so that the flow is laterally homogeneous. This is clearly not true, as turbine wakes are an important flow characteristic in wind farms. This assumption will be evaluated by the data. The RSH assumes that the turbulent velocity
 $\boldsymbol{u}^{\prime }$
does not evolve temporally, but is advected by a large-scale sweeping velocity
 $\boldsymbol{v}$
, i.e.
 $$\begin{eqnarray}\frac{\unicode[STIX]{x2202}\boldsymbol{u}^{\prime }}{\unicode[STIX]{x2202}t}+\boldsymbol{v}\boldsymbol{\cdot }\frac{\unicode[STIX]{x2202}\boldsymbol{u}^{\prime }}{\unicode[STIX]{x2202}\boldsymbol{x}}=0.\end{eqnarray}$$
The assumption that the small-scale turbulent field and the large-scale sweeping velocity do not nonlinearly interact cannot be strictly true, though it is attractive for its ability to make analytical expressions for turbulence spectra. Moreover, the RSH has been shown to make good predictions for spatio-temporal spectra in turbulent boundary layers (Wilczek et al.
Reference Wilczek, Stevens and Meneveau2015). The terms
 $\boldsymbol{u}^{\prime }$
and
 $\boldsymbol{v}$
in (2.6) are both vectorial. However, if the coordinate axes are defined such that
 $u_{1}$
is aligned with the mean wind and the yaw of the wind turbines, the other components can be ignored in estimating power fluctuations. Furthermore, since
 $\langle u_{1}^{\prime 2}\rangle$
is typically much larger than
 $\langle u_{2}^{\prime 2}\rangle$
and
 $\langle u_{3}^{\prime 2}\rangle$
in a turbulent boundary layer, equation (2.6) reduces to:
 $$\begin{eqnarray}\frac{\unicode[STIX]{x2202}u_{1}^{\prime }}{\unicode[STIX]{x2202}t}+(V_{1}+v_{1}^{\prime })\frac{\unicode[STIX]{x2202}u_{1}^{\prime }}{\unicode[STIX]{x2202}x_{1}}=0,\end{eqnarray}$$
where
 $u_{1}^{\prime }$
is the turbulent streamwise velocity fluctuation,
 $V_{1}$
is the mean sweeping velocity, taken as the hub-height velocity of the approaching boundary layer, and
 $v_{1}^{\prime }$
is the fluctuating streamwise sweeping velocity.
The Fourier transform (denoted with the symbol
 $\widehat{o}$
) of (2.7) with respect to
 $t$
conveniently converts the expression to an ordinary differential equation in
 $x_{1}$
for
 $\hat{u} (x_{1},\unicode[STIX]{x1D714})$
, as follows:
 $$\begin{eqnarray}\frac{\unicode[STIX]{x2202}\hat{u} (x_{1},\unicode[STIX]{x1D714})}{\unicode[STIX]{x2202}\boldsymbol{x}}=-\frac{\text{i}\unicode[STIX]{x1D714}}{V+v^{\prime }}\hat{u} (x_{1},\unicode[STIX]{x1D714}).\end{eqnarray}$$
If
 $v^{\prime }$
and
 $u^{\prime }$
are statistically independent, the cross-spectrum of the turbulent fluctuations at two points separated by a distance
 $\unicode[STIX]{x0394}x$
in the streamwise direction can then be expressed as:
 $$\begin{eqnarray}\unicode[STIX]{x1D6F7}_{0,\unicode[STIX]{x0394}x}=\langle \hat{u} (\unicode[STIX]{x0394}x,\unicode[STIX]{x1D714})\hat{u} (0,-\unicode[STIX]{x1D714})\rangle =\langle \hat{u} (0,\unicode[STIX]{x1D714})\hat{u} (0,-\unicode[STIX]{x1D714})\rangle \left\langle \exp \left(\frac{-\text{i}\unicode[STIX]{x1D714}\unicode[STIX]{x0394}x}{V+v^{\prime }}\right)\right\rangle .\end{eqnarray}$$
Here, we have assumed that the spectra at points
 $0$
and
 $\unicode[STIX]{x0394}x$
are statistically identical. If
 $v_{1}^{\prime }$
is further assumed small compared to
 $V_{1}$
, and to have a Gaussian probability distribution with zero mean and variance
 $\unicode[STIX]{x1D70E}_{v}^{2}$
, equation (2.9) can be integrated over the probability distribution of
 $v^{\prime }$
:
 $$\begin{eqnarray}\unicode[STIX]{x1D6F7}_{0,\unicode[STIX]{x0394}x}\simeq \frac{\langle \hat{u} (0,\unicode[STIX]{x1D714})\hat{u} (0,-\unicode[STIX]{x1D714})\rangle }{\sqrt{2\unicode[STIX]{x03C0}\unicode[STIX]{x1D70E}_{v}^{2}}}\int _{-\infty }^{\infty }\exp \left(\frac{-\text{i}\unicode[STIX]{x1D714}\unicode[STIX]{x0394}x}{V}+\frac{\text{i}\unicode[STIX]{x1D714}\unicode[STIX]{x0394}xv^{\prime }}{V^{2}}\right)\exp \left(-\frac{v^{\prime 2}}{2\unicode[STIX]{x1D70E}_{v}^{2}}\right)\,\text{d}v^{\prime }.\end{eqnarray}$$
The evaluation of the integral in (2.10) leads to:
 $$\begin{eqnarray}\unicode[STIX]{x1D6F7}_{0,\unicode[STIX]{x0394}x}=\langle \hat{u} (0,\unicode[STIX]{x1D714})\hat{u} (0,-\unicode[STIX]{x1D714})\rangle \times \exp \left(-\frac{\text{i}\unicode[STIX]{x1D714}\unicode[STIX]{x0394}x}{V}\right)\exp \left(-\frac{\unicode[STIX]{x1D714}^{2}\unicode[STIX]{x0394}x^{2}\unicode[STIX]{x1D70E}_{v}^{2}}{2V^{4}}\right).\end{eqnarray}$$
Making the further assumption that the lateral behaviour of the covariance function
 $\langle u^{\prime }(x,y,t)u^{\prime }(0,0,0)\rangle$
is separable, and takes the form of an exponential decay with a length parameter
 $L_{y}$
(Lukassen et al.
Reference Lukassen, Stevens, Meneveau and Wilczek2018), the final expression for the cross-spectrum is:
 $$\begin{eqnarray}\unicode[STIX]{x1D6F7}_{0,\unicode[STIX]{x0394}x}=\unicode[STIX]{x1D6F7}(0,0,\unicode[STIX]{x1D714})\times \exp \left(-\frac{\text{i}\unicode[STIX]{x1D714}\unicode[STIX]{x0394}x}{V}\right)\exp \left(-\frac{\unicode[STIX]{x1D714}^{2}\unicode[STIX]{x0394}x^{2}\unicode[STIX]{x1D70E}_{v}^{2}}{2V^{4}}\right)\exp \left(\frac{\unicode[STIX]{x0394}y^{2}}{L_{y}^{2}}\right).\end{eqnarray}$$
So far, we have shown only the correlation behaviour between two points
 $(0,0)$
and
 $(\unicode[STIX]{x0394}x,\unicode[STIX]{x0394}y)$
that have statistically identical spectra, with all the turbulence kinetic energy at the downwind point having simply advected downwind. However, this does not describe the two points immediately upwind of two wind turbines, since the wake from the upwind unit adds turbulence scales to the downwind counterpart and, therefore, statistically different turbulent characteristics. Nevertheless, we proceed with this assumption as a limiting estimate in the case where wake motions are dominated by atmospheric boundary layer (ABL) motions, and test this estimate when far from the limiting behaviour. Then, a closed-form expression for the coherence can be taken as
 $$\begin{eqnarray}C_{i,j}(\unicode[STIX]{x1D714})=\exp \left(-\frac{\text{i}\unicode[STIX]{x1D714}\unicode[STIX]{x0394}x}{V}\right)\times \exp \left(-\frac{\unicode[STIX]{x1D714}^{2}\unicode[STIX]{x0394}x^{2}\unicode[STIX]{x1D70E}_{v}^{2}}{2V^{4}}\right)\exp \left(\frac{\unicode[STIX]{x0394}y^{2}}{L_{y}^{2}}\right).\end{eqnarray}$$
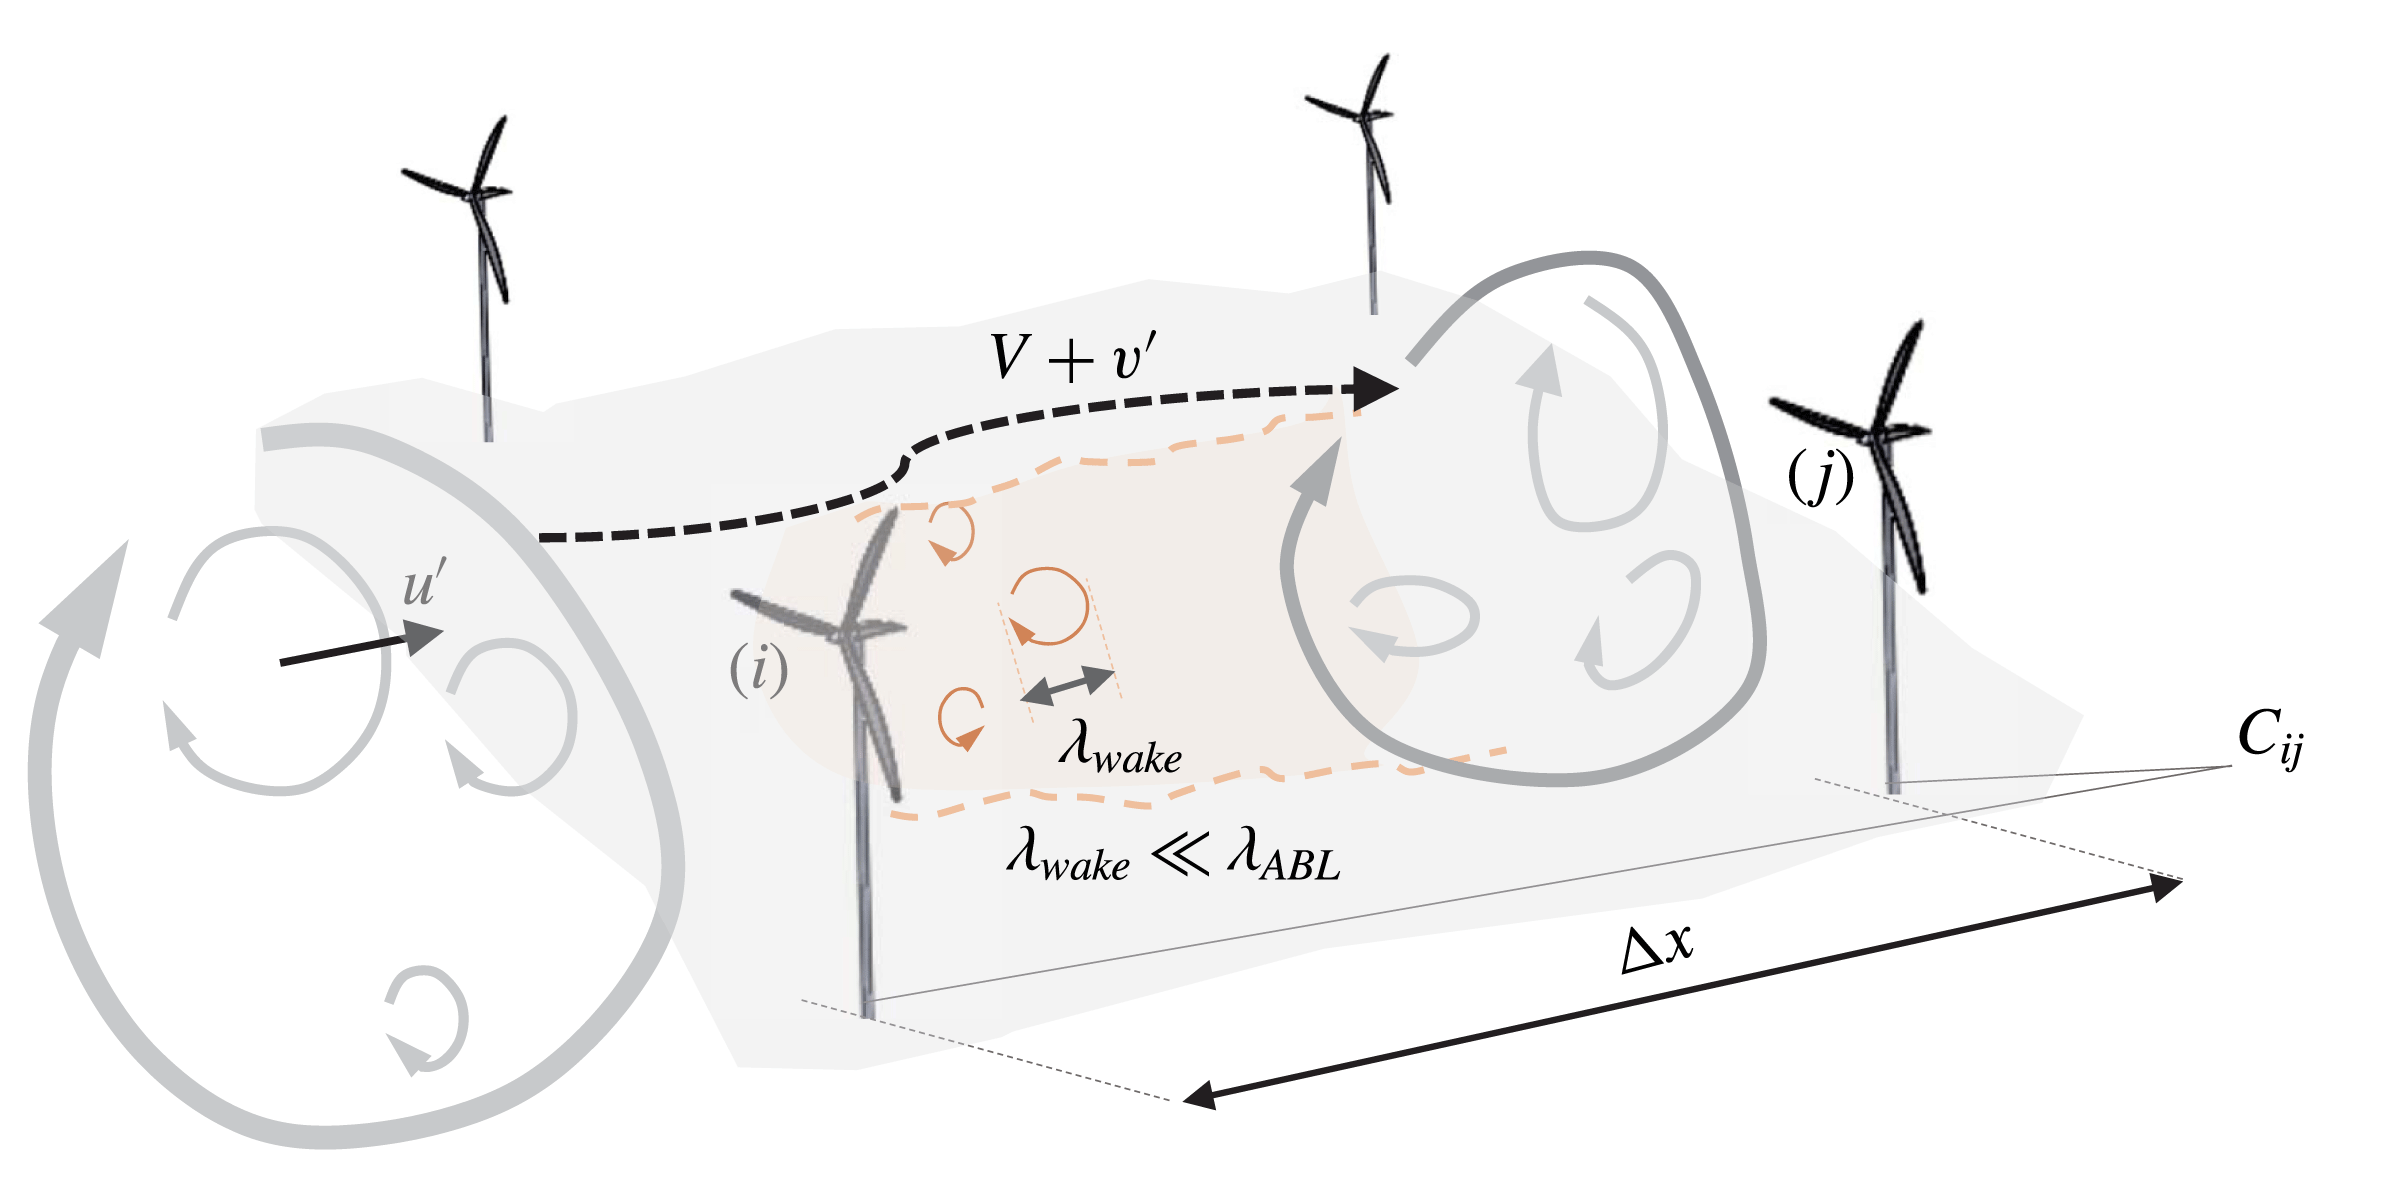
The interpretation of this result is that large-scale atmospheric motions impart their signature on an upwind turbine, are distorted as they are advected downstream, and impart a similar signature on a downwind turbine, with higher frequency scales being the more distorted. This high-frequency distortion is consistent with the findings of Vigueras-Rodríguez et al. (Reference Vigueras-Rodríguez, Sørensen, Cutululis, Viedma and Donovan2010), who observed velocity correlations to be the highest for low frequencies within a wind farm. This is conceptually shown in figure 1. The proposed model is similar in construction to existing empirical formulations used throughout the literature broadly stemming from the Panofsky & Dutton (Reference Panofsky and Dutton1984) model of longitudinal velocity coherence,
 $$\begin{eqnarray}C_{PD}=\exp \left(-\frac{As\unicode[STIX]{x1D714}}{V}\right),\end{eqnarray}$$
where
 $s$
is the separation between two points and
 $A$
is an empirical constant, which changes depending on whether the separation is lateral or longitudinal, as well as the local turbulence characteristics. Interestingly, Panofsky & Dutton (Reference Panofsky and Dutton1984) suggested
 $A\approx \unicode[STIX]{x1D70E}_{v}/V$
for streamwise separations based only on heuristic arguments, showing a close relation to the present formulation. However, that coherence spectrum differs from that proposed here, with
 $\unicode[STIX]{x1D6F7}_{i,j}$
in (2.5) being replaced by
 $|\unicode[STIX]{x1D6F7}_{i,j}|$
, eliminating phase information. To avoid confusion, we refer to this alternative definition as the absolute coherence. The Panofsky–Dutton model is based on an observation by Davenport (Reference Davenport1961) that the absolute coherence is well approximated by a simple exponential decay with a fitted decay rate; it was used by Jimenez et al. (Reference Jimenez, Crespo, Migoya and García2008) to model the absolute coherence of two points with small separation in a boundary layer, both with and without turbine wakes. They found the coherence from both a set of experiments and large-eddy simulations to be well estimated, though these results were only for the velocity components, and not power from turbine pairs. Sørensen et al. (Reference Sørensen, Cutululis, Vigueras-Rodríguez, Madsen, Pinson, Jensen, Hjerrild and Donovan2008), however, modelled the power coherence between turbine pairs in the Nysted and Horns Rev wind farms in Denmark, using the modified Panofsky–Dutton coherence model of Schlez & Infield (Reference Schlez and Infield1998), and showed good agreement with their experimental data.
Conceptual schematic illustrating the factors impacting turbine–turbine coherence. Atmospheric motions of length scale
 $\unicode[STIX]{x1D706}_{ABL}$
are advected and partially distorted by large-scale sweeping. Wake motions of length scale
 $\unicode[STIX]{x1D706}_{wake}\ll \unicode[STIX]{x1D706}_{ABL}$
are introduced by turbines, and do not contribute to coherence.
3 Experiments
A set of experiments was performed with model wind-turbine arrays operated in the wind tunnel of the Renewable Energy and Turbulent Environment Group (RE-TE-G) at the University of Illinois to test the coherence predictions of the RSH. The wind tunnel has a test section 6 m long, 0.46 m high and 0.9 m wide. Details of the facility can be found in Adrian, Meinhart & Tomkins (Reference Adrian, Meinhart and Tomkins2000). To assess the impact of both turbulence intensity
 $I_{u}=\unicode[STIX]{x1D70E}_{u}/U_{0}$
(where
 $\unicode[STIX]{x1D70E}_{u}$
and
 $U_{0}$
are the standard deviation and mean of the incoming velocity at hub height), and integral time scales
 $T_{u}=\int _{0}^{\infty }\langle u^{\prime }(t)u^{\prime }(t+\unicode[STIX]{x1D70F})\rangle \,\text{d}\unicode[STIX]{x1D70F}$
, power fluctuations of wind turbines within various wind-farm layouts were acquired for a range of turbulence characteristics.
Four flow regimes were examined; two consisted of uniform incoming flows with very low (
 $I_{u}=0.3\,\%$
) and high (
 $I_{u}=3.0\,\%$
) turbulence levels. The other two cases consisted of turbulent boundary layers. One was developed over a nearly smooth wall with a roughness height
 $z_{0}$
of 0.019 mm, and
 $I_{u}=8.0\,\%$
at hub height; the other developed over a rough wall with
 $z_{0}=0.52~\text{mm}$
, and
 $I_{u}=10\,\%$
at hub height. For all cases, except the laminar free-stream flow, an active turbulence generator was placed at the inlet to lead to the formation of large-scale turbulent motions; see Tobin, Hamed & Chamorro (Reference Tobin, Hamed and Chamorro2017) for details.
The model turbines had a rotor diameter
 $d_{T}=0.12~\text{m}$
, and were based on a model hydrokinetic turbine from Sandia National Labs (Shiu et al.
Reference Shiu, van Dam, Johnson, Barone, Phillips, Straka, Fontaine and Jonson2012; Johnson et al.
Reference Johnson, Fontaine, Jonson, Meyer, Straka, Young, van Dam, Shiu and Barone2013). The rotors were attached to a Precision Microdrives 112-001 Micro Core 12 mm motor which acted as the loading system and a method to measure the power output, where rated power resulted
 $P_{0}\approx 1~\text{W}$
. The tip-speed ratio
 $\unicode[STIX]{x1D706}$
was kept constant at
 $\unicode[STIX]{x1D706}=5.0$
by adjusting the resistance across the generator. The power output was sampled at a rate of 100 kHz for a duration of 480 s. Power was calculated from the applied resistance, and the voltage across the terminals of the generators as measured with a data acquisition system individually for each turbine. The turbines were identical to those used in Tobin et al. (Reference Tobin, Hamed and Chamorro2017), and have power and thrust coefficients of 0.45 and 0.79, respectively. The power coefficient was inferred from the mean measured power, making adjustments based on the efficiency curve of the generator. The thrust coefficient is based on wake deficit measurements.
The experiments were conducted with an incoming hub-height velocity of
 $U_{0}=9.0~\text{m}~\text{s}^{-1}$
, which varied by
 $\pm$
5 % between flow cases; this resulted in a Reynolds number
 $Re=U_{0}d_{T}/\unicode[STIX]{x1D708}\approx 7.2\times 10^{4}$
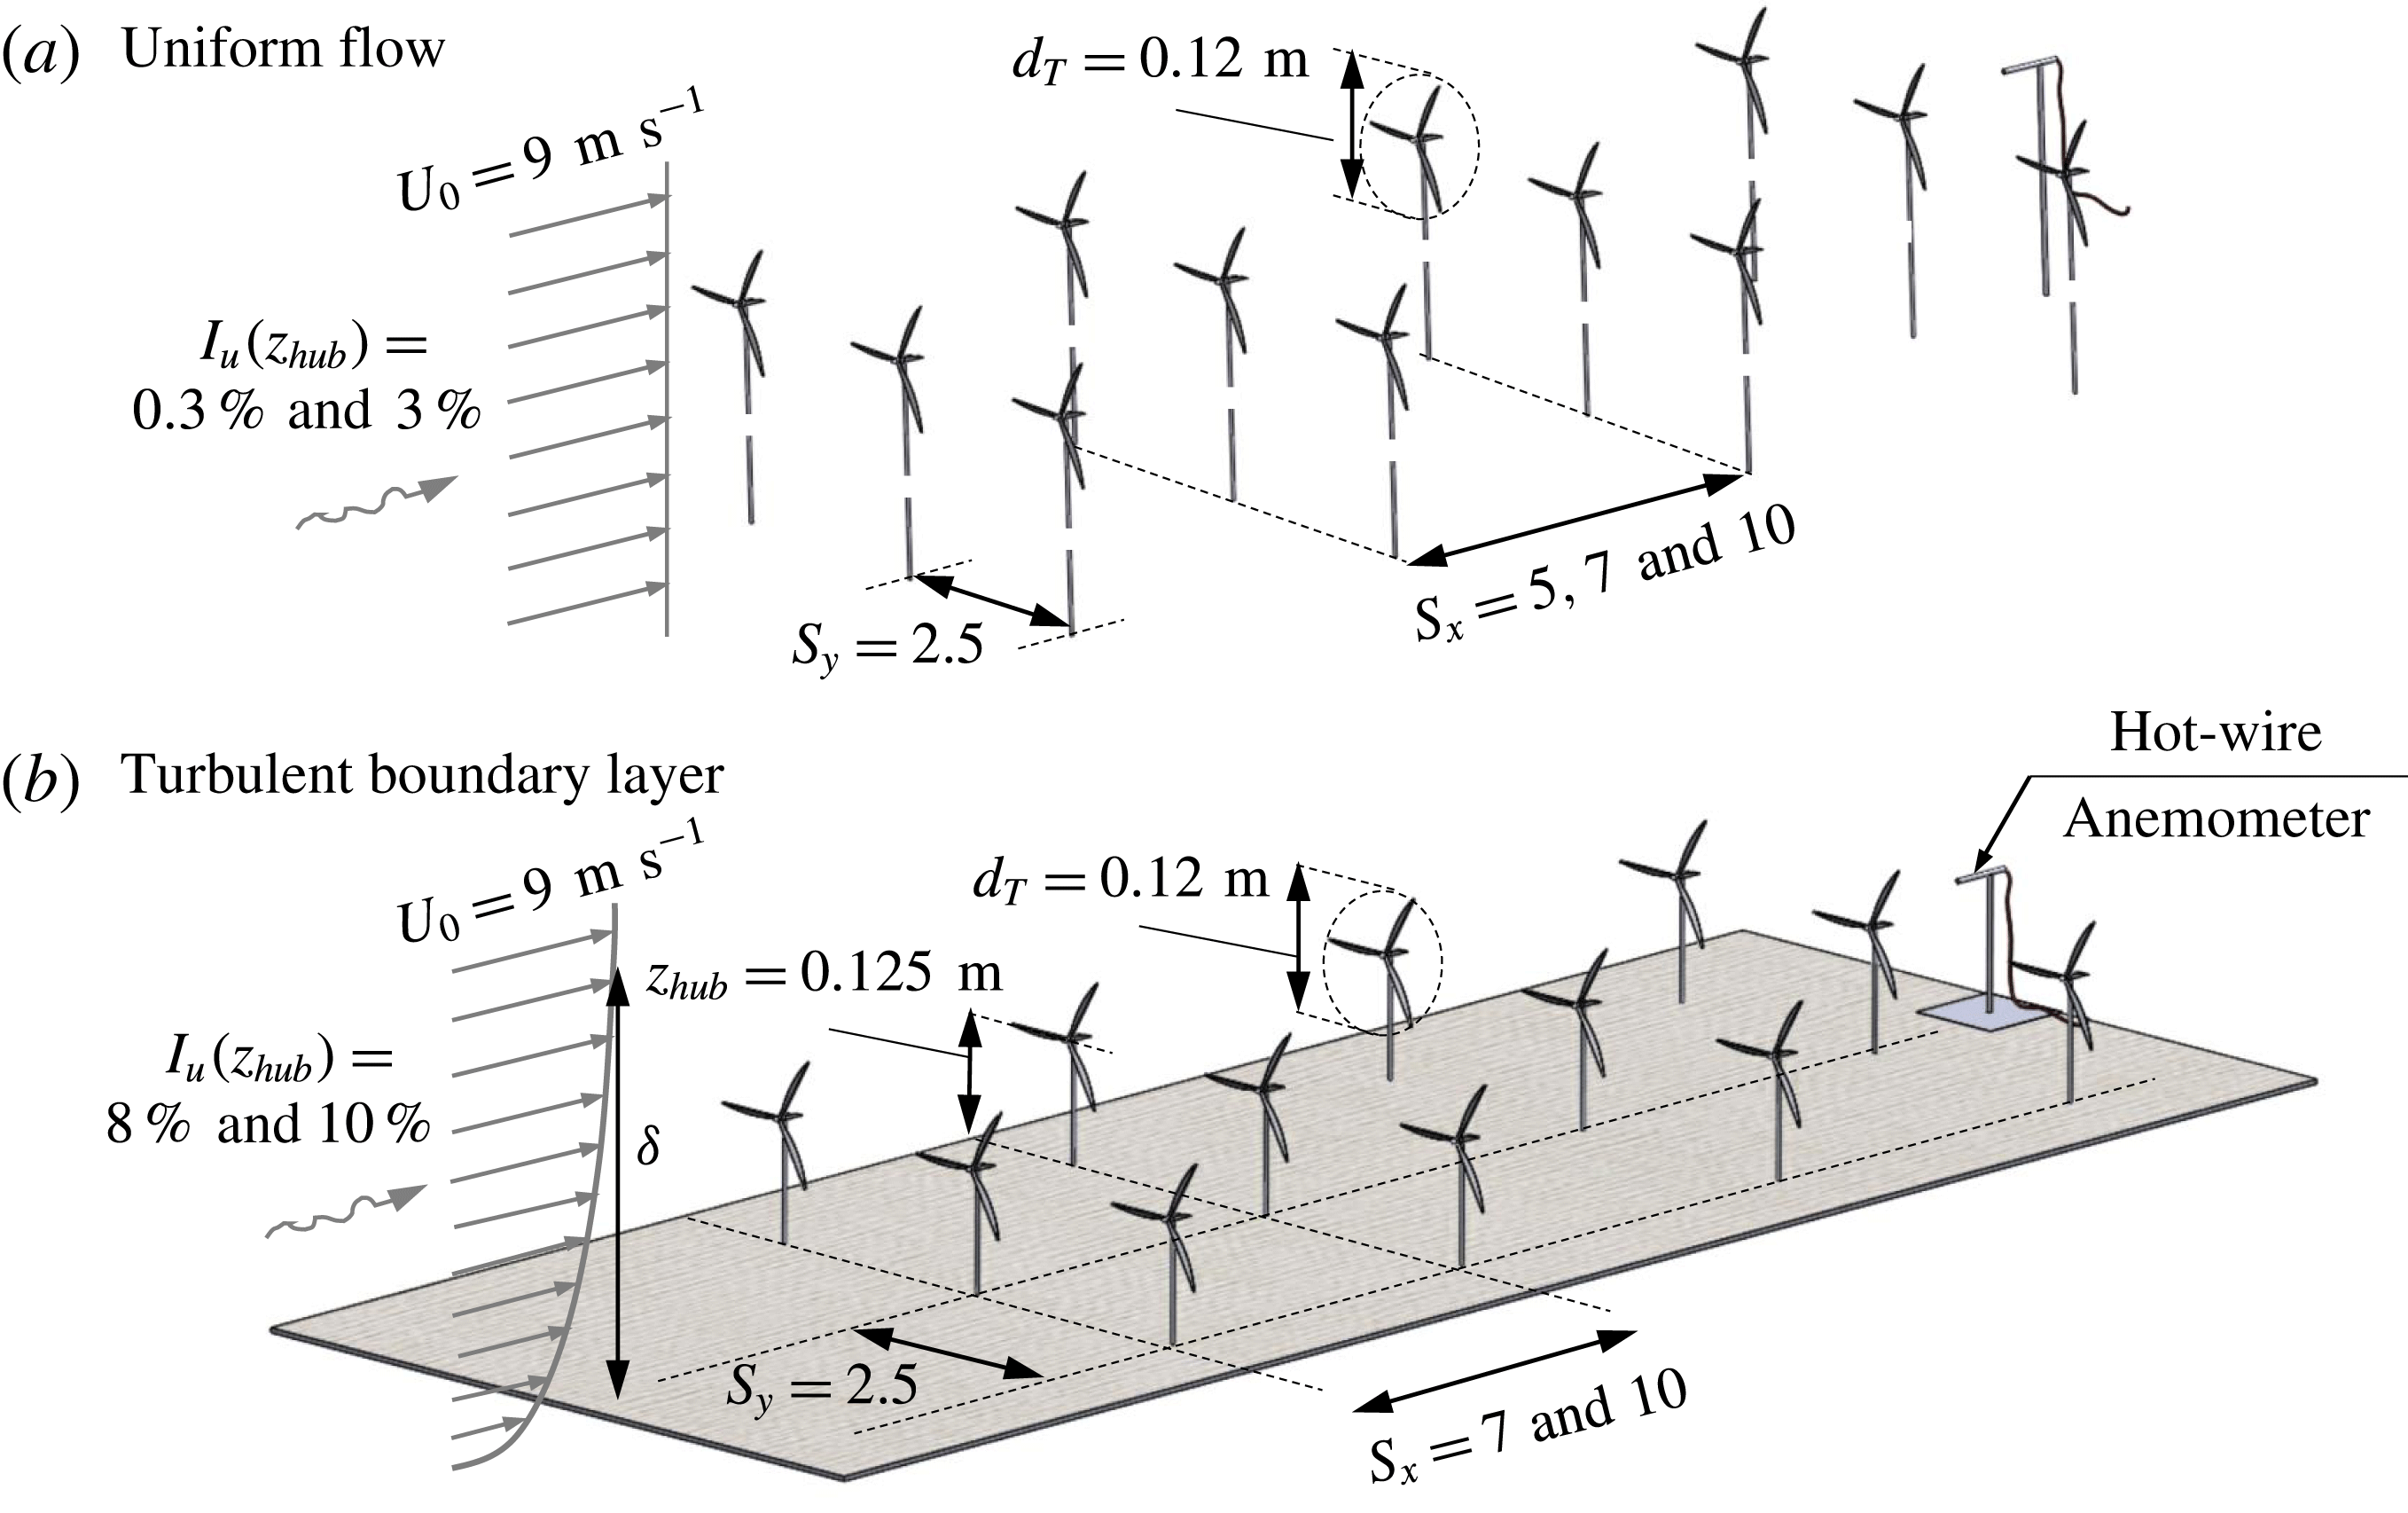
. Flow was also measured in the upwind vicinity of each turbine that had power measurements taken to characterize the local incoming flow. Velocity measurements were done via hot-wire, and were sampled at a rate of 10 kHz for a duration of 60 s. For all flow cases, three streamwise columns of turbines were used, spaced
 $S_{y}=2.5$
rotor diameters apart, and the power was sampled only from the central column. The uniform flow cases used three rows of turbines, with streamwise spacings of
 $S_{x}=5$
, 7 and 10 rotor diameters. The boundary-layer cases used four rows of turbines, with streamwise spacings of
 $S_{x}=7$
and 10 rotor diameters and hub height
 $z_{h}=0.125~\text{m}$
. Conceptual schematics are shown for the uniform flow in figure 2(a), and for the boundary-layer flow in figure 2(b). In all experiments, the last row was laterally displaced from the preceding rows, with a displacement of 0, 0.5, or 1.0 rotor diameters to investigate the effect of lateral displacement.
4 Evaluation of the model
Each set of data was split into ten equally sized non-overlapping windows. The estimated coherence
 $\tilde{C}$
of each turbine pair was found by averaging the coherence of each subset of data. This was used to verify the fidelity of the RSH predictions on the two characteristic frequencies related to advection (
 $\unicode[STIX]{x1D714}_{a}$
) and turbulent decoherence (
 $\unicode[STIX]{x1D714}_{c}$
). However, the prediction from the RSH that coherence reaches unity at zero frequency was not supported by the data, and the magnitude of the coherence was lower than predicted. We model this reduced magnitude with a multiplicative constant
 $a$
, and calculate
 $a$
for each turbine pair via least-squares fit as:
 $$\begin{eqnarray}a=\underset{a}{\text{argmin}}\mathop{\sum }_{j=1}^{n}\left|\tilde{C}_{j}-a\exp \left(\frac{-\text{i}\unicode[STIX]{x1D714}_{j}\unicode[STIX]{x0394}x}{U_{0}}\right)\exp \left(-\frac{\unicode[STIX]{x1D714}_{j}^{2}\unicode[STIX]{x0394}x^{2}\unicode[STIX]{x1D70E}_{u}^{2}}{2U_{0}^{4}}\right)\right|^{2},\end{eqnarray}$$
where
 $n$
is the number of frequencies at which the coherence is calculated. Some coherence measurements were unreliable, as not enough data were taken to estimate a clear spectrum. This was particularly common for turbine pairs separated by more than 2 rows, or when the flow approaching the first turbine in a pair had low turbulence. As such, data are reported only when the modelled power spectrum fits the data with
 $R^{2}>0.2$
.
Basic schematics of the experimental set-ups; wind farms in (a) uniform flow, and (b) turbulent boundary layer.
The advection frequency was measured from the data based on the angle of the coherence spectrum
 $\unicode[STIX]{x1D703}=\angle \tilde{C}$
. The RSH predicts that this quantity changes with frequency as follows:
 $$\begin{eqnarray}\frac{\text{d}\unicode[STIX]{x1D703}}{\text{d}\unicode[STIX]{x1D714}}=-\frac{\unicode[STIX]{x0394}x}{U_{0}}=-\frac{2\unicode[STIX]{x03C0}}{\unicode[STIX]{x1D714}_{a}}.\end{eqnarray}$$
Then, for each turbine–turbine pair,
 $\unicode[STIX]{x1D703}$
was modelled as:
 $$\begin{eqnarray}\unicode[STIX]{x1D703}=-\left(\frac{2\unicode[STIX]{x03C0}\unicode[STIX]{x1D714}}{\unicode[STIX]{x1D714}_{a}}\hspace{0.6em}{\rm mod}\hspace{0.2em}2\unicode[STIX]{x03C0}\right)+\unicode[STIX]{x03C0};\end{eqnarray}$$
the
 $\unicode[STIX]{x1D714}_{a}$
values which minimize the squared error with the experimental values of
 $\angle \tilde{C}$
are reported as
 $\tilde{\unicode[STIX]{x1D714}}_{a}$
, where
 $\tilde{\circ }$
denotes a value fitted from the data. Examples of the modelled and measured coherence angle are shown in figure 3. Finally, the measured decoherence frequency
 $\tilde{\unicode[STIX]{x1D714}}_{c}$
is reported as the result of a final least-squares fit of the coherence spectrum.
Modelled and measured coherence phase angle
 $\angle \tilde{C}$
.

Two phenomena may contribute to the parameter
 $a$
in (4.1). The first is lateral displacement, in which case
 $a=\exp (\unicode[STIX]{x0394}y^{2}/L_{y}^{2})$
. However, there may also be a contribution from the perturbed incoming flow by the turbine wake, such that
 $a\neq 1$
when
 $\unicode[STIX]{x0394}y=0$
. Because turbines act approximately as probes of the turbulence, power coherence can be taken as roughly equal to the coherence of two points immediately upwind of each turbine in the pair. Without either turbine present, the coherence of these two points should be closely approximated by the RSH (Wilczek et al.
Reference Wilczek, Stevens and Meneveau2015). However, the correlation between these two points is affected by wake motions induced by the upwind turbine in the pair, which we model with the multiplicative constant
 $a$
.
The least-squares estimates of the characteristic frequencies
 $\unicode[STIX]{x1D714}_{a}$
and
 $\unicode[STIX]{x1D714}_{c}$
are compared to their theoretical counterparts as predicted earlier. Namely, we should expect that
 $$\begin{eqnarray}\unicode[STIX]{x1D714}_{a}=\frac{2\unicode[STIX]{x03C0}U_{0}}{\unicode[STIX]{x0394}x},\end{eqnarray}$$
and
 $$\begin{eqnarray}\unicode[STIX]{x1D714}_{c}=\frac{U_{0}^{2}}{\unicode[STIX]{x0394}x\unicode[STIX]{x1D70E}_{v}}.\end{eqnarray}$$
The particular exponential behaviour of the power spectrum is quite consistent with the data; an example is illustrated in figure 4. The least-squares estimates for
 $\unicode[STIX]{x1D714}_{a}$
and
 $\unicode[STIX]{x1D714}_{c}$
closely fit the predictions, with
 $R^{2}=0.85$
and 0.87, respectively, suggesting a strong predictive ability for these two quantities. Measured values of the two characteristic frequencies are compared with their predictions in figures 5 and 6.
Sample coherence data from the rough-wall boundary layer experiment considering a wind farm with
 $S_{x}=10$
.

Comparison of the measured and theoretical characteristic advection frequency (
 $\unicode[STIX]{x1D714}_{a}$
) for various flow conditions.

Comparison of the measured and theoretical characteristic frequency of the turbulence decoherence (
 $\unicode[STIX]{x1D714}_{c}$
) for various flow conditions.

The data suggest that the zero-frequency coherence magnitude
 $a$
is dependent primarily on the turbulence intensity
 $I_{u}$
of the flow approaching the most upwind turbine in a pair. A wide range of
 $I_{u}$
is achieved by considering the flow approaching each individual upwind turbine, which may be impacted by the presence of upwind wakes. This is evident with a linear regression between
 $a$
and
 $I_{u}$
, such that
 $a=\unicode[STIX]{x1D6FC}_{0}+\unicode[STIX]{x1D6FC}_{1}I_{u}$
. The characteristic constant
 $\unicode[STIX]{x1D6FC}_{1}$
is found to have a 95 % confidence bound between 1.29 and 2.47, clearly suggesting that higher approaching
 $I_{u}$
leads to higher coherence. A similar regression test between
 $a$
and the integral time scale
 $T_{u}$
shows that no statistically significant trend exists between them. This is an interesting result, since an assumption of the RSH is a wide separation of scales between the sweeping velocity and the process of interest. It would therefore be useful to assess the impact of atmospheric stability on power coherence, since lower
 $I_{u}$
is generally associated with the clear-night stable boundary layer; furthermore, interaction between turbine wakes and the boundary layer is modulated by atmospheric stability. For instance, Abkar & Porté-Agel (Reference Abkar and Porté-Agel2015) found major differences in wake growth characteristics between different atmospheric stability states, and both Lu & Porté-Agel (Reference Lu and Porté-Agel2011) and Cortina, Calaf & Cal (Reference Cortina, Calaf and Cal2016) found significant impacts on vertical and horizontal mixing of momentum for different stability regimes.
We argue that the deviation of the turbulence coherence trend from the RSH is a result of the induced motions from turbine wakes, which are significantly weakly correlated with the incoming turbulence (Espana et al. Reference Espana, Aubrun, Loyer and Devinant2012). Since wake-added motions are comparatively small (Chamorro et al. Reference Chamorro, Guala, Arndt and Sotiropoulos2012; Tian, Ozbay & Hu Reference Tian, Ozbay and Hu2018), they may evolve sufficiently between rows of turbines to contribute to power fluctuations in the downwind turbine that are not correlated with the upwind counterpart. This is consistent with the findings of Tian, Ozbay & Hu (Reference Tian, Ozbay and Hu2014), who noted faster dissipation and earlier breakdown of the wake vortices under high turbulence inflow, as well as the findings of Lignarolo et al. (Reference Lignarolo, Ragni, Scarano, Ferreira and van Bussel2015), who argue that wake motions are dominated by tip-vortex breakdown. We proceed to test this hypothesis, at least in its limiting behaviour, as follows.
Consider wake-added velocity fluctuations
 $u_{w}^{\prime }$
added to the upwind velocity fluctuations
 $u_{u}^{\prime }$
, which determines the total velocity fluctuations approaching the downwind turbine in a pair
 $u_{tot}^{\prime }$
, as follows:
 $$\begin{eqnarray}u_{tot}^{\prime }=L_{\unicode[STIX]{x1D6FF}t}u_{u}^{\prime }+u_{w}^{\prime },\end{eqnarray}$$
where
 $L_{\unicode[STIX]{x1D6FF}t}$
is the lag operator with lag time
 $\unicode[STIX]{x1D6FF}t$
, so that upwind velocity fluctuations are advected without evolving. With the previous assumption that the coherence of the turbine power is the same as the coherence of the velocity fluctuations immediately upwind of each turbine, the absolute coherence takes the form
 $$\begin{eqnarray}|C|=\frac{|\widehat{u}_{u}(\widehat{L_{\unicode[STIX]{x1D6FF}t}u}_{u}+\widehat{u}_{w})^{\ast }|}{(\widehat{u}_{u}\widehat{u}_{u}^{\ast }\widehat{u}_{tot}\widehat{u}_{tot}^{\ast })^{1/2}},\end{eqnarray}$$
where
 $(\,)^{\ast }$
denotes the complex conjugate. In the limiting case where
 $u_{w}^{\prime }$
is uncorrelated with
 $u_{u}^{\prime }$
, the numerator of (4.7) is the power spectrum of the upwind point. This estimate for
 $|C|$
is then an upper bound in the case where wake motions are uncorrelated with the turbine from which they are shed, and reduces to
 $|C|=\sqrt{\unicode[STIX]{x1D6F7}_{u}/\unicode[STIX]{x1D6F7}_{tot}}$
. A coherence estimate greater than this upper bound would lead us to reject the hypothesis that a turbine’s power output is uncorrelated with its wake-added turbulence. No turbine–turbine pair was found to have a coherence value higher than this bound with statistical significance for frequencies below
 $2\unicode[STIX]{x03C0}U/d_{T}$
. A more thorough investigation of this hypothesis should include simultaneous measurements of power as well as upstream and downstream velocity fluctuations.
In general, smaller values of
 $a$
are found for turbine pairs spanning more than two rows. Representative examples of coherence spectra for turbines separated by one, two, and three rows for the case with
 $S_{x}=7$
and
 $S_{y}=0$
in the nearly smooth-wall boundary layer are shown in figure 7; there, coherence clearly decreased with increased number of rows separating the turbines in a pair. The general trend towards lower
 $a$
with greater numbers of rows separating the turbines is evident in all four flow cases, as illustrated in figure 8(a). This figure shows the average
 $a$
measured for all turbine–turbine pairs in a given flow case with a given number of rows separating them and, therefore, shows bulk behaviour. This trend is consistent with the interpretation that wake-added motions detract from turbine–turbine coherence, since a greater fraction of the turbulence impacting turbines deep within a wind farm is from wake-added motions. Figure 8(a) additionally suggests a clear trend toward higher coherence values with greater ambient turbulence intensity.
Example of coherence spectra in the case of the smooth-wall boundary layer, with streamwise separation
 $S_{x}=7$
and
 $S_{y}=0$
.

Trends of average coherence magnitude for each flow case with (a) number of rows separating turbines, and (b) inter-turbine spacing.

Larger inter-turbine spacing also led to lower coherence, with a trend towards lower
 $a$
with greater spacing, as shown in figure 8(b). The interpretation of this result in the argument that wake-added motions detract from coherence is unclear. If atmospheric motions are expected to dominate turbine–turbine correlations, it might be expected that coherence would increase with greater inter-turbine spacing as wakes would be given more distance to dissipate. Conversely, greater inter-turbine spacing would provide more time for wake motions to nonlinearly interact with and distort atmospheric motions.
The effect of lateral displacement is not conclusive from the data; no significant trend is found to occur in the cases considered. However, this may be expected, since lateral separation leads to two competing results. The first is that correlation is simply reduced as a result of greater separation distance, and a reduction similar to the separable behaviour posited in (2.13) is expected. In addition, lateral separation implies that the downwind turbine in a pair is exposed to fewer uncorrelated wake motions, and coherence might be expected to increase. A clearer trend might therefore be observed when considering lateral separations larger than one rotor diameter.
The data also allow testing the modelling assumption that
 $v_{1}^{\prime }$
is comparatively small and Gaussian. The model coherence from (2.9) is evaluated by averaging
 $\exp (-\text{i}\unicode[STIX]{x1D714}\unicode[STIX]{x0394}x/(V+v^{\prime }))$
for a range of frequencies using the time-series velocity data from the last row of the
 $S_{x}=7$
wind farm in the rough-wall scenario, as shown in figure 9. This particular velocity time series was chosen because it had the largest turbulence intensity,
 $I_{u}=$
13.3 %, which stresses the assumption of small
 $v^{\prime }$
the greatest. The application of the Kolmogorov–Smirnov test indicates that the velocity approaching this turbine is non-Gaussian. Nonetheless, the difference between the empirical coherence model and the Gaussian model is minor, even in the limiting case.
Model coherence spectrum given velocity time series approaching the last row of turbines in the case of rough-wall boundary layer, with streamwise separation
 $S_{x}=7$
. The difference between the Gaussian estimate and the empirical model is negligible.

5 Conclusion
The RSH does well in predicting the general behaviour of the coherence of wind-turbine pairs. The complex exponential structure predicted is observed in the experimental data, with strong agreement with the characteristic frequency scales predicted by the RSH. However, the turbine wakes appear to diminish the magnitude of the coherence by a multiplicative constant
 $a\in (0,1)$
, which depends strongly on the structure of the flow approaching the first turbine in a pair. Namely, for flows with high-energy, large motions have the largest values of
 $a$
. The data suggest that this may be explained by the assumption that turbine-added wake motions are uncorrelated with the turbine from which they are shed. Though similarities exist between the Panofsky–Dutton model and the current model, the final expressions differ, as well as the method employed in arriving to them, with the current model being less empirical. Furthermore, the current experimental results suggest that the magnitude of the coherence predicted either with the Panofsky–Dutton model or the RSH is too high, so that aggregate wind-farm power fluctuations may be improperly estimated without modification to the coherence models to account for wake-added motions, either of the type proposed or similar.
It is still not clear how the turbulence induced in the turbine wake impacts the coherence. A physical framework which accounts for the described observations is therefore desirable. It should also be noted that similar results in arrays of vertical-axis wind turbines may prove distinctly different, due to the differing momentum flux and wake growth characteristics in these types of wind farms (Kinzel, Araya & Dabiri Reference Kinzel, Araya and Dabiri2015; Abkar & Dabiri Reference Abkar and Dabiri2017).
Acknowledgements
This work was supported by Mech. Sci. and Eng. Dept, U. of Illinois, as part of the startup package of L.P.C. This material is based upon work supported by the National Science Foundation under grant no. ECCS-041544081. This material is based upon work supported by the National Science Foundation Graduate Research Fellowship Program under grant no. DGE-1144245.



