


When performing a verbal fluency task, the participant is asked to generate as many words as possible during a specific time limit, usually 1 min, that start with a given letter or that belong to a specific category. In letter fluency (or phonemic fluency; Newcombe, Reference Newcombe1969) the given letters are usually F, A, and S (Harrison, Buxton, Husain, & Wise, Reference Harrison, Buxton, Husain and Wise2000; Tallberg, Ivachova, Tinghag, & Östberg, Reference Tallberg, Ivachova, Tinghag and Östberg2008). In the category fluency tasks, the participant is asked to generate nouns, such as animals or food (i.e., semantic fluency; Benton, Reference Benton1968), or action verbs, namely, things that one can do (i.e., action fluency; Piatt, Fields, Paolo, & Tröster, Reference Piatt, Fields, Paolo and Tröster1999). While generating words during the verbal fluency tasks, participants tend to create clusters, or subcategories. Clustering is the ability to produce semantically or phonologically similar words in connection to each other, suggested to involve lexical access. This is then followed by switching to new clusters, which is thought to involve the executive functions strategic search and cognitive flexibility (Troyer, Moscovitch, & Winocur, Reference Troyer, Moscovitch and Winocur1997).
Knowledge of verbal fluency ability is derived from research on clinical and nonclinical groups of children and adults. Studies include groups with neuropsychiatric diagnoses (Andreou & Trott, Reference Andreou and Trott2013; Cohen, Morgan, Vaughn, Riccio, & Hall, Reference Cohen, Morgan, Vaughn, Riccio and Hall1999; Korhonen, Reference Korhonen1995), psychiatric disorders (Crawford, Obonsawin, & Bremner, Reference Crawford, Obonsawin and Bremner1993), as well as neurodegenerative diseases and brain lesions (Azambuja, Haddad, Radanovic, Barbosa, & Mansur, Reference Azambuja, Haddad, Radanovic, Barbosa and Mansur2007; Iudicello, Woods, Parsons, & Moran, Reference Iudicello, Woods, Parsons and Moran2007; McDowd et al., Reference McDowd, Hoffman, Rozek, Lyons, Pahwa, Burns and Kemper2011; Rosser & Hodges, Reference Rosser and Hodges1994; Signorini & Volpato, Reference Signorini and Volpato2006; Woods et al., Reference Woods, Morgan, Dawson, Cobb and Grant2006). Research on nonclinical groups show that verbal fluency is associated with factors such as age and level of education. Studies on healthy adults show that age has an effect on semantic fluency (Harrison et al., Reference Harrison, Buxton, Husain and Wise2000; Moraes et al., Reference Moraes, Guimarães, Joanette, Parente, Fonseca and Almeida2013), but not action or letter fluency. However, level of education seems to play a significant role for performance on all three verbal fluency tasks, in particular action and letter fluency (Piatt, Fields, Paolo, & Tröster, Reference Piatt, Fields, Paolo and Tröster2004; Tallberg et al., Reference Tallberg, Ivachova, Tinghag and Östberg2008). Further, education was shown to have the greatest effect on verbal fluency when taking age, semantic judgement, reading, and writing into account (Moraes et al., Reference Moraes, Guimarães, Joanette, Parente, Fonseca and Almeida2013).
Verbal fluency tasks are commonly used in both research and clinical assessments of executive functions (Fisk & Sharp, Reference Fisk and Sharp2004; McDowd et al., Reference McDowd, Hoffman, Rozek, Lyons, Pahwa, Burns and Kemper2011; Shao, Janse, Visser, & Meyer, Reference Shao, Janse, Visser and Meyer2014) and verbal abilities (Lezak, Howieson, Bigler, & Tranel, Reference Lezak, Howieson, Bigler and Tranel2012; Spreen & Strauss, Reference Spreen and Strauss1998). Verbal fluency has been reported to involve several executive functions such as speed of processing, inhibiting irrelevant responses (McDowd et al., Reference McDowd, Hoffman, Rozek, Lyons, Pahwa, Burns and Kemper2011), storing and updating information in working memory (Baldo, Scwartz, Wilkins, & Dronkers, 2006; Henry & Crawford, Reference Henry and Crawford2004; Shao et al., Reference Shao, Janse, Visser and Meyer2014), and effortful self-initiation (Henry & Crawford, Reference Henry and Crawford2004). As for verbal abilities, the size and organization of the expressive vocabulary (e.g., naming pictures) is suggested to be associated with verbal fluency (Ardila, Ostrosky-Solis, & Bernal, 2006), as participants with larger vocabularies produce more words than participants with limited vocabularies (Sauzéon et al., Reference Sauzéon, Raboutet, Rodrigues, Langevin, Schelstraete, Feyereisen and N’Kauoa2011). However, this result does not recur in all studies (e.g., McDowd et al., Reference McDowd, Hoffman, Rozek, Lyons, Pahwa, Burns and Kemper2011; Shao et al., Reference Shao, Janse, Visser and Meyer2014). Shao et al. (Reference Shao, Janse, Visser and Meyer2014) proposed that the size of the expressive vocabulary is relevant for how fast the participants can retrieve the first word, rather than the number of correctly retrieved words, in semantic and letter fluency.
Neuroimaging studies have supported the findings obtained by research examining the cognitive processes involved in verbal fluency. The neurocognitive underpinnings of letter fluency, semantic fluency, and action fluency are largely overlapping, including activation in temporal and frontolateral areas (Ardila et al., Reference Ardila, Ostrosky-Solís and Bernal2006; Audenaert et al., Reference Audenaert, Brans, Laere, Lahorte, Versijpt, Heeringen and Dierckx2000; Baldo et al., Reference Baldo, Schwartz, Wilkins and Dronkers2006; Baldo & Shimamura, Reference Baldo and Shimamura1998). These areas are suggested to underlie executive functions such as working memory and cognitive flexibility, and verbal abilities such as phonological processing and lexical access (Baldo et al., Reference Baldo, Schwartz, Wilkins and Dronkers2006; Mummery, Patterson, Hodges, & Wise, Reference Mummery, Patterson, Hodges and Wise1996; Troyer et al., Reference Troyer, Moscovitch and Winocur1997). The cortical activation has been suggested to occur lateralized to the left hemisphere (Gaillard et al., Reference Gaillard, Sachs, Whitnah, Ahmad, Balsamo, Petrella and Grandin2003; Sanjuán et al., Reference Sanjuán, Bustamante, Forn, Ventura-Campos, Barrós-Loscertales, Martínez and Avila2010), and this lateralization has been shown to increase with age (Holland et al., Reference Holland, Plante, Weber Byars, Strawsurg, Schmithhorst and Ball2001).
However, each of the three fluency tasks also appear to tap unique neurocognitive mechanisms. Given the differing neuropathology of neurodegenerative diseases and stroke lesions, verbal fluency performance in these groups can assist in indicating which cortical structures underpin each task. Studies on individuals with impairments in left temporal areas (e.g., Alzheimer disease) and frontal areas, as well as healthy adults, indicate that letter fluency relies relatively more on left frontal areas, and semantic fluency on left temporal areas (Baldo et al., Reference Baldo, Schwartz, Wilkins and Dronkers2006; Henry, Crawford, & Phillips, Reference Henry, Crawford and Phillips2004; Mummery et al., Reference Mummery, Patterson, Hodges and Wise1996; Rosser & Hodges, Reference Rosser and Hodges1994). Action fluency appears to be relatively more impaired in clinical populations with frontostriatal pathology, including populations with Parkinson disease (Piatt, Fields, Paolo, & Tröster, Reference Piatt, Fields, Paolo and Tröster1999; Rodrigues, Ferreira, Coelho, Rosa, & Castro-Caldas, Reference Rodrigues, Ferreira, Coelho, Rosa and Castro-Caldas2015; Signorini & Volpato, Reference Signorini and Volpato2006), HIV-1 (Iudicello et al., Reference Iudicello, Woods, Parsons and Moran2007; Woods et al., Reference Woods, Morgan, Dawson, Cobb and Grant2006), and dementia with Lewy bodies (Delbeuck, Debachy, Pasquier, & Moroni, Reference Delbeuck, Debachy, Pasquier and Moroni2012). The findings that action fluency activates the frontostriatal network have been supported by neuroimaging studies in both clinical groups and healthy adults (Beber & Chavez, 2014; Sanjuán et al., Reference Sanjuán, Bustamante, Forn, Ventura-Campos, Barrós-Loscertales, Martínez and Avila2010).
Seeing that action fluency is particularly sensitive to impairments in frontostriatal structures, it has also been proposed to rely less on temporal structures compared to letter fluency and semantic fluency (Piatt, Fields, Paolo, & Tröster, Reference Piatt, Fields, Paolo and Tröster1999; Rodrigues et al., Reference Rodrigues, Ferreira, Coelho, Rosa and Castro-Caldas2015; Signorini & Volpato, Reference Signorini and Volpato2006). Action fluency has further been suggested to tap unique aspects of executive functioning compared to other, traditional executive functioning tasks (e.g., Piatt, Fields, Paolo, & Tröster, Reference Piatt, Fields, Paolo and Tröster1999). McDowd et al. (Reference McDowd, Hoffman, Rozek, Lyons, Pahwa, Burns and Kemper2011) found that action fluency was relatively more impaired compared to letter fluency and semantic fluency in a group of individuals with Parkinson disease, a disease linked to frontostriatal impairment, even when speed of processing was controlled for. Performance on the action fluency task has been reported to be less dependent on long-term memory (LTM; Piatt, Fields, Paolo, Koller, & Tröster, Reference Piatt, Fields, Paolo, Koller and Tröster1999; Piatt et al., Reference Piatt, Fields, Paolo and Tröster2004) compared to letter fluency and semantic fluency (Piatt, Fields, Paolo, Koller, et al., Reference Piatt, Fields, Paolo, Koller and Tröster1999; Ruff, Light, Parker, & Levin, Reference Ruff, Light, Parker and Levin1997), and is suggested to rely less, or not at all, on expressive vocabulary (Piatt, Fields, Paolo, Koller, et al., Reference Piatt, Fields, Paolo, Koller and Tröster1999).
Dyslexia
Developmental dyslexia is defined as a specific learning disability of neurobiological origin. According to a widely accepted definition, the core deficits in dyslexia are characterized by persistent difficulties in written word recognition and spelling that cannot be better explained by intelligence level or lack of instruction (Lyon, Fletcher, & Barnes, Reference Lyon, Fletcher and Barnes2003). Adults with dyslexia might reach an acceptable level in word decoding (Lefly & Pennington, Reference Lefly and Pennington1991); however, difficulties in reading fluency are often persistent (Lefly & Pennington, Reference Lefly and Pennington1991; Shaywitz et al., Reference Shaywitz, Shaywitz, Fulbright, Skudlarski, Mencl, Constable and Lyon2003; Tunmer & Greaney, Reference Tunmer and Greaney2010). Reading fluency is the ability to read a text fast and correct with preserved reading comprehension (see National Reading Panel, 2000).
According to a highly influential explanatory theory, the reading difficulties in dyslexia are caused by a specific underlying impairment in phonological processing (Bishop & Snowling, Reference Bishop and Snowling2004; Frith, Reference Frith1985; Nithart et al., Reference Nithart, Demont, Majerus, Leybaert, Poncelet and Metz-Lutz2009), including both explicit phonological processing, namely, phonological awareness, and implicit phonological processing, such as tasks of nonword repetition and rapid automatized naming (RAN; e.g., Melby-Lervåg, Lyster, & Hulme, Reference Melby-Lervåg, Lyster and Hulme2012). Phonological processing ability allows for the acquisition of phoneme–grapheme mapping knowledge as well as storing phonological information in memory, capacities important in learning to decode written novel words (Kamhi & Catts, Reference Kamhi and Catts2012, pp. 94–95). In transparent orthographies, such as Swedish, German, and Dutch, the connection between decoding and phonological awareness decreases after the first years of school, while difficulties with RAN appear to be persistent across age, which makes RAN an important measure in assessments of adults with reading disabilities (Furnes & Samuelsson, Reference Furnes and Samuelsson2011; Landerl & Wimmer, 2008; Hsieh & Swanson, Reference Hsieh and Swanson2009). However, the deficits in RAN are hypothesized to be caused by impaired phonological processing on one hand (Catts, Reference Catts1989; Kamhi & Catts, Reference Kamhi and Catts2012; Wagner & Torgesen, Reference Wagner and Torgesen1987), and by a neurological timing deficit on the other hand (see the double-deficit hypothesis; Wolf & Bowers, Reference Wolf and Bowers1999; Wolf, Bowers, & Biddle, Reference Wolf, Bowers and Biddle2000). Further, studies have shown that phonological awareness and RAN contribute independently to variance in reading ability (Furnes & Samuelsson, Reference Furnes and Samuelsson2011; Wolf & Bowers, Reference Wolf and Bowers1999; Wolf et al., Reference Wolf, Bowers and Biddle2000).
The notion that a specific phonological deficit is sufficient to cause dyslexia has been challenged. According to the multiple deficit model (Pennington, Reference Pennington2006; Pennington & Bishop, Reference Pennington and Bishop2009), significant reading impairments stem from the combined impact of at least one other cognitive risk factor in addition to phonological difficulties. In line with this proposition, speed of processing has been shown to explain unique variance in reading ability even when taking RAN and phonological awareness into consideration (McGrath et al., Reference McGrath, Pennington, Shanahan, Santerre-Lemmon, Barnard, Willcutt and Olson2011; Willcutt et al., Reference Willcutt, Betjemann, McGrath, Chhabildas, Olson, DeFries and Pennington2010).
Other theories that emphasize the contribution of cognitive factors beyond a specific phonological deficit in dyslexia include the hypothesis that many of the phonological and nonphonological deficits that have been linked to the disorder are symptoms of an underlying impairment of the procedural memory system (Fawcett & Nicolson, Reference Fawcett and Nicolson2004; Nicolson, Fawcett & Dean, Reference Nicolson, Fawcett and Dean2001; Ullman & Pierpoint, Reference Ullman and Pierpoint2005). Procedural memory relies on a network of brain structures in which circuits connecting the frontal cortex with the basal ganglia (i.e., frontostriatal circuits) play a crucial role (Orban, Lungu, & Doyon, Reference Orban, Lungu and Doyon2008). The procedural memory system is involved in the learning and automatization of motor functions and skills involving sequences of actions (i.e., learning how to ride a bicycle), but it has also been shown to be important for other cognitive and linguistic skills, including working memory (Dahlin, Neely, Larsson, Backman, & Nyberg, Reference Dahlin, Neely, Larsson, Backman and Nyberg2008; Ullman, Reference Ullman2004; Ullman & Pierpoint, Reference Ullman and Pierpoint2005), lexical retrieval (Ullman, Reference Ullman2004), executive functions (Leh, Petrides, & Strafella, Reference Leh, Petrides and Strafella2010), and the implicit learning and automatization of aspects of grammar, in particular those requiring sequential processing, across phonology, morphology, and syntax (Petersson, Folia, & Hagort, 2012; Ullman, Reference Ullman2004; Ullman & Pierpoint, Reference Ullman and Pierpoint2005).
It has been hypothesized that frontostriatal abnormalities may contribute to reading problems in at least two ways; first, difficulties with sequential processing may lead to phonological processing problems, which in turn affect phonological awareness and phoneme–grapheme mapping ability; and second, general problems with skill automatization may entail that learned reading-related skills fail to become automatized and instead remain slow and laborious (Hedenius, Reference Hedenius2013; Nicolson & Fawcett, Reference Nicolson and Fawcett2007; Ullman, Reference Ullman2004). The procedural memory deficit hypothesis (PDH; see Ullman & Pierpoint, Reference Ullman and Pierpoint2005) proposes that impaired frontostriatal structures might underlie some language and implicit nonlanguage deficits found in dyslexia (Hancock, Richlan, & Hoeft, Reference Hancock, Richlan and Hoeft2016; Hedenius et al., Reference Hedenius, Persson, Alm, Ullman, Howard, Howard and Jennische2013; Howard, Howard, Japikse, & Eden, Reference Howard, Howard, Japikse and Eden2006; Laasonen et al., Reference Laasonen, Väre, Oksanen-Hennah, Leppämäki, Tani, Harno and Cleeremens2013; Lum, Ullman, & Conti-Ramsden, Reference Lum, Ullman and Conti-Ramsden2013).
Brain imaging studies of individuals with dyslexia have found alterations in both cortical and subcortical structures and activation patterns in individuals with dyslexia. These findings include atypical cortical lateralization (Habib, Reference Habib2000; see Kershner, Reference Kershner2015; Vanderauwera et al., Reference Vanderauwera, Altarelli, Vandermosten, De Vos, Wouters and Ghesquière2016), suggested to derive from abnormalities in early stages of brain maturation and development (Galaburda, Reference Galaburda2006), and decreases in gray matter in the left temporal lobe, frontal lobe, striatum, thalamus, and cerebellum (Brown et al., Reference Brown, Eliez, Menon, Rumsey, White and Reiss2001; Eckert, Reference Eckert2004; for a mini-review, see Kershner, Reference Kershner2015).
Verbal Fluency in Dyslexia
Studies of verbal fluency in dyslexia have yielded mixed findings. To date, studies have focused on letter and semantic fluency, which are the most commonly used verbal fluency tasks in research (Davis et al., Reference Davis, Heidler-Gary, Gottesman, Crinion, Newhart, Moghekar and Hillis2010). In studies of children with dyslexia, letter fluency has been found to be relatively more impaired compared to semantic fluency (Brosnan et al., Reference Brosnan, Demetre, Hamill, Robson, Shepherd and Cody2002; Frith, Landerl, & Frith, Reference Frith, Landerl and Frith1995; Lipowska, Bogdanowicz, & Buliński, Reference Lipowska, Bogdanowicz and Buliński2008). The same pattern has been reported in some studies of older students, and adults, with dyslexia (Brosnan et al., Reference Brosnan, Demetre, Hamill, Robson, Shepherd and Cody2002; Hatcher, Snowling, & Griffiths, Reference Hatcher, Snowling and Griffiths2002; Smith-Spark, Henry, Messer, & Zięcik, Reference Smith-Spark, Henry, Messer and Zięcik2017). Other studies have found that semantic fluency is more impaired (Tillema, Reference Tillema2015), that both fluency tasks are equally impaired (Snowling, Nation, Moxham, Gallagher, & Frith, Reference Snowling, Nation, Moxham, Gallagher and Frith1997), or that verbal fluency is intact in dyslexia (Mielnik, Łockiewicz, & Bogdanowicz, Reference Mielnik, Łockiewicz and Bogdanowicz2015).
To our knowledge, there are no studies examining a possible association between action fluency and reading ability. This is somewhat surprising, not least in light of the well-documented frontostriatal underpinnings of action fluency together with the proposition that the frontostriatal procedural memory system is impaired in dyslexia (Hancock et al., Reference Hancock, Richlan and Hoeft2016; Hedenius et al., Reference Hedenius, Persson, Alm, Ullman, Howard, Howard and Jennische2013; Howard et al., Reference Howard, Howard, Japikse and Eden2006; Laasonen et al., Reference Laasonen, Väre, Oksanen-Hennah, Leppämäki, Tani, Harno and Cleeremens2013; Ullman & Pierpoint, Reference Ullman and Pierpoint2005). Further, the relationship between verbal fluency and technical reading skills, such as word decoding or reading fluency, has not been examined in earlier studies. Studies of verbal fluency in individuals with dyslexia have examined performance by measuring the number of words produced, some also investigating clustering and switching, in order to clarify their relation to cognitive abilities such as phonological processing and executive function. These studies have pointed out that difficulties in both phonological processing and executive control are possible explanatory factors underlying impairments in verbal fluency in adults with dyslexia (i.e., Mielnik et al., Reference Mielnik, Łockiewicz and Bogdanowicz2015; Smith-Spark et al., Reference Smith-Spark, Henry, Messer and Zięcik2017).
The Present Study
In this study, performance on letter fluency, semantic fluency, and action fluency was examined in relation to reading ability in university students with and without dyslexia. The overall aim was to extend the literature on verbal fluency in dyslexia by (a) including an examination of action fluency, in addition to letter and semantic fluency; (b) exploring the degree to which the fluency tasks appear to tap overlapping and unique neurocognitive mechanisms in relation to each other, and to phonological awareness and RAN; and (c) investigating the relative predictive power of each fluency task in relation to reading ability, on its own, as well as when including group, phonological awareness, and RAN in the model. Research questions included the following:
1. Is letter fluency, semantic fluency, and action fluency impaired in students in higher education with dyslexia, compared to students without dyslexia?
2. To what extent do the three fluency tasks correlate with each other and with other reading-related variables (phonological awareness and RAN)?
3. To what extent can each of the three fluency tasks predict variance in reading ability, on their own, and when adding group, phonological awareness, and RAN to the model?
The results on the verbal fluency tasks were expected to follow the most common finding, namely, that performance on letter fluency, due to its stronger relation to phonological processing ability, is impaired compared to semantic fluency in dyslexia. Based on studies indicating frontostriatal impairments in dyslexia, action fluency was also expected to be more impaired compared to semantic fluency in individuals with dyslexia. Due to semantic fluency being less dependent on phonological processing and frontostriatal circuitry, as well as the significant role of education on verbal fluency performance, it was hypothesized that the students with dyslexia would have the opportunity to reach a near adequate level in semantic fluency.
It was further hypothesized that the three fluency tasks would correlate weakly to moderately with each other, reflecting partly overlapping and partly unique neurocognitive mechanisms. Due to the assumed greater dependence on phonological skills, letter fluency was expected to correlate more strongly with phonological awareness and RAN, compared to both semantic fluency and action fluency.
Methods
Participants
The study included 42 students in higher education, of whom 16 had diagnosed dyslexia (developmental dyslexia; DD group) and 26 were controls without dyslexia (typical development; TD group). Two additional students participated but were excluded due to 1 being bilingual and 1 withdrawing because of lack of time to continue participating. The participants were recruited as a part of a larger project about memory and dyslexia (Reading, Memory, and Brain [REMEMBR]), through posters in Uppsala University information was spread on social media, as well as through contact with dyslexia associations, counsellors for students with disabilities, and distributors of assistive technology. All participants had to be students, 18–40 years old, monolingual Swedish speaking, and not have any neurological, psychiatric, or neuropsychiatric disorders. In addition to that, the participants in the DD group had to have diagnosed dyslexia, previously diagnosed by a clinician, and self-reporting that they have had/currently have reading difficulties.
Participants were interviewed prior to testing about language and reading development, heredity and difficulties with concentration, impulse control, and hyperactivity. All participants in the DD group reported having a history of difficulties with reading and/or writing. In the TD group, two participants stated they had difficulties with reading only in lower elementary school. Remaining participants in the TD group did not state any earlier difficulties. No one in the TD group stated difficulties regarding concentration, impulse control, and hyperactivity. In the DD group, two participants reported having difficulties with concentration only when reading: one stated difficulties with concentration when reading only at a younger age, and the other participant stated difficulties concentrating (not specified when) but had gone through formal assessment and did not qualify for a diagnosis (such as attention-deficit/hyperactivity disorder).
Demographic characteristics.
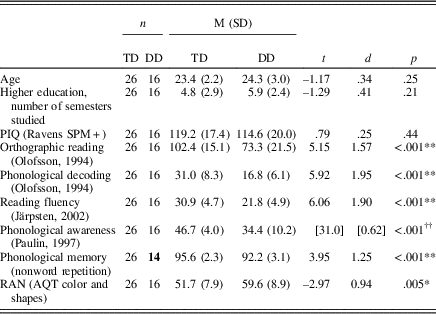
The participants performed a test battery distributed over 2 days, which included tests of verbal fluency, reading ability, phonological awareness, LTM, and nonverbal IQ. See Table 1 for group-level descriptive statistics and results on the included tests. The results on the LTM tasks were analyzed and reported separately in student theses (Hällgren & Shareef, Reference Hällgren and Shareef2015; Pierre & Toreheim, Reference Pierre and Toreheim2014).
Descriptive statistics on group level regarding participant’s age, semesters of higher education, PIQ, and results on the test battery
Note:
* p<.05, two-tailed
** p<.001, two-tailed
†† p<.001, Mann–Whitney U test. Presented in brackets are the results from a Mann–Whitney U test (U) and the effect size (absolute value of r, where a large effect size equals a value larger than .5). Due to ceiling effects in the TD group, the assumption of normality was not met in Paulin’s test of phonological awareness. Standard deviation are within parenthesis. DD, developmental dyslexia, TD, typical reading development. PIQ, performance IQ. RAN, rapid automatized naming. AQT, A Quick Test of Cognitive Speed.
The two groups did not differ significantly in sex, age, level of higher education, or nonverbal IQ (performance IQ, examined with SPM+ Raven’s Standard Progressive Matrices—Plus Version; Raven, Reference Raven2000). The DD group had significantly lower results on all the tests in the test battery compared to the TD group, which is in line with findings on difficulties generally related to dyslexia (see Kamhi & Catts, Reference Kamhi and Catts2012).
To confirm that the DD group had reading difficulties compared to the TD group, reading ability was assessed with timed tests of orthographic reading, phonological decoding (Åke Olofssons ordavkodningstest; Olofsson, Reference Olofsson1994), and reading fluency (DLS reading speed: 7th grade—first year of upper secondary school; Järpsten, Reference Järpsten2002). Orthographic reading was assessed by asking the participants to underline the correctly spelled word of a word pair, where the words were phonologically alike but orthographically different (e.g., taxi-*taksi). The maximum score was 120, and the participants had 2 min to complete the task. In the phonological decoding test, the participant was asked to choose one nonword, out of three or four nonwords, that sounds like a real word despite it being spelled wrong (e.g., *vasp, jus, and *sorf, where “jus” is pronounced like the word “ljus,” meaning candle or bright). The maximum score was 80, and the participants had 2 min to complete the task. Reading fluency was assessed through having the participants read a continuous text with 36 blanks where words were missing. In those blanks there were three suggested words, and the participant was asked to choose the word that was suitable in the context. The task was timed, and the participants had 4 min to complete it. The reading fluency task demands reading a text quickly and accurately with preserved reading comprehension (National Reading Panel, 2000). The simple view of reading (Gough & Tunmer, Reference Gough and Tunmer1986; Hoover & Gough, Reference Hoover and Gough1990) suggests that individual differences in reading comprehension can be explained by language comprehension and word decoding. The type of tasks used to assess reading comprehension seem to differ regarding to what extent they involve word decoding and language comprehension. Keenan, Betjemann, and Olson (Reference Keenan, Betjemann and Olson2008) found that reading comprehension in sentences (i.e., filling in blanks and timed tests) seems to correlate more with word decoding than language comprehension, compared to reading comprehension in longer texts.
In addition to reading ability, participants performed tasks assessing phonological awareness, RAN, and nonword repetition. Phonological awareness was assessed with Paulin’s test of phonological awareness (Berggren, Reference Berggren2013; Paulin, Reference Paulin1997). The test has a maximum score of 50 and consists of five parts: phoneme deletion, deletion of a sequence of phonemes, reversed phoneme sequences in words, reversed phoneme sequences in nonwords, and spoonerisms (Chard & Dickson, Reference Chard and Dickson1999; e.g., Kamhi & Catts, Reference Kamhi and Catts2012). These five tasks have been found to be reliable in assessing phonological awareness, as well as identifying students with dyslexia (see Berggren, Reference Berggren2013; Preston & Edwards, Reference Preston and Edwards2007; Wilson & Lesaux, Reference Wilson and Lesaux2001). A Quick Test of Cognitive Speed (Wiig, Nielsen, Minthon, & Warkentin, Reference Wiig, Nielsen, Minthon and Warkentin2002) was used to examine RAN. The test requires the continuous naming of 40 figures with different shapes and colors and is assessed in three separate tasks: color naming, shape naming, and color–shape naming. The naming speed on the color–shape naming task is used as a measure of RAN (Wiig et al., Reference Wiig, Nielsen, Minthon and Warkentin2002). Test–retest reliability in A Quick Test of Cognitive Speed has found to be high in elders with dementia, reaching a value of .88 (e.g., Palmqvist, Minton, Wattmo, Londos, & Hansson, 2010; Takashani, Awata, Sakuma, Inagaki, & Ijuin, 2012). Participants were to listen to and repeat 24 nonwords (Wass et al., Reference Wass, Ibertsson, Sahlén, Lyxell, Hällgren and Larsby2005). The nonwords increased in difficulty regarding the number of syllables and consonant clusters, including consonant sequences that are both allowed as well as prohibited in Swedish. The 24 words contained a total of 120 consonants, and points were given when the consonants were repeated in the right order. The results of two DD participants on this task were removed due to technical issues.
The tasks used in the test battery are nonstandardized for the present sample, and standardizations only reach ages of adolescence in Swedish norms. However, the tasks chosen are commonly used measures of reading ability and phonological processing in populations with reading disabilities (Kamhi & Catts, Reference Kamhi and Catts2012, pp. 117–122). Factors in favor of increasing the reliability of the current test battery include the tasks being strictly timed and having simple scoring procedures. These factors increase the likelihood of the test leaders using the same procedures in scoring the tasks. Nevertheless, the three reading tasks, orthographic reading, phonological decoding, and reading fluency, were performed silently, which makes it hard to control if participants use other strategies than intended to complete the task (please see the Data Analysis section for further information).
Stimuli and procedure
The word fluency tasks that were examined were letter fluency (for the letters F, A, and S), semantic fluency of animals, and action fluency (see Tallberg et al., Reference Tallberg, Ivachova, Tinghag and Östberg2008). The participants were instructed to produce as many words as possible during 1 mi for each letter and category. The instructions were read aloud prior to each fluency task to secure that all participants got the same oral and written information. For the letter fluency task (FAS), the participants were asked to say as many words as possible that begin with each letter, and they were timed when they first heard the letter. For the semantic fluency task (animals), they were informed that they were going to say as many words as possible that belong to a specific category. The timing started when they heard the category. For the action fluency task (action verbs), the participants were asked to say as many things as possible that one can do. The timing started when they were asked to start. They were told that they were not scored for cities or names, repeated words, or affixed or compound words with the same root.
The verbal fluency tasks were performed along with the other tests in the test battery. The testing was distributed and performed during 2 consecutive days in a quiet room. The first day started with an initial interview and computerised LTM tasks, followed by tests of orthographic reading, phonological decoding, RAN, nonword repetition, and phonological awareness. Day 2 also started with a short interview and LTM tasks, followed by tests of reading fluency, verbal fluency, and performance IQ.
Data analysis
Combined total reading score.
For data reduction purposes, a combined total reading score was calculated. The operationalization of the reading variable was based on a widely accepted definition of dyslexia, where the core deficits are persistent difficulties in written word recognition and spelling (Lyon et al., Reference Lyon, Fletcher and Barnes2003). Although adults with dyslexia might reach an acceptable level in word decoding, difficulties in reading fluency are often still persistent (Lefly & Pennington, Reference Lefly and Pennington1991; Shaywitz et al., Reference Shaywitz, Shaywitz, Fulbright, Skudlarski, Mencl, Constable and Lyon2003; Tunmer & Greaney, Reference Tunmer and Greaney2010). Thus, timing is of essence when assessing reading ability in this population (Tunmer & Greany, 2010).
The results on the tests of reading fluency, phonological decoding, and orthographic reading were used for the combined reading score. To calculate the combined total reading score, a factor analysis was conducted using principal components extraction, namely, principal component analysis (PCA). PCA captures shared, as well as unique, variance of the reading tests into the extracted reading factor. Thus, the combined total reading score was composed by the factor (component) score for each participant. The combined total reading score will be referred to as reading ability in this article.
The PCA showed that the three reading tasks contributed to the extracted factor (orthographic reading = .87, phonological decoding = .70, and reading fluency = .88), and together they accounted for 67% of the total variance in reading ability. In order to further examine to what extent the three reading tests measured the same construct, measures of reliability (Cronbach’s α) and correlation analyses were conducted. The reliability coefficient of these three tests was .75, where a value over .7 is considered an acceptable value of reliability (McMillan & Schumacher, Reference McMillan and Schumacher2001). Correlation analyses showed that the results on the reading tests were significantly correlated, but with low to moderate strength of association (Phonological Decoding × Orthographic Reading r = .39, p<.01; Phonological Decoding × Reading Fluency r = .43, p<.01; Orthographic Reading × Reading Fluency r = .69, p<.001).
A substantial proportion of participants in the TD group (8 out of 26 participants, 31%) achieved the maximum score on the reading fluency test, and the TD group mean was about 1 SD unit below the maximum score. This suggests that performance on this test was limited by a ceiling effect. However, this effect does not appear to invalidate the correlation between reading fluency and orthographic reading, although the strength of the correlation may in reality be larger if a measure that separated high-performing TD participants had been used.
Statistical analyses.
To examine group differences between DD and TD in verbal fluency, and to answer the first research question, a two-tailed independent t test was performed. Effect size was measured with Cohen’s d’ where d’ = 0.20 is a small effect, d’ = 0.50 is medium, and d’ = 0.80 is large (Cohen, Reference Cohen1992). In order to examine if the group effects differed between the three fluency tasks, a Group × Task interaction was investigated in a 2 (group) × 3 (task) analysis of variance.
The second research question was investigated with correlation analyses of the relation between the three fluency tasks, phonological awareness, and RAN. The Bonferroni correction was used to control for the increased risk of Type 1 error in multiple comparisons.
In examining the third research question, the verbal fluency tasks’ ability to predict variance in reading ability, multiple linear regression analyses were conducted with reading ability as the dependent variable. In the multiple linear regression with the enter method, the three fluency tasks (letter, semantic, and action fluency) were the predictor variables. In the backward elimination regression, the predictor variables were the verbal fluency tasks, group, phonological awareness, and RAN. The backward elimination regression included all predictor variables in the first step and removed one variable at the time whose loss gave the least statistically significant change in the model fit. The backward elimination regression also allows for further precaution in case of multicollinearity between the predictor variables. Prior to analysis, the data was checked for outliers, multicollinearity (controlled with variance inflation factor and tolerance), and normal distribution of errors. The data met the assumptions and had no outliers; the multicollinearity measures had values of variance inflation factor <2 and tolerance >.1 and had approximately normally distributed errors. Correlations were addressed by using Pearson’s correlation analysis. The statistical analyses were conducted with the statistical software MiniTab 17 trial version and IBM SPSS Statistics version 22.
Ethics statement
The study followed the guidelines of the declaration of Helsinki and was reviewed for ethical considerations at the Department for Neuroscience, Unit for Speech and Language Pathology, at Uppsala University. The participants received information about the general aim and the proceedings of the study, that participation is voluntary and could be interrupted without explanation. Informed written consent was given, and the participants received two cinema tickets for their participation.
Results
Group differences in verbal fluency
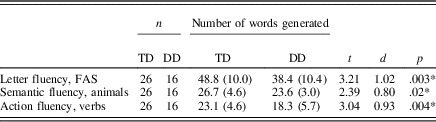
The results by group for each fluency task, indicated by the total number of correct responses during 1 min, are shown in Table 2. The result on the letter fluency task is the combined number of words produced for all three letters. As can be seen in Table 2, the DD group showed poorer performance on all three tasks, compared to the TD group. Performance in the TD group is consistent with Swedish normative data on word fluency tests for adults with matched age and level of education (Tallberg et al., Reference Tallberg, Ivachova, Tinghag and Östberg2008).
Results on the tasks letter fluency, semantic fluency, and action fluency. The result on the letter fluency task is the total number of words generated for all three letters F, A, and S
Note:
* p<.05. Standard deviation are within parenthesis. DD, developmental dyslexia. TD, typical reading development. FAS, letter fluency task.
Although the effect sizes for the fluency task indicated that letter and action fluency may be more impaired in dyslexia, compared to semantic fluency, the 2 (group) × 3 (task) analysis of variance performed on the z scores of the three fluency tasks showed that the group effects of the three tasks did not differ significantly (Group × Task interaction): F (1, 40) = 0.14, p = .87, ηρ2 = .003).
Correlation analyses
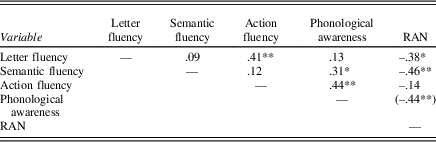
The second research question was explored with correlation analyses of the relation between the three fluency tasks, phonological awareness, and RAN. See Table 3 for a correlation matrix. The correlation matrix shows that phonological awareness correlates significantly with semantic fluency and action fluency, while RAN correlates with letter fluency and semantic fluency. The correlation analyses between three fluency tasks only show a significant correlation between letter fluency and action fluency. Scatterplots of the correlations between the fluency tasks are provided in Figure 1.
Correlation matrix (Pearsons’ r) for the verbal fluency tasks, phonological awareness and RAN
Note:
* p<.05.
** p<.01 (critical p value after Bonferroni correction). n = 42. RAN, rapid automatized naming
Scatterplots displaying the correlations (Pearson’s r) between the three verbal fluency tests: action fluency, letter fluency, and semantic fluency. Values are presented in z scores for the fluency tasks. The results of the participants in the TD group are plotted as triangles, and as squares in the DD group.
Verbal fluency as a predictor of reading ability
The regression analysis with the enter method suggests that the variance in reading ability could be predicted by the results on the fluency tasks, F (3, 38) = 10.98, p<.001, with an explained adjusted variance of 42% (R 2 = .46, R 2Adjusted = .42). The fluency tasks that uniquely contributed to predicting reading ability were action fluency (β = 0.54, p<.001) and semantic fluency (β = 0.27, p = .03), but not letter fluency (β = 0.10, p = .45).
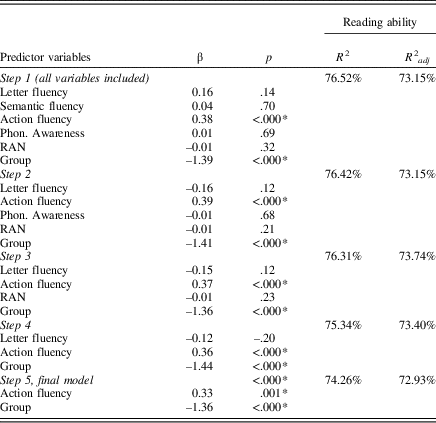
To examine the three fluency tasks’ contribution to predicting reading ability along with phonological awareness and RAN, a backward elimination regression was conducted with the five mentioned tests as well as group as predictive variables. The dependent variable was reading ability. The backward regression analysis enables all variables to be considered at the start, deleting the least significant variable, one at a time, at the chosen α-level = .10 (or p-to-remove). The standard significance level to remove is set to .05 or slightly higher, usually .10, to not risk important variables being eliminated. The first step of the regression analysis showed that out of the six predictor variables, only action fluency and group were significant predictors of reading ability. The final model in the backward elimination regression showed that action fluency and group were significant predictors of reading ability with an explained total variance of 73%. The results from the backward elimination regression are presented in Table 4.
Results of the stepwise backward elimination linear regression. Including the combined reading score (reading ability) as dependent variable, and letter fluency, semantic fluency, action fluency, phonological awareness, RAN and group as predictor variables
Note:
* p<.05, α-level = .1. RAN, rapid automatized naming.
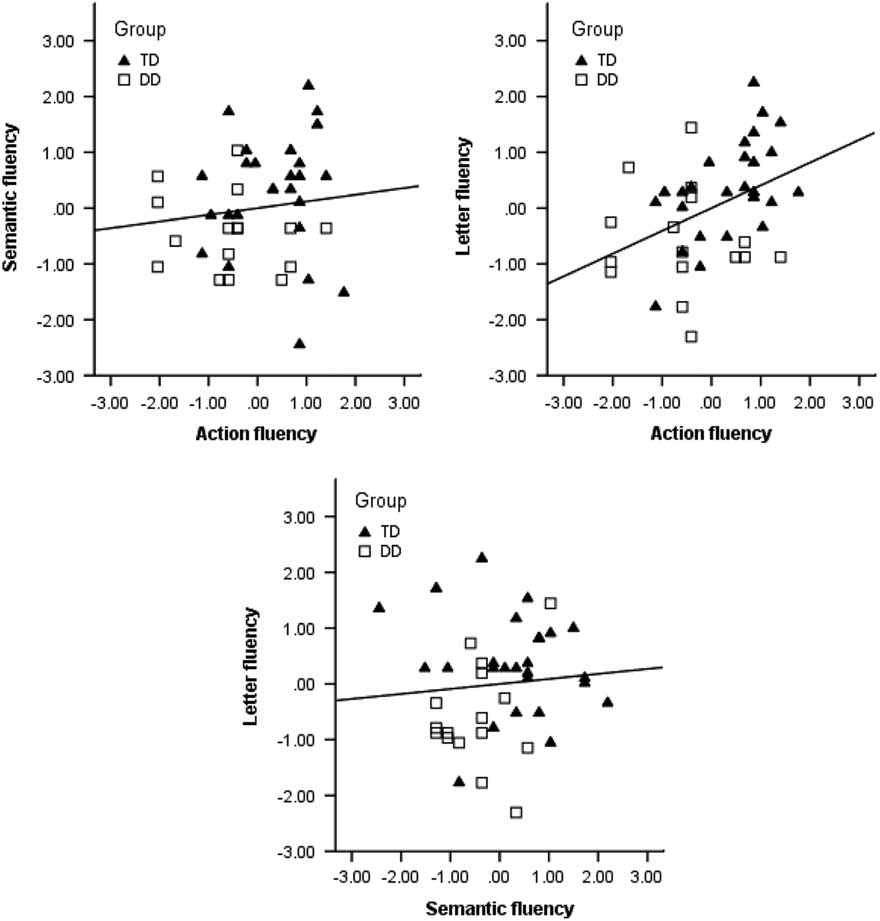
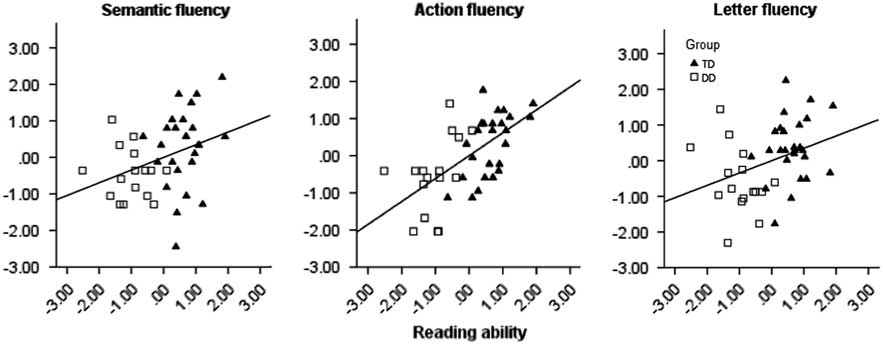
Further, in order to examine how much of the variance in reading ability could be explained by each fluency task, the correlations between the total reading score and the fluency tasks were calculated. Results showed that 39% of the variance in reading ability (r 2) was explained by action fluency, 13% by letter fluency, and 11% by semantic fluency. The correlations are presented in scatterplots in Figure 2.
Scatterplots displaying the correlations (Pearson’s r) between reading ability and the three verbal fluency tests: action fluency, letter fluency, and semantic fluency. Values are presented in z scores for the fluency tasks, and in factor scores for reading ability. The results of the participants in the TD group are plotted as triangles, and as squares in the DD group.
Discussion
In this study, performance on letter fluency, semantic fluency, and action fluency was examined in relation to reading ability in university students with and without dyslexia. The overall aim was to extend the literature on verbal fluency in dyslexia by (a) including an examination of action fluency, in addition to letter and semantic fluency; (b) exploring the degree to which the fluency tasks appear to tap overlapping and unique neurocognitive mechanisms in relation to each other, and to phonological awareness and RAN; and (c) investigating the relative predictive power of each fluency task in relation to reading ability, on their own, as well as when including group, phonological awareness, and RAN in the model.
Based on previous studies and theoretical accounts, it was hypothesized that letter fluency and action fluency would be better predictors of reading ability compared to semantic fluency. It was further hypothesized that the three tasks would correlate weakly to moderately with each other, reflecting partly overlapping and partly unique neurocognitive mechanisms. Due to the assumed greater dependence on phonological skills, letter fluency was expected to correlate more strongly with phonological awareness and RAN, compared to both semantic fluency and action fluency (e.g., Smith-Spark et al., Reference Smith-Spark, Henry, Messer and Zięcik2017). The results, which partly confirmed our hypotheses, are discussed below.
Group performances in verbal fluency
Because higher education has an association with enhanced performance on all fluency tasks (Moraes et al., Reference Moraes, Guimarães, Joanette, Parente, Fonseca and Almeida2013; Tallberg et al., Reference Tallberg, Ivachova, Tinghag and Östberg2008), we had hypothesized that semantic fluency (being less dependent on phonological processing and frontostriatal circuitry) would be near normal in the DD group. This hypothesis was not borne out as the DD group performed significantly poorer on all three tasks. Although the effect size of the group difference in semantic fluency was smaller than that of letter fluency and action fluency, the difference between the effect sizes was not statistically significant.
Our findings of impaired verbal fluency in the DD group are in line with some of the earlier studies on this population (Brosnan et al., Reference Brosnan, Demetre, Hamill, Robson, Shepherd and Cody2002; Hatcher et al., Reference Hatcher, Snowling and Griffiths2002; Smith-Spark et al., Reference Smith-Spark, Henry, Messer and Zięcik2017; Snowling et al., Reference Snowling, Nation, Moxham, Gallagher and Frith1997). A plausible explanation for the generally poorer verbal fluency performance in the DD group is that it reflects impaired frontally regulated executive control (Pennington, Reference Pennington2006; Pennington & Bishop, Reference Pennington and Bishop2009), general lexical retrieval difficulties (Nation, Reference Nation2005; Nation, Marshall, & Snowling, Reference Nation, Marshall and Snowling2001; Ullman & Pierpoint, Reference Ullman and Pierpoint2005), or impaired speed of processing (McDowd et al., Reference McDowd, Hoffman, Rozek, Lyons, Pahwa, Burns and Kemper2011; McGrath et al., Reference McGrath, Pennington, Shanahan, Santerre-Lemmon, Barnard, Willcutt and Olson2011; Willcutt et al., Reference Willcutt, Betjemann, McGrath, Chhabildas, Olson, DeFries and Pennington2010). Another possible explanation is related to the fact that verbal fluency has been reported to occur lateralized to the left hemisphere (Gaillard et al., Reference Gaillard, Sachs, Whitnah, Ahmad, Balsamo, Petrella and Grandin2003) with an increasing lateralization with age (Holland et al., Reference Holland, Plante, Weber Byars, Strawsurg, Schmithhorst and Ball2001). This coincides with the atypical lateralization hypothesis in dyslexia, where studies have found that typically lateralized abilities are less lateralized (Habib, Reference Habib2000; Vanderauwera et al., Reference Vanderauwera, Altarelli, Vandermosten, De Vos, Wouters and Ghesquière2016; for a general discussion, see Kershner, Reference Kershner2015). This atypical pattern, specifically less left-lateralized activation, has been found in individuals with dyslexia during performance of a silent letter fluency task (Illingworth & Bishop, Reference Illingworth and Bishop2009). Nevertheless, it is important to keep in mind that the results of the present study are based on behavioral assessments from a verbal fluency task without supplementary brain imaging.
Correlations between the verbal fluency tasks, phonological awareness, and RAN
Correlation analyses were conducted to explore the degree to which the fluency tasks appear to tap overlapping and unique neurocognitive mechanisms in relation to each other, and to phonological awareness and RAN. In general, the results point to the importance of considering the three verbal fluency tasks as tapping distinct abilities relying on partially separate cognitive functions and cortical areas (e.g., Mummery et al., Reference Mummery, Patterson, Hodges and Wise1996; Shao et al., Reference Shao, Janse, Visser and Meyer2014). Letter fluency and action fluency correlated weakly with each other (r = .41, p = .007), while semantic fluency did not correlate with letter fluency or action fluency. These results are possibly explained by letter and action fluency being more frontally demanding than semantic fluency; that is, they are suggested to activate frontal and frontostriatal cortical areas, respectively (Baldo et al., Reference Baldo, Schwartz, Wilkins and Dronkers2006; Henry et al., Reference Henry, Crawford and Phillips2004; Mummery et al., Reference Mummery, Patterson, Hodges and Wise1996; Piatt, Fields, Paolo, & Tröster, Reference Piatt, Fields, Paolo and Tröster1999; Rodrigues et al., Reference Rodrigues, Ferreira, Coelho, Rosa and Castro-Caldas2015).
Contrary to our hypothesis, letter fluency did not correlate significantly with phonological awareness. A study by Smith-Spark et al. (Reference Smith-Spark, Henry, Messer and Zięcik2017), examining letter fluency performance in students with dyslexia, showed that difficulties in letter fluency may be related not only to problems in phonological processing but also to executive control difficulties. This can serve as a plausible explanation for our findings, as executive control might not be captured in the correlation between phonological awareness and letter fluency in the present study. In addition, some attention to the test procedure is of importance. The instructions to the letter fluency task include asking the participants to produce words that start with a given letter, where participants possibly start searching for words based on the word’s orthography or spelling, rather than phonology. This could be more or less relevant depending on the given letter or phoneme (compare fine and phone), and the language in which the task is performed. The letter fluency task could therefore be considered as a graphemic fluency task, rather than phonemic.
There was a significant correlation between action fluency and phonological awareness (r = .44, p = .004). Considering our findings of action fluency as a predictive variable of reading ability, this correlation possibly captures the shared variance of phonological awareness and reading ability (Furnes & Samuelsson, Reference Furnes and Samuelsson2011; Wolf & Bowers, Reference Wolf and Bowers1999; Wolf et al., Reference Wolf, Bowers and Biddle2000). As opposed to semantic fluency, action fluency did not correlate with performance on RAN. Semantic fluency and RAN both require the involvement of lexical access (Mummery et al., Reference Mummery, Patterson, Hodges and Wise1996; Troyer et al., Reference Troyer, Moscovitch and Winocur1997; Wolf & Bowers, Reference Wolf and Bowers1999), possibly reflected in the significant correlation between the two variables in the present study. Considering the partial involvement of speed of processing in both RAN and action (or verbal) fluency (Kail, Hall, & Caskey, Reference Kail, Hall and Caskey1999; McDowd et al., Reference McDowd, Hoffman, Rozek, Lyons, Pahwa, Burns and Kemper2011), the nonsignificant correlation between action fluency and RAN was not expected. Speed of processing is suggested to underpin verbal fluency in general according to a study by McDowd et al. (Reference McDowd, Hoffman, Rozek, Lyons, Pahwa, Burns and Kemper2011); nevertheless, their results also indicated that action fluency performance was partially independent from speed of processing. Moreover, this result can possibly be explained by the suggestion that action fluency taps unique aspects of executive functioning compared to other, traditional executive functioning tasks (Piatt, Fields, Paolo, & Tröster, Reference Piatt, Fields, Paolo and Tröster1999), and therefore is not related to RAN.
Verbal fluency tasks as predictors of reading ability
To examine if the fluency tasks could predict variance in reading ability, two multiple linear regressions were conducted with reading ability as a dependent variable in both. The first multiple linear regression with the enter method had letter, semantic, and action fluency as predictor variables. It showed that action fluency was the strongest significant predictor followed by semantic fluency, while letter fluency could not predict reading ability. These findings suggest that letter fluency loses unique predictive power when action fluency is added. This does not exclude the importance of letter fluency in dyslexia, where impairments have been suggested by several studies, including this one. Rather, it indicates that letter and action fluency might explain variance in reading ability in a similar way, causing letter fluency to lose predictive power when action fluency is included in the model. This is in line with the suggested cortical and cognitive underpinnings of the two tasks, where frontal areas are relatively more involved in both action and letter fluency compared to semantic fluency.
The second regression analysis, with backward elimination, was conducted with the fluency tasks in addition to group, phonological awareness, and RAN as predictors, in order to examine if verbal fluency could contribute with unique predictive value in reading ability when considering the two abilities commonly found to be impaired in dyslexia. At the fifth, and last, step in the backward elimination regression, action fluency and group (DD/TD) were significant predictors with an explained total variance of 73%.
The role of action fluency in dyslexia.
The findings of this study indicate that action fluency draws on cognitive functions that partly differ from those involved in letter and semantic fluency. The findings also suggest that the neurocognitive mechanisms involved in action fluency are not captured by other tests of reading-related abilities such as RAN and phonological awareness. The results from both regression analyses propose that action fluency has enhanced predictive ability of reading ability, and the backward elimination regression further reinforces action fluency as a unique predictive variable, together with group. Correlating each fluency task with reading ability showed that action fluency could explain 39% of the variance in reading ability (r 2), compared to 13% by letter fluency and 11% by semantic fluency. Viewing reading as a compound ability that includes several neural connections and cognitive functions, the finding that action fluency alone explained 39% of the variance is rather unexpected. However, the association of frontostriatal functions with both action fluency performance and reading impairment in dyslexia could serve as a possible explanation for these results.
According to the PDH, alterations of the frontostriatal procedural memory system may explain a range of difficulties associated with dyslexia (Nicolson & Fawcett, Reference Nicolson and Fawcett2007; Ullman, Reference Ullman2004; Ullman & Pierpoint, Reference Ullman and Pierpoint2005), a proposition that has been supported by previous research reporting impaired performance on tasks thought to engage procedural memory (e.g., implicit sequence learning; Hancock et al., Reference Hancock, Richlan and Hoeft2016; Hedenius et al., Reference Hedenius, Persson, Alm, Ullman, Howard, Howard and Jennische2013; Howard et al., Reference Howard, Howard, Japikse and Eden2006; Lum et al., Reference Lum, Ullman and Conti-Ramsden2013). As noted above, research on populations afflicted with frontostriatal pathology (e.g., Parkinson disease) has indicated that performance on the action fluency task is particularly sensitive to frontostriatal abnormalities (Piatt, Fields, Paolo, & Tröster, Reference Piatt, Fields, Paolo and Tröster1999; Rodrigues et al., Reference Rodrigues, Ferreira, Coelho, Rosa and Castro-Caldas2015; Signorini & Volpato, Reference Signorini and Volpato2006). Thus, the PDH would predict that action fluency would be especially vulnerable in dyslexia. On this view, the stronger correlation between action fluency (compared to letter and semantic fluency) and reading ability reflects their joint dependence on the frontostriatal circuitry, and is not assumed to reflect any causal relationship between the two variables. The mechanisms by which frontostriatal abnormalities are suggested to lead to reading difficulties include the assumed effects on phonological processing ability and automatization of reading skills (Hedenius, Reference Hedenius2013; Nicolson & Fawcett, Reference Nicolson and Fawcett2007; Ullman, Reference Ullman2004).
A study of McGrath et al. (Reference McGrath, Pennington, Shanahan, Santerre-Lemmon, Barnard, Willcutt and Olson2011) showed that most cognitive processes can predict reading ability when observing them separately, but in simultaneous analyses, speed of processing was found to be a significant predictor of impaired word reading in dyslexia, in addition to phonological awareness and RAN. The authors conclude that phonological deficits as a simple explanatory model of reading disability does not account for a complete explanation of reading acquisition and is not fully inclusive of other contributing cognitive factors. As verbal fluency is suggested to be underpinned by speed of processing (McDowd et al., Reference McDowd, Hoffman, Rozek, Lyons, Pahwa, Burns and Kemper2011), this could explain some of the contribution of action fluency in reading ability in the present study. McDowd et al. (Reference McDowd, Hoffman, Rozek, Lyons, Pahwa, Burns and Kemper2011) studied older adults with and without Parkinson disease and concluded that speed of processing underpins verbal fluency in general. However, McDowd et al.’s findings also indicated that action fluency performance is relatively more impaired compared to letter and semantic fluency in individuals with Parkinson disease, even when speed of processing was controlled for. These findings point to a link between action fluency and the frontostriatal circuitry that is independent from speed of processing, and may further strengthen the suggestion that the strong relationship between action fluency and reading ability, observed in the present study, is due to partly overlapping neural underpinnings.
RAN as an eliminated predictor variable.
RAN and phonological awareness were removed as predictor variables in the backward elimination regression at a significance level of p = .23 and p = .68, respectively. In general, RAN and phonological awareness could be represented in the “group” variable and lose their unique predictive power. Nevertheless, considering the importance of these two abilities in dyslexia, these results are vital to emphasize. Due to the versatile and complex nature of reading impairments, as well as the uncertainties of the exact nature of deficits in RAN in dyslexia, these results might be discussed from different perspectives.
Phonological awareness being eliminated might be explained by findings that reading exposure in adults with dyslexia could improve performance on some tasks of phonological awareness, specifically in transparent orthographies, reducing the explanatory contribution of phonological awareness in this sample (Bishop & Snowling, Reference Bishop and Snowling2004; Furnes & Samuelsson, Reference Furnes and Samuelsson2011).
The type of RAN task used in this study included the naming of colors and shapes, which has been found to be impaired in adults with dyslexia, along with alphanumeric and object RAN (Felton, Naylor, & Woods, Reference Felton, Naylor and Woods1990). However, although impairments in RAN has showed to be persistent with age (Vukovic, Wilson, & Nash, Reference Vukovic, Wilson and Nash2004), it appears to have a greater predictive ability in younger children (Hulslander, Olson, Willcutt, & Wadsworth, Reference Hulslander, Olson, Willcutt and Wadsworth2010; Wolf et al., Reference Wolf, Bowers and Biddle2000). In addition, some research reports that RAN has a greater predictive power for poorer readers than nonimpaired readers (Lervåg, Bråten, & Hulme, Reference Lervåg, Bråten and Hulme2009; Scarborough, Reference Scarborough1998), such that RAN has a steep rise at predicting lower reading ability and flattens out at higher reading ability levels (Kirby, Georgiou, Martinussen, & Parrila, Reference Kirby, Georgiou, Martinussen and Parrila2010). This could affect the results in this study as all participants’ results were calculated simultaneously in the regression analysis, and the TD group was slightly larger than the DD group.
Another perspective that could explain why RAN did not contribute uniquely to predict reading ability is the hypothesis that impaired RAN is a part of a phonological deficit (as suggested by Wagner & Torgesen, Reference Wagner and Torgesen1987). Thus, some abilities required in RAN may therefore partially be reflected in the phonological awareness task, causing RAN to lose predictive power in the regression analysis and get eliminated. This notion may however be challenged; Melby-Lervåg et al. (Reference Melby-Lervåg, Lyster and Hulme2012) make a distinction between tasks of implicit and explicit phonological processing. They conclude that the phonological awareness task and RAN tap different phonological processes, as well as relate to different literacy skills (Furnes & Samuelsson, Reference Furnes and Samuelsson2011). Yet, Wolf and Bowers (Reference Wolf and Bowers1999) suggest that RAN is independent from phonological processing. Studies report varying associations between RAN and different aspects of reading ability. For instance, RAN is suggested to be more closely related to orthographic than phonological word decoding in children (Manis, Doi, & Bhadha Reference Manis, Doi and Bhadha2000; Sunseth & Bowers, Reference Sunseth and Bowers2002). Other studies report that RAN correlates more with reading fluency than orthographic word decoding (Bowers, Reference Bowers2001; Schatschneider, Fletcher, Francis, Carlson, & Foorman, Reference Schatschneider, Fletcher, Francis, Carlson and Foorman2004). In relatively transparent languages, RAN has been found to be a unique predictor of oral reading fluency, but not silent reading fluency (Papadopoulos, Spanoudis, & Georgiou, Reference Papadopoulos, Spanoudis and Georgiou2016), which is what was used in the present study. However, in the present study, reading ability was based on the combined total reading score, which consisted of three reading factors that correlated weakly to moderately with each other. Consequently, not separating the reading tests might have affected the predictive power of RAN in the backward elimination regression.
Overall, considering the first step in the regression, to include letter fluency, semantic fluency, group, phonological awareness, and RAN as predictors in the model leads to the same explained variation (73%) in reading ability as the last step, when action fluency and group are the significant predictor variables.
Methodological Discussion and Future Research
In this study, phonological decoding, orthographic reading, and reading fluency were combined into one measure of reading ability. Due to reading ability being a versatile and compound cognitive ability, studying verbal fluency in relation to specific reading processes separately could be motivated. It would also be of value to examine the relation between verbal fluency and reading-related functions other than phonological awareness and RAN. In particular, future studies would benefit from including speed of processing in the model, in order to clarify its relation to verbal fluency (e.g., McDowd et al., Reference McDowd, Hoffman, Rozek, Lyons, Pahwa, Burns and Kemper2011).
Examining students with dyslexia was thought to help shed light on verbal fluency ability when having had a possibility to expand one’s vocabulary. Considering the size of the sample in the present study, the results need to be interpreted with caution. It would be of interest to include more participants and map their previous reading ability. This enables an analysis of the predictive power of verbal fluency on a larger spectrum of reading ability in students. Further, it would be of interest to examine action fluency in children, both prior to and after reading acquisition, to rule out the effect of reading on neural connections.
By analysing verbal fluency performance based on clustering and switching, which are suggested to have different neurocognitive underpinnings (e.g., Troyer et al., Reference Troyer, Moscovitch and Winocur1997), studies have aimed at examining how different ways of measuring verbal fluency can contribute to a clearer understanding of the different underlying mechanisms in dyslexia. Studies have found that switching might be difficult in students with dyslexia (Mielnik et al., Reference Mielnik, Łockiewicz and Bogdanowicz2015), however, only in letter fluency and not in semantic fluency (Spark-Smith et al., 2017). Nevertheless, there is almost no research on switching and clustering in dyslexia, and therefore, it might be of interest to examine clustering and switching in action fluency as well, and their relation to reading ability and phonological processing.
In addition to having a theoretical importance, the results of this study could be of clinical significance. The continuous evaluation of clinical assessments of dyslexia is of great importance, and the usefulness of including verbal fluency in assessments of dyslexia should be further examined in future research. This may be particularly relevant regarding action fluency, due to its unique predictive power in the present study.
Summary and conclusion
The findings of this study indicate that action fluency can uniquely predict variance in reading ability compared to letter and semantic fluency, even when taking group, phonological awareness, and RAN into consideration. We suggest that the strong relationship between action fluency and reading ability might be at least partly explained by their joint dependence on frontostriatal brain circuitry. The novel findings in this study points to the importance of more elaborate studies on action fluency in dyslexia, including on its relevance as a tool for clinical assessment.
Acknowledgments
The study was made possible by grants to Martina Hedenius from the Sven Jerring Foundation, Sunnerdahl Disability Foundation, the Promobilia Foundation, and the Swedish Royal Academy of Sciences. The authors wish to thank all participants, Maria Hällgren, Josefine Toreheim, Janina Pierre, Hans Arinell, Anna Eva Hallin, Per Alm, Monica Blom Johansson, Anders Nilsson, Nadina Laurent, and Julia Uddén for their contributions.



