Introduction
The complex interplay between host and invading parasites may result in a wide range of changes both in the host and in the parasite (Lefèvre et al. Reference Lefèvre, Adamo, Biron, Misse, Hughes and Thomas2009; Libersat et al. Reference Libersat, Delago and Gal2009; Hughes, Reference Hughes2013; van Houte et al. Reference van Houte, Ros and van Oers2013). Some of these changes are adaptive to the host, e.g. when these changes prevent further parasite dissemination to relatives (Bos et al. Reference Bos, Lefèvre, Jensen and d'Ettorre2012). However, some of the alterations appear adaptive to the parasite, thereby enhancing parasite transmission (Lefèvre et al. Reference Lefèvre, Adamo, Biron, Misse, Hughes and Thomas2009; van Houte et al. Reference van Houte, Ros and van Oers2013). Parasites, including viruses, may alter host physiology or morphology, but may also manipulate host behaviour (Lefèvre et al. Reference Lefèvre, Adamo, Biron, Misse, Hughes and Thomas2009; van Houte et al. Reference van Houte, Ros and van Oers2013). Parasitic manipulation of host behaviour can range from temporal changes of existing behavioural traits to the induction of completely new traits. Cases of behavioural manipulation include changes in host locomotion, reproductive behaviour, feeding and phototactic behaviour (Lefèvre et al. Reference Lefèvre, Adamo, Biron, Misse, Hughes and Thomas2009; van Houte et al. Reference van Houte, Ros and van Oers2013).
Baculoviruses are arthropod-specific viruses, mainly infecting lepidopteran larvae (Williams et al. Reference Williams, Bergoin and van Oers2017). These viruses are known to induce two behavioural changes in their caterpillar hosts: hyperactivity and tree-top disease (Kamita et al. Reference Kamita, Nagasaka, Chua, Shimada, Mita, Kobayashi, Maeda and Hammock2005; Hoover et al. Reference Hoover, Grove, Gardner, Hughes, McNeil and Slavicek2011; Katsuma et al. Reference Katsuma, Koyano, Kang, Kokusho, Kamita and Shimada2012; van Houte et al. Reference van Houte, Ros, Mastenbroek, Vendrig, Hoover, Spitzen and van Oers2012; Han et al. Reference Han, van Houte, Drees, van Oers and Ros2015; Ros et al. Reference Ros, van Houte, Hemerik and van Oers2015). After infection, caterpillars become hyperactive and prior to death, they climb to the upper parts of plants, where they die. Because baculoviruses are able to liquefy their hosts, death at elevated positions potentially aids the virus to be spread over a larger area of plant foliage, thus increasing virus transmission to subsequent generations of caterpillars (Goulson, Reference Goulson1997; Hoover et al. Reference Hoover, Grove, Gardner, Hughes, McNeil and Slavicek2011; Han et al. Reference Han, van Houte, Drees, van Oers and Ros2015). Moreover, the exposed caterpillar cadavers are more visible to birds, which feed on these caterpillars and can transport the viruses over large distances (Goulson, Reference Goulson1997).
Though baculovirus-induced behavioural changes were first reported in the late 19th century, it is only during the last decade that the underlying mechanisms have started to be unravelled. Hoover et al. (Reference Hoover, Grove, Gardner, Hughes, McNeil and Slavicek2011) showed that the ecdysteroid uridine 5′-diphosphate UDP-glucosyltransferase (egt) gene of Lymantria dispar MNPV (LdMNPV) is involved in tree-top disease in L. dispar larvae. However, the egt gene of AcMNPV is not involved in inducing tree-top disease in S. exigua and Trichoplusia ni larvae: larvae infected with a mutant AcMNPV lacking the egt gene still died at elevated positions (Ros et al. Reference Ros, van Houte, Hemerik and van Oers2015). In these latter two host species, moulting-related climbing (climbing prior to moulting) was affected by egt, but not tree-top disease (climbing prior to death) (Ros et al. Reference Ros, van Houte, Hemerik and van Oers2015). In a different virus–host combination, concerning the baculovirus S. exigua MNPV (SeMNPV) and its single host S. exigua, it was found that the egt gene might be involved in tree-top disease indirectly, through prolonging the lifespan of infected larvae (Han et al. Reference Han, van Houte, Drees, van Oers and Ros2015). Wildtype (WT) SeMNPV-infected third instars climbed to and died at elevated positions between 57 and 67 h post infection (hpi). Before 57 hpi, WT SeMNPV-infected larvae stayed at low positions. Though the larvae infected with a mutant virus (lacking the egt gene) died at lower positions, meanwhile they also had a shorter lifespan (most died before 57 hpi). Consequently, mutant virus-infected larvae did not reach the time point at which climbing behaviour was observed in WT-infected larvae. Therefore, it is concluded that SeMNPV egt facilitates tree-top disease in S. exigua larvae by extending the larval lifespan (Han et al. Reference Han, van Houte, Drees, van Oers and Ros2015). The aforementioned studies showed that the effect of egt on tree-top disease is not a conserved trait among all baculoviruses, and that egt might influence larval time to death or moulting-related climbing behaviour, and therewith it can in some cases (indirectly) affect the outcome of tree-top disease.
Recently, it was found that light plays a key role in the induction of tree-top disease (van Houte et al. Reference van Houte, van Oers, Han, Vlak and Ros2014; van Houte et al. Reference van Houte, van Oers, Han, Vlak and Ros2015). Prior to death, S. exigua larvae infected with WT SeMNPV became positively phototactic and showed a strong tendency to move towards light. Infected larvae died at elevated positions when light was given from above, however, larvae died at low positions when the light was provided from below, or when larvae were continuously kept in the dark after infection. Uninfected larvae did not show phototactic behaviour, since larvae kept either in dark or in light conditions behaved similarly (van Houte et al. Reference van Houte, van Oers, Han, Vlak and Ros2014).
To better understand the role of light in baculovirus-induced behavioural changes, we investigated the importance of the timing of light exposure in the induction of positive phototaxis in SeMNPV-infected S. exigua larvae. In this paper, we show that exposure of WT virus-infected larvae to light between 43 and 50 hpi is important for the induction of light-dependent tree-top disease. In contrast, exposure to light prior to or after this period does not affect the vertical position of the larvae at death.
Materials and methods
Insect larvae and virus
Spodoptera exigua larvae were fed on artificial diet and kept at 27 °C with 50% relative humidity as described before (Smits et al. Reference Smits, van de Vrie and Vlak1986) using a 14 L : 10 D photoperiod (7:00 lights on, 21:00 lights off). SeMNPV G25, a naturally occurring WT SeMNPV strain (Murillo et al. Reference Murillo, Elvira, Muñoz, Williams and Caballero2006), was used in this study. Viral occlusion bodies (OBs) were amplified by infecting S. exigua fourth instars and OBs were purified from dead larvae and counted using a Bürker–Türk haemocytometer as described before (van Houte et al. Reference van Houte, Ros, Mastenbroek, Vendrig, Hoover, Spitzen and van Oers2012).
Behavioural assays
Experimental design
Three different behavioural assays were performed (see below) and each behavioural assay was executed twice as two independent replicates. For all three assays, newly moulted third instars of S. exigua were infected with WT SeMNPV, using droplet feeding as described before (Han et al. Reference Han, van Houte, Drees, van Oers and Ros2015). A viral titre of 106 OBs mL−1 was used for infection, which is known to kill at least 90% of infected larvae. For each treatment, 30 larvae were infected by droplet feeding. As controls, 10 mock-infected larvae, droplet fed with a virus-free solution, were used per assay. These mock-infected larvae were included to check for possible contaminations – in all assays mock-infected larvae developed normally and none of these larvae died due to a virus infection. Droplet-fed larvae were placed individually in glass jars (120 mm high and 71 mm in diameter). Jars contained a cube of artificial diet (approx. 3·5 cm3) at the bottom and were lined with sterile mesh wire to facilitate larval climbing. Jars were covered with transparent plastic Saran wrap containing three small holes for ventilation. Jars were incubated at 27 °C with 50% relative humidity. The vertical position where the infected larvae died was recorded at 5 days post infection. Larvae that did not die following virus infection (survived despite being droplet fed with virus or died of other causes) were excluded from analyses (14 out of 840 infected larvae from three behavioural assays).
Behavioural assay 1: light from above, from light to dark conditions
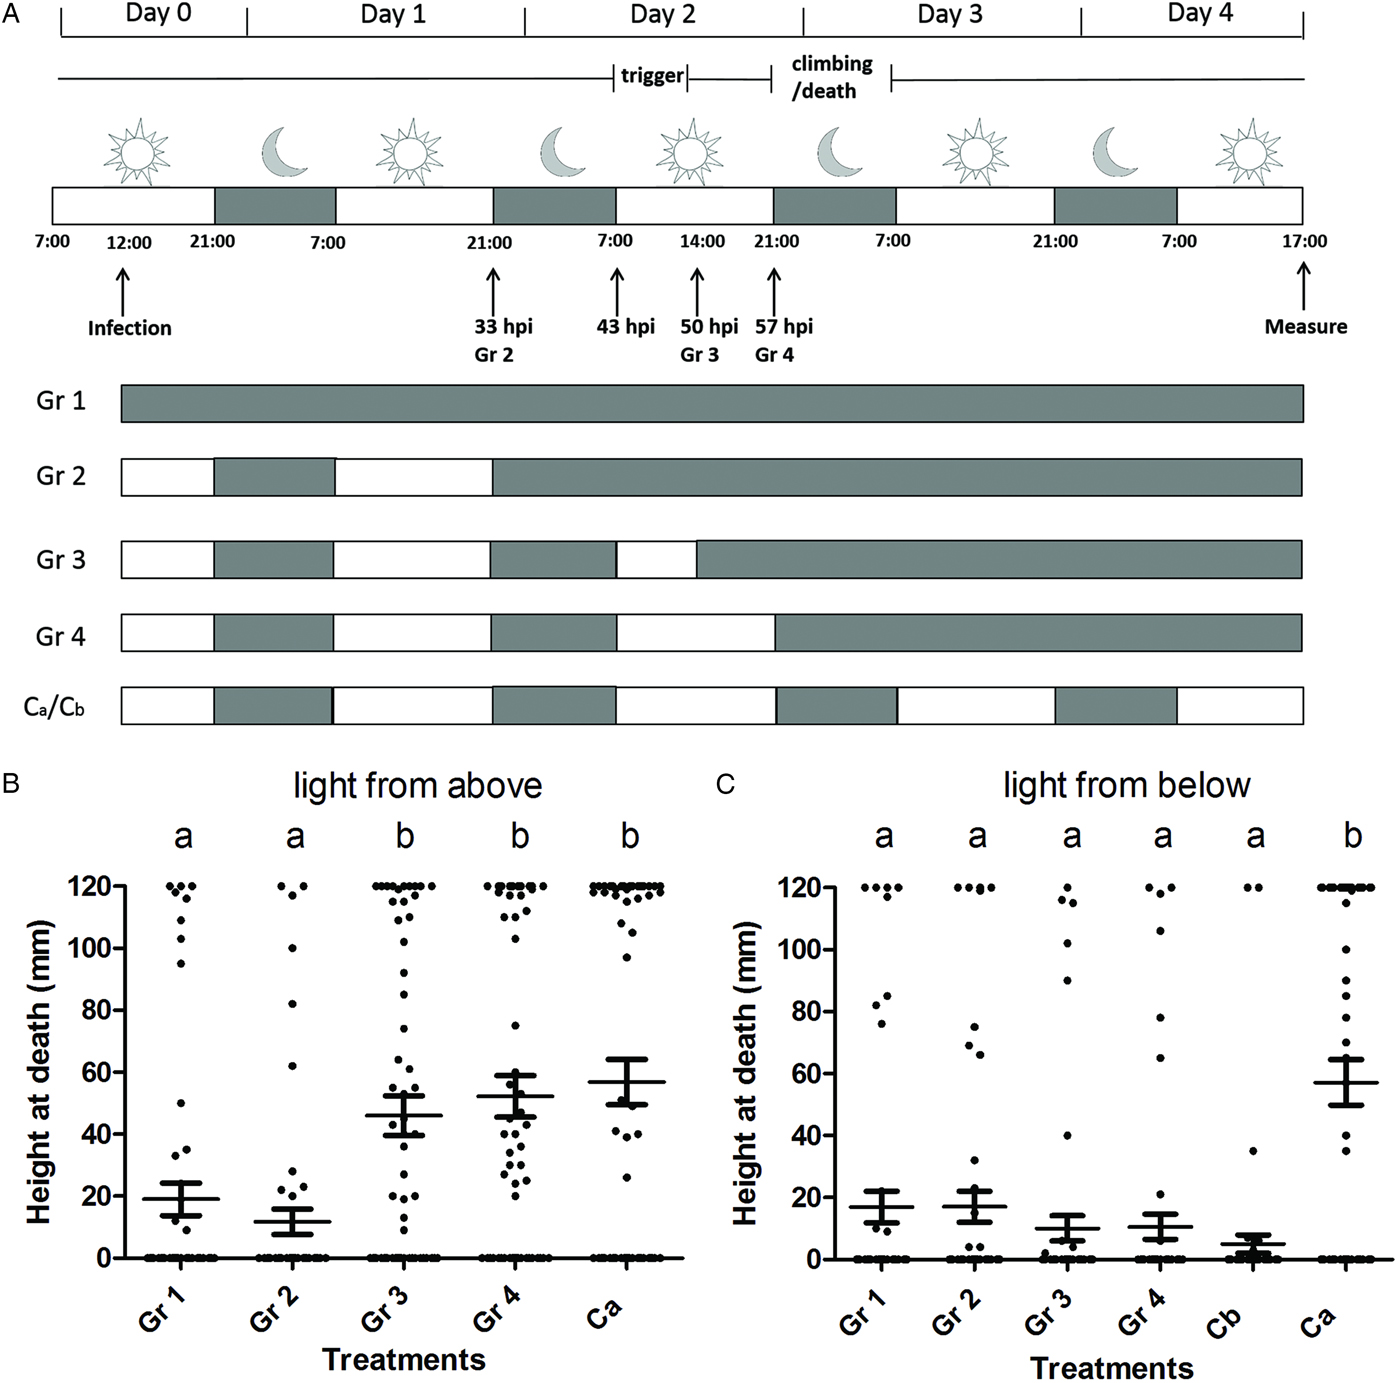
To determine the time point at which light was needed to trigger positive phototaxis, groups of 30 larvae were switched from normal day/night intervals to dark conditions at different time points post infection. In this assay, if light was used, it was applied from above using three luminescent tubes (18 W each), which were placed 30 cm above the jars containing the larvae. The side and bottom of the jars were covered with aluminium foil and the jars were placed in a black box to block light from other directions than from above. Five different experimental treatments were used: larvae of group 1 (Gr 1, Fig. 1A) were kept in the dark (0 L : 24 D) throughout the experiment; larvae of group 2, 3 and 4 (Gr 2, 3, 4 in Fig. 1A) were first exposed to the normal 14 L : 10 D photoperiod regime until 43, 50 and 57 hpi, respectively, after which they were switched to completely darkness (0 L : 24 D); larvae of the control group were kept under normal light/dark conditions (14 L : 10 D) throughout the experiment, using light from above (Ca, Fig. 1A).
Light between 43 and 50 hpi is needed to trigger SeMNPV-induced phototaxis in Spodoptera exigua larvae. (A) Scheme of the experimental set-up with grey representing a dark interval and white representing a light interval. Vertical arrows indicate the time points at which the infection was done, the different treatment groups (Gr 2–4) were moved to continuous dark conditions and the measurement of the final vertical position of larvae was done. For each treatment (Gr 1–4, Ca, Cb), the dark–light scheme is indicated. Ca represents a control with light from above that was included in both behavioural assays. Cb represents a control with light from below that was included only in behavioural assay 2. The period during which the phototaxis was triggered (‘trigger’) and the period during which the larvae climbed to elevated positions and subsequently died (‘climbing/death’) are indicated. (B) Height at death of larvae of behavioural assay 1 (light provided from above; Gr 1 (n = 58), Gr 2 (n = 59), Gr 3 (n = 59), Gr 4 (n = 58), Ca (n = 60)). (C) Height at death of larvae of behavioural assay 2 (light provided from below; Gr 1 (n = 59), Gr 2 (n = 60), Gr 3 (n = 59), Gr 4 (n = 60), Cb (n = 58), Ca (n = 59)). Data points represent the height at death (mm) of individual larvae. Horizontal lines show the mean value of height at death and whiskers the standard error of the mean. Treatment groups marked with a different letter (a or b) are significantly different (P > 0·05).
Behavioural assay 2: light from below, from light to dark conditions
To determine whether the direction of light was important during the time period determined in assay 1, the experiment was repeated with light applied only from below. To this end, three luminescent tubes (18 W each) were placed 30 cm below the jars containing infected larvae. The side of jars were covered with aluminium foil. A black box was placed over the jars to block light from other directions. Six different experimental conditions were used: larvae of Gr 1–4 (Fig. 1A) were applied with the same L : D photoperiods as described in behavioural assay 1, only the light was applied from below instead of above; larvae of two control groups were kept under normal light/dark conditions (14 L : 10 D) throughout the experiment using light from above (Ca, Fig. 1A) or from below (Cb, Fig. 1A).
Behavioural assay 3: light from above, from dark to light conditions
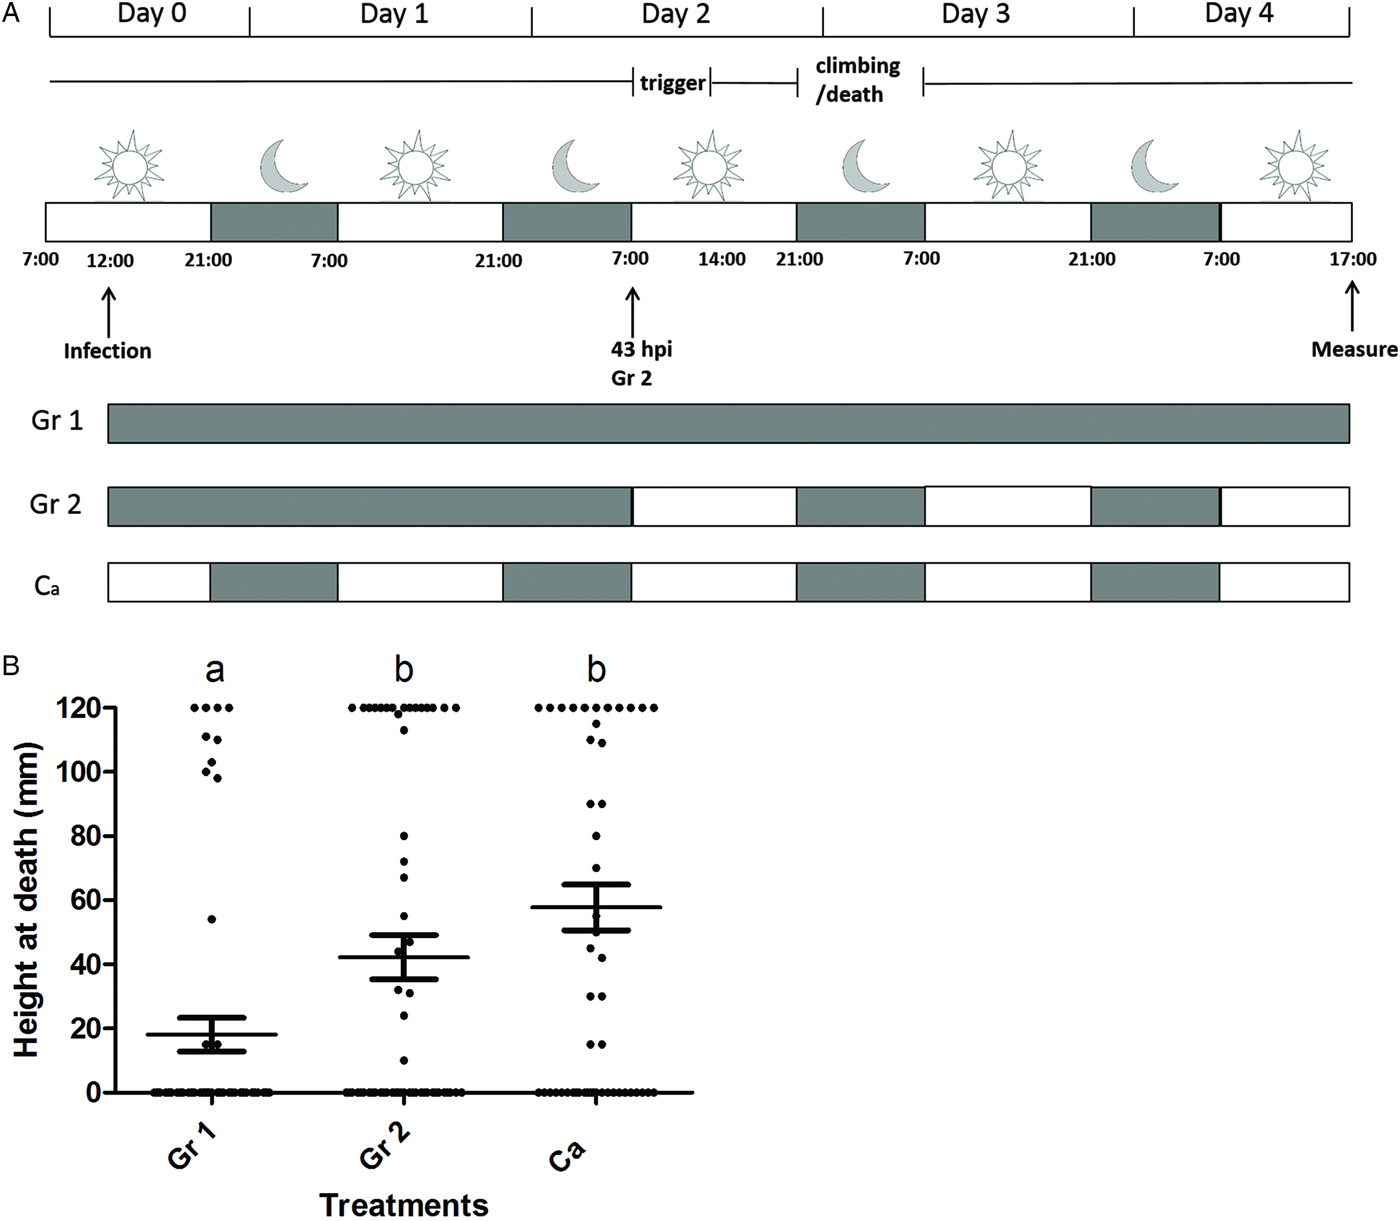
In the third behavioural assay we aimed to determine whether light at the beginning of the infection is needed for SeMNPV-induced tree-top disease. Larvae were first kept under complete dark conditions, after which they were switched to a normal light/dark regime. In this assay light was applied from above as described in behavioural assay 1. Three different experimental conditions were used: larvae of Gr 1 (Fig. 2A) were kept in the dark (0 L : 24 D) throughout the experiment; larvae of Gr 2 (Fig. 2A) were first kept in the dark (0 L : 24 D) until 43 hpi, after this point they were switched to normal light/dark conditions (14 L : 10 D); larvae of Ca (Fig. 2A) were kept under normal light/dark conditions (14 L : 10 D) throughout the experiment.
Light exposure between 0 and 43 h post infection does not affect tree-top disease. (A) Scheme of the experimental set-up with grey representing a dark interval and white representing a light interval. Vertical arrows indicate the time points at which the infection was done, treatment group Gr 2 was moved from continuous dark conditions to a normal L : D rhythm and the measurement of the final vertical position of larvae was done. For each treatment (Gr 1, Gr 2, Ca) the dark–light scheme is indicated. Ca represents a control with light from above. The period during which the phototaxis was triggered (‘trigger’) and the period during which the larvae climbed to elevated positions and subsequently died (‘climbing/death’) are indicated. (B) Height at death of larvae of behavioural assay 3 (light provided from above; Gr 1 (n = 60), Gr 2 (n = 59), Ca (n = 60)). Data points represent the height at death (mm) of individual larvae. Horizontal lines show the mean value of height at death and whiskers the standard error of the mean. Treatment groups marked with a different letter (a or b) are significantly different (P > 0·05).
Data analysis
The linear regression model (lm) analysis in the program R v3.0.0. (R Core Team, 2013) was used to analyse the position of the larvae at death (Ros et al. Reference Ros, van Houte, Hemerik and van Oers2015). Treatment (different light/dark regime) and experiment (two replicates) were used as explanatory factors and it was determined whether these factors affected the vertical positions of the larvae at death. Since most larvae died as third instar (or during moulting from third to fourth instar), larval stage was excluded as a factor.
Results
Light between 43 and 50 hpi triggers SeMNPV-induced tree-top disease
To investigate during which time period after infection light was needed for SeMNPV-induced tree-top disease, we performed a behavioural assay using virus-infected larvae exposed to different light : dark (L : D) regimes (using light from above). Results showed that light between 43 (7:00 h at day 2 post infection) and 50 hpi (14:00 h at day 2 post infection) was essential to trigger tree-top disease and light after 50 hpi was not needed for tree-top disease. Larvae kept under complete dark conditions from the start of the experiment (Gr 1 in Fig. 1B), or following the 33 hpi point (21:00 h at day 1 post infection) (Gr 2 in Fig. 1B) died at low positions. However, larvae kept under a 14 L : 10 D photoperiod until 50 hpi (so with light from 43 to 50 hpi) and then switched to darkness, died at high positions (Gr 3 in Fig. 1B) (Gr 1 (n = 58) and Gr 2 (n = 59) vs. Gr 3 (n = 59); T-test = 3·174 and 4·013, respectively; d.f. = 288; P < 0·01 and P < 0·001, respectively). Moving larvae to complete dark conditions at a later time point (57 hpi, Gr 4) or keeping them under normal L : D conditions (Ca) throughout the experiment did not affect the larval position at death: larvae of these treatments also died at high positions (Fig. 1B) (Gr 3 (n = 59) vs. Gr 4 (n =58) and Gr Ca (n = 60); T-test = 0·738 and 1·276, respectively; d.f. = 288; P = 0·461 and 0·203, respectively). There was no significant difference between the two replicates (T-test = 1·039; d.f. = 288; P = 0·300). We conclude that light between 43 and 50 hpi was important to trigger SeMNPV-induced tree-top disease and light after 50 hpi did not have a measurable influence on the outcome of tree-top disease.
The direction of light is important for tree-top disease
To determine whether the direction of light was important during the time period determined in assay 1, the behavioural assay was repeated with light applied from below. Two control groups, kept under a normal light : dark regime (14 L : 10 D), were included, one using light from above (Ca) and one using light from below (Cb). Larvae of control group Ca died at high positions (Fig. 1C) as expected, indicating that infected larvae still reacted to light in this experiment. Larvae of all other treatments died at low positions (Gr 1–4 and Cb in Fig. 1C), also when receiving light from below during the period determined in assay 1 as being crucial for the induction of tree-top disease when light was applied from above (all differences when making comparisons between Gr 1–4 and Cb are non-significant (T-test < 1·7 and P > 0·08 for all comparisons; d.f. = 348, Supplementary Table S1)); Gr Ca is significantly different from Gr 1 to 4 and Cb (T-test > 5·9 and P < 0·001 for all comparisons; d.f. = 348, Supplementary Table S1). This finding indicates that the direction of light during this period (43–50 hpi), is crucial and tree-top disease is only observed if light is applied from above during 43–50 hpi. The two replicates of this experiment were not significantly different from each other (T-test = 0·927; d.f. = 348; P = 0·355).
Light between 0 and 43 hpi is not needed for tree-top disease
We also studied whether additional light exposure between 0 and 43 hpi was needed to trigger tree-top disease. Therefore, infected larvae were first kept in darkness until 43 hpi, after which light was applied from above following a 14 L : 10 D period (Gr 2, Fig. 2). Data showed that infected larvae exposed to these conditions (Gr 2, Fig. 2B) died at high positions compared with larvae kept in completely dark conditions throughout the experiment (Gr 1, Fig. 2B; dying at low positions; Gr 2 (n = 59) vs. Gr 1 (n = 60); T-test = −2·587; d.f. = 175; P < 0·01). Moreover, infected larvae exposed to above mentioned conditions (Gr 2, Fig. 2B) died at similar positions compared with larvae kept under a 14 L : 10 D light regime throughout the experiment (Gr Ca, Fig. 2B and C; dying at elevated positions; Gr 2 (n = 59) vs. Ca (n = 60); T-test = 1·685; d.f. = 175; P = 0·973). The two replicates were not significantly different (T-test = 0·084; d.f. = 175; P = 0·933). The experimental data obtained in the third behavioural assay further suggest that a light stimulus from above is needed during the period from 43 to 50 hpi to successfully induce tree-top disease, and that light prior to this period does not have a measurable influence on the outcome of tree-top disease.
Discussion
Baculovirus-induced behavioural changes have important ecological and evolutionary consequences for both the host and the pathogen. Exciting progress has been made to reveal the underlying mechanisms. Previously, it has been shown that light applied from above is needed for the induction of tree-top disease by the baculovirus SeMNPV in S. exigua larvae (van Houte et al. Reference van Houte, van Oers, Han, Vlak and Ros2014; van Houte et al. Reference van Houte, van Oers, Han, Vlak and Ros2015). Here, we further investigated the role of light in this process and found that for SeMNPV-infected third instars light from above is needed between 43 and 50 hpi to trigger tree-top disease, which occurred between 57 and 67 hpi (Han et al. Reference Han, van Houte, Drees, van Oers and Ros2015).
Strikingly, light from above was needed between 43 and 50 hpi to induce tree-top disease, but was not needed during the period when the actual climbing took place (57–67 hpi; Han et al. Reference Han, van Houte, Drees, van Oers and Ros2015). When light was provided from above between 43 and 50 hpi, WT-infected larvae climbed to and died at elevated positions between 57 and 67 hpi, even though light was absent during the period in which they climbed. Prior to climbing (i.e. prior to 57 hpi) all infected larvae stayed at low positions (Han et al. Reference Han, van Houte, Drees, van Oers and Ros2015). Apparently, positive phototaxis was already triggered between 43 and 50 hpi, so prior to the actual climbing. Molecular pathways that lead to positive phototaxis might be activated in the infected larvae during this period. Once the pathways for positive phototaxis are activated, infected larvae do not need light anymore to climb to elevated positions. When light was provided from below in the same time span (43–50 hpi) larvae stayed at the bottom until death (behavioural assay 2). In both experiments the infected larvae moved towards the direction where the light came from in the induction period (between 43 and 50 hpi), though during climbing (57–67 hpi) they were in the dark. An alternative explanation is that the larvae somehow ‘remember’ the direction of the light (present during the trigger period) when they are climbing (during the night when light is absent).
Previous studies showed that the egt gene from SeMNPV is involved in SeMNPV induced tree-top disease in S. exigua indirectly: most WT-infected larvae climbed to and died at elevated positions between 57 and 67 hpi when light was provided above. The current experiments suggest that before the actual climbing, pathways for positive phototaxis have been activated. However, larvae infected with the SeMNPV virus lacking the egt gene have been shown to start dying from 43 hpi and most of these larvae already died before 57 hpi before actual climbing started in WT-infected larvae. Due to this earlier death, larvae infected with the egt-minus virus did not reach the point of climbing, although the pathways for positive phototaxis might have been activated also in the egt-minus virus infected larvae (Han et al. Reference Han, van Houte, Drees, van Oers and Ros2015; Ros et al. Reference Ros, van Houte, Hemerik and van Oers2015).
Though phototaxis has been observed and studied in many insect species, the underlying mechanisms are still not completely understood. In general, insects sense light of certain wavelengths using their photoreceptors (Castrejon and Rojas, Reference Castrejon and Rojas2010; Yamaguchi and Heisenberg, Reference Yamaguchi and Heisenberg2011; Otsuna et al. Reference Otsuna, Shinomiya and Ito2014; Sun et al. Reference Sun, Tian, Zhang, Zhao, Zhang and Ma2014). Neuron cells can sense the output from photoreceptors and deliver the signal to the insect's central nervous system (CNS). In the CNS, different pathways might be triggered that finally lead to the phototactic behaviour. However, the trigger appears to differ among different insect species. For example, lepidopteran larvae and moths show a strong preference for green and blue light (520 and 460 nm in wavelength) (Castrejon and Rojas, Reference Castrejon and Rojas2010; Sun et al. Reference Sun, Tian, Zhang, Zhao, Zhang and Ma2014), while the fruit fly Drosophila melanogaster prefers light with shorter wavelength, like ultraviolet (UV) light (400 nm in wavelength) (Fischbach, Reference Fischbach1979; Otsuna et al. Reference Otsuna, Shinomiya and Ito2014). Honey bees (Apis mellifera) have three spectral types of photoreceptors, for UV, blue and green light, while D. melanogaster has five types of photoreceptors differing in spectral properties (Yamaguchi and Heisenberg, Reference Yamaguchi and Heisenberg2011). A few downstream genes have been identified to play a role in phototaxis. For example, the tim and per genes, which encode components of the circadian clock, are important for phototactic behaviour in D. melanogaster larvae (Keene and Sprecher, Reference Keene and Sprecher2012). The neurotransmitter serotonin was found to play a role in phototactic behaviour in honey bees (Yamaguchi and Heisenberg, Reference Yamaguchi and Heisenberg2011).
Positive phototaxis is not only induced in baculovirus-infected caterpillars, but also in other parasite–host systems. Parasites may induce positive phototaxis by invading or affecting the CNS of their hosts. Crickets infected with Gordian worms present strong phototaxis shortly before the maturation of the Gordian worms. Moreover, the phototaxis is reversible: once the mature Gordian worms are released, the crickets are not attracted to light anymore (Ponton et al. Reference Ponton, Otálora-Luna, Lefèvre, Guerin, Lebarbenchon, Duneau, Biron and Thomas2011). A comparative proteomic study revealed that manipulated crickets exhibit higher expression levels of proteins involved in vision (CRAL_TRIO), CNS development, neurogenesis, circadian rhythm and neurotransmitter production (Biron et al. Reference Biron, Ponton, Marche, Galeotti, Renault, Demey-Thomas, Poncet, Brown, Jouin and Thomas2006). Positive phototaxis is also observed in amphipods infected with trematodes or acanthocephalans (both parasitic worms), which stimulate the amphipods (the intermediate host of the parasitic worms) to move closer to the water surface, where they can be consumed by predators (forming the subsequent hosts). In the gammarid Gammarus insensibilis infected with the trematode Microphallus papillorobustus expression levels of proteins that are involved in serotonin synthesis (aromatic-L-amino acid decarboxylase) and vision (CRAL_TRIO) are significantly higher than in non-infected G. insensibilis. It has been shown that in many invertebrates phototactic behaviour is related with serotonin synthesis alteration (Ponton et al. Reference Ponton, Lefèvre, Lebarbenchon, Thomas, Loxdale, Marché, Renault, Perrot-Minnot and Biron2006). Likewise, in the gammarid Gammarus pulex infected with acanthocephalan parasites, serotonin levels are also changed and have been functionally linked to changed behaviour upon light perception (Tain et al. Reference Tain, Perrot-Minnot and Cézilly2006). The freshwater amphipod Hyalella azteca infected with the acanthocephalan Corynosoma constrictum showed a significantly higher response to green light (500–550 nm) and red light (600–700 nm), but the response to blue light (400–450 nm) was not changed (Benesh et al. Reference Benesh, Duclos and Nickol2005). In Dolichoderus thoracicus ants infected with the fungus Ophiocordyceps pseudolloydii and in Succinea putris snails infected with the parasitic flatworm Leucochloridium paradoxum, the infected hosts display positive phototactic behaviour (Wesołowska and Wesołowski, Reference Wesołowska and Wesołowski2014; Chung et al. Reference Chung, Sun, Kuo, Lee, Lin and Chou2017), however, the underlying mechanisms are still unclear. Though in the described examples the individual parasites are not phylogenetically related (representing worms, viruses or fungi), they may make use of similar proximate mechanisms to modify light perception or the response there to in their hosts. We hypothesize that SeMNPV hijacks host light perception pathways in the CNS to induce tree-top disease in S. exigua and that timing of light perception plays a key role in this process. It remains to be elucidated which spectrum of the light is needed during this period. It is noticeable that light also plays a role in Bombyx mori nucleopolyhedrovirus (BmNPV)-induced hyperactivity in B. mori larvae. Light did not induce positive phototaxis in infected larvae, since both virus- and mock-infected larvae showed similar levels of phototaxis. However, light enhanced the amplitude of BmNPV-induced hyperactivity; when light was present, the induced hyperactivity was more than 2-fold higher than under dark conditions (Kamita et al. Reference Kamita, Nagasaka, Chua, Shimada, Mita, Kobayashi, Maeda and Hammock2005).
Overall we conclude that light perception is required between 43 and 50 hpi to trigger SeMNPV-induced tree-top disease in third instar S. exigua larvae. Pathways leading to positive phototaxis might be activated during this period, which leads to movement in the direction of the earlier provided light at a later stage of the infection.
Supplementary material
The supplementary material for this article can be found at https://doi.org/10.1017/S0031182017001822
Acknowledgements
We thank Els Roode and Hanke Bloksma for their help in rearing the larvae. We thank Amaya Serrano for providing the SeMNPV G25 isolate and Jan van Lent for useful discussions throughout the experiments.
Financial support
This research received no specific grant from any funding agency, commercial or not-for-profit sectors.