I. INTRODUCTION
Semiconductor nanowires (NWs) are considered as promising building blocks for nanoscale electronic and optoelectronic devices.Reference Lieber and Wang1, Reference Yang, Yan and Fardy2 The characteristic feature of NWs is their high aspect ratio which results in an extremely large surface-to-volume ratio. One beneficial consequence of the NW geometry is the efficient elastic relaxation of strain in lattice-mismatched heterostructures.Reference Glas3 Thus, dissimilar materials can be epitaxially combined while retaining an exceptionally high material quality.Reference Bjork, Ohlsson, Sass, Persson, Thelander, Magnusson, Deppert, Wallenberg and Samuelson4 At the same time, devices based on NWs are very sensitive to surface effects, making them very attractive for sensing applications.Reference Patolsky, Zheng and Lieber5, Reference Ramgir, Yang and Zacharias6 However, surface effects may also have undesired consequences for NW device performance. In particular, the functionality of any semiconductor device depends on dopants, internal electric fields, and the resulting charge carrier distributions.
Here, we review exemplary results related to the effects of the surface on electric fields and dopants for the specific case of catalyst-free GaN NWs. We expect that most of these insights hold for semiconductor NWs in general. GaN NWs were grown by plasma-assisted molecular beam epitaxy (MBE)Reference Yoshizawa, Kikuchi, Mori, Fujita and Kishino7–Reference Gotschke, Schumann, Limbachl, Stoica and Calarco12 or metal–organic chemical vapor deposition (MOCVD)Reference Hersee, Sun and Wang13 without any external catalyst/collector. The advantage of this approach is that the structural and optical quality of these catalyst-free NWs is superior to the one of catalyst-induced NWs.Reference Chèze, Geelhaar, Brandt, Weber, Riechert, Münch, Rothemund, Reitzenstein, Forchel, Kehagias, Komninou, Dimitrakopoulos and Karakostas14 The NW crystal structure is wurtzite; the NW axis is oriented perpendicular to the polar C-plane; and the sidewalls are formed by non-polar M-plane facets. More details on the properties of such NWs can be found in Ref. Reference Geelhaar, Chèze, Jenichen, Brandt, Pfüller, Münch, Rothemund, Reitzenstein, Forchel, Kehagias, Komninou, Dimitrakopulos, Karakostas, Lari, Chalker, Gass and Riechert15 and the references therein. In light of the polytypism between zincblende and wurtzite that is frequently observed for catalyst-induced NWs, it is important to note that these catalyst-free NWs are virtually free of stacking faults. In addition, it is worth to mention here that MOCVD-grown catalyst-induced GaN NWs also display the wurtzite crystal structure, but the NW axis is typically oriented along the [11 0] direction (a-axis), and therefore the sidewalls are formed by polar {0001} and semipolar {1
 01} facets.Reference Kuykendall, Pauzauskie, Lee, Zhang, Goldberger and Yang16–Reference Wang, Talin, Werder, Creighton, Lai, Anderson and Arslan18 Furthermore, GaN NWs synthesized by catalytic chemical vapor deposition (CVD) grow along the [10
 0] direction (m-axis).Reference Chen, Yeh, Chen, Yu, Liu, Wu, Chen, Chen, Peng and Chen19–Reference Long, Simpkins, Rowenhorst and Pehrsson21 The differences in growth direction imply that in catalyst-induced NWs, the interplay between polarization fields and surface effects cannot be disregarded. For this reason, we refer to such studies only selectively and for purposes of comparison.
II. FERMI LEVEL PINNING AND INTERNAL ELECTRIC FIELD
The electronic structure at semiconductor surfaces typically differs from that in the bulk and is then described by surface states. In the presence of surface states, the Fermi level E F is pinned at the surface. This Fermi level pinning causes a bending of the electronic bands in the vicinity of the surface, and accordingly a space charge region forms. C-plane unintentionally doped GaN exhibits n-type behavior and the Fermi level is pinned at the surface at a position of about 0.5–0.6 eV below the conduction band minimum E C.Reference Kocan, Rizzi, Lüth, Keller and Mishra22 Therefore, the electronic bands are bent upwards toward the surface. Equivalently, the density of free electrons decreases toward the surface. In other words, electrons have to overcome a potential barrier to reach the surface from the bulk, and an electron depletion region forms. It should be pointed out here that the character of surface states may depend sensitively on the crystallographic orientation of the surface. Hence, it is a priori not clear that the situation described above is also true for the M-plane sidewall surfaces of GaN NWs.
Besides the shallow states that contribute to the free carrier concentration and that have been discussed so far, also deep defect states may differently affect the carrier distribution in the NW bulk and at the surface, respectively. A reliable insight about surface-induced effects can be obtained only by the combination of several spectroscopic methods. In this review, we present studies based on current–voltage (I–V) characterization, surface photovoltage spectroscopy (SPS), spectral photocurrent (SPC) measurements, and photoluminescence (PL) spectroscopy. In the following, we briefly compare these different techniques.
The presence of electric fields as described above will affect charge transport and distribution. The most straightforward way to investigate these mechanisms is to measure the I–V characteristics of single dispersed NWs that are contacted at both ends. Valuable information about surface-induced effects can be obtained by carrying out these experiments both under illumination and in the dark. In both SPS and SPC experiments, electrical signals are acquired that arise from the release of free carriers due to photon absorption, either by band-to-band or defect-assisted transitions. Both techniques can also give information on transitions not observed in emission spectroscopy due to their non-radiative nature. The combination of SPS and SPC methods may enable the distinction between surface and bulk states. SPC is less sensitive to surface effects since the photocurrent is collected from the bulk of the sample, whereas in SPS, the photovoltage changes are generated in the surface region. In PL measurements, photons are detected that are emitted due to radiative transitions of excited carriers, either band-to-band or defect-assisted transitions. This technique is sensitive to both bulk and surface.
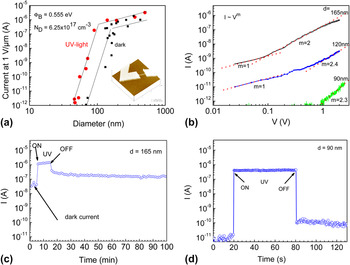
We start the review of the results with the discussion of current–voltage and photocurrent time decay measurements.Reference Calarco, Marso, Richter, Aykanat, Meijers, Hart, Stoica and Lüth23 After growth, NWs were removed from the growth substrate by inserting the as-grown sample into an ultrasonic bath, and subsequently the NWs were dispersed on an insulating host substrate. Ti/Au ohmic contacts were patterned by electron beam lithography, and thus single NWs could be electrically characterized. An atomic force microscopy (AFM) image of such a single NW device is shown in the inset of Fig. 1(a). To elucidate surface-induced effects, NWs with different diameters were measured both in the dark and under illumination. The main experimental results are shown in Fig. 1 and can be summarized as follows:
(a) Diameter dependence of the electric current through single nanowires (NWs) measured in dark and under ultraviolet (UV) light (inset is an example atomic force microscopy image of a contacted NW). Lines are guide to the eye. The current was measured within the linear range of the I–V curves and normalized to 1 V and 1 μm wire length. (b) Dependence of the dark current on bias voltage for single NWs with different diameters. The exponent m indicates the local dependence I ∼ V m. (c) and (d) Photocurrent decay measurement at a bias of 2 V of a single GaN NW with diameter 165 and 90 nm, respectively. Please note the different times scale in (c) and (d).

(i) Photoconductivity [Fig. 1(a)]: For NWs thicker than 80 nm, the photocurrent depends linearly on the wire diameter, whereas for NWs of diameter below 80 nm, the photocurrent shows a sharp drop. The dark conductivity has a similar diameter dependence.
(ii) Dark current [Fig. 1(b)]: For low bias, the dark current follows essentially a linear dependence on bias voltage, as is expected for ohmic behavior. For higher biases, the voltage dependence is quadratic to cubic.
(iii) Time decay of the photocurrent after ultraviolet (UV) illumination [Fig. 1(c)]: For thick NWs, the persistent photocurrent (PPC) is measured for a long time after illumination is switched off, whereas for NWs thinner than 100 nm, the PPC is negligible [Fig. 1(d)].
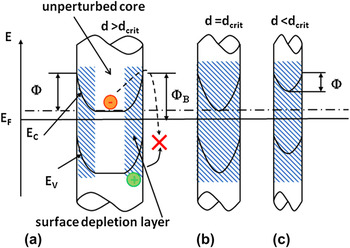
If we now suppose that the transport occurs as in a classical metallic conductor, then Ohm’s law holds and we expect the dark current to be proportional to the square of the NW diameter, which is not the behavior shown in Fig. 1(a). In particular, the dramatic change in current for low diameters implies a strong influence of the NW surface. Thus, we assume the presence of a surface depletion region induced by Fermi level pinning at the NW sidewall surfaces formed by M-plane facets. Since in NWs the width of this depletion zone may be comparable to the NW diameter, it is necessary to clarify the interplay of surface effects and diameter. To this end we developed a model assuming a cylindrical NW shape and a uniform distribution of dopants.Reference Calarco, Marso, Richter, Aykanat, Meijers, Hart, Stoica and Lüth23 The center of the NW (bulk) retains the free electron concentration related to the doping level, whereas the surface is depleted. This description holds for thicker wires (d > d crit), whereas for thinner wires (d ≤ d crit) the depletion region may extend over the complete volume of the wire. The schematic description of this effect is shown in Fig. 2 where Φ is the barrier for electrons to reach the surface, whereas Φ B is the Fermi level pinning position at the surface. Very importantly, the value of Φ depends on the diameter. For this reason, we do not expect the dark current to be simply proportional to (d − d crit)Reference Yang, Yan and Fardy2. For an exact derivation of the dark current dependence on the diameter, refer to Ref. Reference Richter, Lüth, Meijers, Calarco and Marso24.
Schematic model of electric fields in NWs induced by Fermi level pinning at the NW sidewall surfaces. Three cases of different NW diameters are depicted: (a) larger, (b) equal, and (c) smaller than the critical diameter for which the entire NW is depleted. The shadowed areas in the wires correspond to the depletion region. Only for larger diameters, there is still a small conducting channel.

Now we compare and explain the results using the model discussed above:
For thicker NWs a conduction channel in the middle and a depletion zone at the surface are present [Fig. 2(a)], which elucidates the current dependence on diameter shown in Fig. 1(a) for NWs thicker than 80 nm. For wires of a diameter around the critical value of 80 nm, the samples are fully depleted with a surface barrier height on the order of the surface-pinned Fermi level [Fig. 2(b)]. Thin wires (diameter <80 nm) are also characterized by full depletion [Fig. 2(b)], which explains their insulating character [fast drop of dark current to negligible value, see Figs. 1(a) and 1(b)]. Similar behavior was also reported for catalyst-induced NWs grown by CVD,Reference Chen, Chen, Lu, Chena, Chen, Chen and Yang20, Reference Chen, Chen, Chang, Chen, Chen and Yang25 but the critical diameter at which those NWs are fully depleted is only about 30–40 nm. This difference to the data shown in Fig. 1(a) is mainly due to the one order of magnitude higher carrier concentration in the catalyst-induced NWs.
Furthermore, Fig. 1(b) shows that the dark current depends at high biases in a quadratic to cubic way on the voltage. This behavior is characteristic for space charge-limited currents (SCLC), which occur in highly resistive semiconductors when the number of carriers injected from electrodes exceeds that of the thermal carriers, so that the injected carriers dominate the space charge region. More studies on SCLC were later on undertaken by Talin et al.Reference Talin, Swartzentruber, Léonard, Wang and Hersee26 on GaN NWs selectively grown in nanopatterned silicon nitride masks by MOCVD. These authors analyzed theoretically space charge-limited transport in thin wires and deduced that the formula describing the current density contains also the aspect ratio of the NW and thus includes the NW size and shape. This leads to the conclusion that in NWs much higher effective carrier concentrations than in thin films are needed to obtain Ohmic behavior. In a subsequent publication, the same authors demonstrated experimentally that intentional doping results in Ohmic conduction up to larger biases than in the case of undoped NWs.Reference Talin, Swartzentruber, Léonard, Wang and Hersee27
Finally, PPC as observed in Fig. 1(c) is a typical feature of bulk-like GaN. It has been explained by a distribution of capture barriersReference Hirsch, Wolk, Walukiewicz and Haller28 or multiple charge state defects related to nitrogen antisites and/or gallium vacancies.Reference Qiu and Pankove29, Reference Lin, Yang and Chen30 The fast recovery to the initial conditions exhibited by thin wires [Fig. 1(d)] is therefore very unusual. A straightforward explanation for this observation is a lower defect concentration in thin NWs that could be caused by the tendency of impurities to segregate to the surface, a phenomenon often called self-purification.Reference Dalpian and Chelikowsky31 However, we can also explain our observations by considering the influence of the electric fields described in Fig. 2 on carrier recombination. Specifically, the electric field in the depletion region gives rise to a spatial separation of photogenerated carriers in thick NWs; electrons drift to the inner part of the wire, whereas holes accumulate and are trapped at the surface [Fig. 2(a)]. After illumination is switched off, electrons must overcome the barrier at the surface to recombine with trapped holes, under the assumption that recombination at the surface is the main recombination mechanism. Hence, a high PPC was measured [Fig. 1(c)] and is interpreted as a small probability to overcome the surface barrier. In contrast, thin NWs have a reduced surface barrier and therefore an enhanced surface electron–hole recombination [Fig. 1(d)], which explains the faster photoresponse and negligible PPC. The latter explanation makes use only of the depletion region induced by Fermi level pinning at the surface whose presence has been firmly established by the experiments depicted in Figs. 1(a) and 1(b) and whose consequences have to be taken into consideration for the interpretation of the data in Figs. 1(c) and 1(d). Therefore, there is no compelling reason to invoke self-purification as an explanation for PPC.
Our model excellently describes the unusual behavior of size-dependent photocurrents in GaN NWs and is thus experimental evidence that the Fermi level is pinned at M-plane GaN surfaces. The model provides three fitting parameters: the Fermi level pinning potential Φ B, the doping concentration, and a proportionality factor. The Fermi level pinning is assumed to be independent of the doping concentration and is found to be 0.55 eV below E C. Considering the general understanding of surfaces as outlined at the beginning of this section, the observation of Fermi level pinning at the NW sidewalls is not surprising. Nevertheless, its experimental verification is highly relevant because the resulting internal electric fields have multiple consequences, as discussed above and below. Later first-principles calculations of GaN NWs with M-plane sidewalls identified nitrogen vacancies located at the NW edges as the possible origin of the Fermi level pinning, and the position of the vacancy-related states is in good agreement with the experimental value reported here.Reference Carter and Stampfl32 However, it should be noted that the experimental result was obtained after exposure of the surfaces to air, while oxidation was not taken into account in the first-principles calculations.
In contrast to the Fermi level pinning, the surface depletion layer thickness and thus the critical diameter d crit depend on the doping concentration. Increasing the doping concentration reduces the surface depletion layer thickness of the NW and the critical diameter. For nominally undoped NWs, we extract with our model a doping concentration of 6.25 × 1017 cm−3 and d crit of 80 nm. Slightly doped NWs were also investigated, and a doping concentration of 1.8 × 1018 cm−3 and d crit of 50 nm were derived.Reference Richter, Lüth, Meijers, Calarco and Marso24 To obtain an independent evaluation of the carrier concentration, Raman measurements were performed on doped NWs and the obtained value agrees well with the electrical measurements.Reference Jeganathan, Debnath, Meijers, Stoica, Calarco, Grützmacher and Lüth33 Hence, we can conclude that these GaN NWs can successfully be doped by Si.Reference Stoica and Calarco34 Moreover, our model allows the quantitative evaluation of the carrier concentration in single NWs. This is an extremely important finding because the measurement of the NW carrier concentration is generally not straightforward and prone to large experimental uncertainties.
The model has been adopted and improved by Sanford et al.Reference Sanford, Blanchard, Bertness, Mansfield, Schlager, Sanders, Roshko, Burton and George35 for MBE-grown GaN NWs and by Simpkins et al.Reference Simpkins, Mastro, Eddy and Pehrsson36 for NWs grown by MOCVD using Ni as catalyst. The former group put effort also into the precise determination of the carrier concentration in undoped and intentionally n-type doped GaN NWs. To this end, they compared single NW field-effect transistor (FET) measurements and simple resistance measurements in the dark and under illumination. Their conclusion is that in the case of FET measurements, the results can be strongly influenced by the uncontrollable charge accumulation in surface states, which is not the case for the more reliable resistance measurements.Reference Mansfield, Bertness, Blanchard, Harvey, Sanders and Sanford37 To reduce the deleterious effect of surface states charging, Simpkins et al.Reference Simpkins, Mastro, Eddy and Pehrsson38 passivated their catalyst-induced NWs grown by MOCVD with silicon nitride and achieved a reduction in surface state density to a value of about 1.2 × 1011 cm−2/eV.
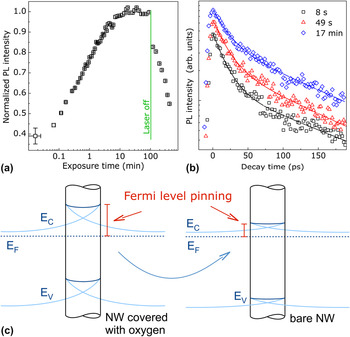
In the studies presented so far, electrical signals were detected and for such measurements it is clear that effects of the NW-specific electric fields induced by the surface (see Fig. 2) can be investigated. For PL experiments it may seem less obvious that these electric fields have any influence. In the following we will briefly discuss how they do affect the luminescence. In GaN of high material quality, the PL is dominated by the radiative recombination of excitons. Electric fields of about 10 kV/cm cause field and impact ionization of the excitons and thus reduce their radiative recombination rate, but the transition energy is not shifted.Reference Camacho, Santos, Alsina, Ramsteiner, Ploog, Cantarero, Obloh and Wagner39, Reference Pedrós, Takagaki, Ive, Ramsteiner, Brandt, Jahn, Ploog and Calle40 Such electric fields are present in the NWs that will be considered below. These NWs have an average diameter of about 40 nm and are fully depleted, as depicted in Fig. 2(c). If the strength of the electric field in the NWs changes, the PL intensity will be affected. The PL intensity is influenced by many different parameters including material quality and sample morphology, and that is why the results of a number of experiments have to be combined to reach conclusions with respect to the NW-specific electric fields.Reference Pfüller, Brandt, Grosse, Flissikowski, Chèze, Consonni, Geelhaar, Grahn and Riechert41 First, the PL intensity of a GaN NW ensemble in vacuum is measured as a function of the time that the sample is exposed to the exciting UV laser. As shown in Fig. 3(a), the PL intensity slowly increases by more than 100% and saturates after about 20 min. When the continuous exposure to UV light is stopped, the PL intensity decreases again. The same effect is observed independent of temperature but occurs only if the sample is in vacuum. When the cryostat is vented with air during continuous exposure, the PL intensity drops instantly, but venting with nitrogen does not cause any change. Therefore, the increase of the PL intensity is related to the photodesorption of oxygen from the GaN NWs. The photodesorption of oxygen from semiconductor surfaces is well known and is caused by charge transfer: photogenerated holes migrate to the surface and neutralize the negatively charged ionosorbed oxygen.
(a) Spectrally integrated photoluminescence (PL) intensity of GaN NWs as a function of time that the sample was exposed to the exciting UV laser, measured at 10 K in vacuum. After 90 min, the laser was switched off, and for all subsequent data points, the laser was switched on only for the time necessary to acquire the spectra. (b) Spectrally integrated PL transients measured after the indicated exposure times. (c) Schematic of the different electric fields in the GaN NWs before (left) and after (right) oxygen desorption. The desorption unpins the Fermi level at the NW sidewall surfaces, leading to a reduction of the electric field strength.

Obviously, the desorption of oxygen alters the NW surface. During all these experiments, the spectral positions of the dominant exciton transitions remain constant. Thus, the increase in PL intensity is not due to a change in the recombination channel but must be related to an enhancement in quantum efficiency, i.e., the ratio between radiative and the sum of radiative and non-radiative transitions. To elucidate the underlying mechanism, PL transients were recorded after different UV exposure times [see Fig. 3(b)]. For all the measurements, the decay is described by a biexponential function. The longer component of the decay time is about 140 ps and is independent of the exposure time (the faster relaxation mechanism is irrelevant for the present discussion as argued in more detail in Ref. Reference Pfüller, Brandt, Grosse, Flissikowski, Chèze, Consonni, Geelhaar, Grahn and Riechert41). This value is significantly shorter than the radiative lifetime in high quality GaN, and hence the recombination is dominated by non-radiative processes, i.e., the non-radiative lifetime is roughly equal to the experimentally determined effective lifetime. Since the latter does not change with exposure time, the increase in PL intensity is not caused by the reduction of non-radiative surface recombination due to oxygen desorption. Instead, the increase of the initial PL intensity at t = 0 shows directly that the radiative recombination rate is enhanced by oxygen desorption.
All the PL results can be perfectly explained in the framework of the electric fields depicted in Figs. 2 and 3(c). The increase in radiative recombination rate without a change in spectral position evidences that the quenching of the radiative excitonic recombination by the electric field is reduced by the desorption of oxygen. Since the field strength is determined only by the doping concentration and the Fermi level pinning at the surface, we conclude that oxygen desorption unpins the Fermi level. It is worth to note here that for this experiment a high intensity of the incident light is necessary. In contrast, for the photocurrent experiments shown in Fig. 1, low excitation is mandatory to avoid that photogenerated carriers significantly affect the potential.
Although we showed in the first part of the review how the NW-specific electric fields affect electrical measurements and that they can be influenced by doping, the optical investigation demonstrates that these fields can also be changed after growth by altering the NW surfaces. On the one hand, this phenomenon opens up additional possibilities to device design and functionality. On the other hand, one has to take into consideration that device properties may change with time if the NW surfaces are not properly passivated. An example of surface functionalization is given in Ref. Reference Dobrokhotov, McIlroy, Grant Norton, Abuzir, Yeh, Stevenson, Pouy, Bochenek, Cartwright, Wang, Dawson, Beaux and Bervena42 where the GaN NWs were coated using Au nanoparticles, which act as a Schottky all-around gate further depleting the NWs. The subsequent physisorption of gases onto the functionalized surface induces changes in the depletion depth of the NWs, in turn affecting their conductivity. This effect was used to sense both methane and nitrogen gas. Also, the same explanation was given for the hydrogen detection using Pd-coated GaN NWs.Reference Lim, Wright, Gila, Johnson, Ural, Anderson, Ren and Pearton43 In addition, the use of GaN NWs for the sensing of biomolecules is under investigation as well.Reference Simpkins, McCoy, Whitman and Pehrsson44–Reference Chen, Ganguly, Lu, Chen, Kuo, Chen, Tu, Fischer, Chen and Chen46
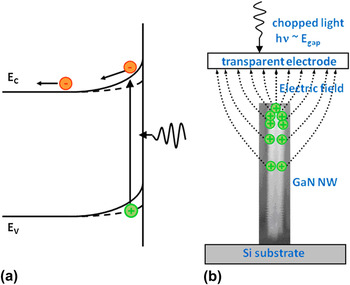
As already discussed, the existence of a lateral surface depletion region has a major influence on the electrical, photoelectrical, and optical properties of GaN NWs. A strong electric field (externally applied or internal) may also induce changes in the optical absorption of a semiconductor. In this respect, it is important to gain deeper information on the band-edge spectral region. Therefore, we applied the SPS technique.Reference Cavallini, Polenta, Rossi, Stoica, Calarco, Meijers, Richter and Lüth47 SPS is a noncontact, noninvasive, and nondestructive method and thus very suitable for probing samples containing the as-grown NW ensemble. In the SPS technique, the internal electric field separates the electrons and holes generated by light absorption. This modifies the surface potential and can induce an alternating current through a capacitively coupled transparent electrode if a pulsed illumination is used as shown in the schematic diagram in Fig. 4.
(a) Band bending and carrier redistribution in an n-type semiconductor under band gap light excitation. (b) Schematic experimental setup for surface photovoltage spectroscopy (SPS) measurements. The extension of the electric field is qualitatively depicted to show the role played by the lateral surfaces.

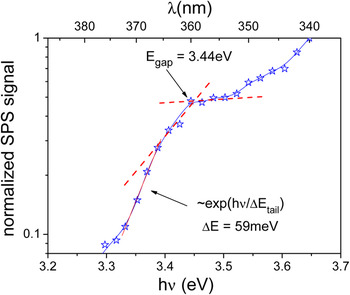
By varying the wavelength, a spectral dependence of the signal can be obtained. In our case, the investigated GaN samples consist of NWs on a Si substrate and the SPS measurements are performed on a large ensemble of these standing wires. We can imagine that for NWs not only the top surface of the wire but also the lateral surfaces contribute to the photovoltage signal (see Fig. 4). The contribution of the lateral surfaces might be dominant due to a reduced top surface area and the long-distance character of the electric field interaction. The measured signal is usually approximately proportional to the absorption coefficient and therefore this technique can also be used for the evaluation of the optical gap which should correspond to strain-relaxed GaN. We know from PL measured at low temperatures on both single wires and ensembles of wires that the wires are in a relaxed strain state.Reference Thillosen, Sebald, Hardtdegen, Meijers, Calarco, Montanari, Kaluza, Gutowski and Lüth48 If we plot the SPS curve on a logarithmic scale (Fig. 5), an exponential tail with a specific energy ΔE of 59 meV is observed. In fact, sub-bandgap absorption is usually observed in SPS measurements and the position of the knee in the curve is taken as the bandgap value. Indeed, the value of this energy corresponds to 3.44 eV, the room temperature optical gap of relaxed GaN.
Logarithmic display of the SPS spectrum of a GaN NW ensemble. The exponential fit of SPS spectra gives the specific energy of the absorption tail.

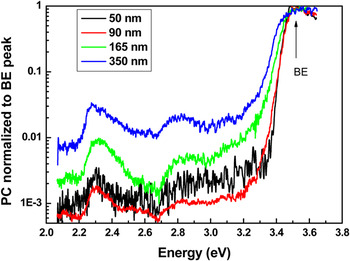
The presence of a band-edge absorption tail was also confirmed by SPC measurements.Reference Cavallini, Polenta, Rossi, Stoica, Calarco, Meijers, Richter and Lüth47 The photocurrent measurements were performed on single wire devices, which enabled us to obtain the dependence of the absorption tail on the wire diameter. It is observed that thicker wires show more extended band tail absorption (see Fig. 6).
Normalized SPC spectra of NWs with diameters ranging from 50 to 350 nm, measured at room temperature. The photoconductivity signal is normalized to the band-edge peak intensity.

For surface photovoltage measurements, the Franz-Keldysh photoabsorption effect or sub-band absorption induced by a surface electric field is usually invoked as the possible origin for an absorption tail. Excitonic, phononic, and plasmonic effects broadened at room temperature could also be responsible. Structural disorder can also induce an absorption tail, but for the observed tails with specific energy of about 40 meV, the disorder should be almost as strong as in amorphous semiconductors. In contrast, high-resolution transmission electron microscopy investigations show a perfect crystalline structure along the wires.Reference Stoica, Sutter, Meijers, Debnath, Calarco, Lüth and Grützmacher49 High doping, another possible explanation, can be excluded as well; the free carrier density was evaluated to be less than 7 × 1017 cm−3.Reference Calarco, Marso, Richter, Aykanat, Meijers, Hart, Stoica and Lüth23 We can therefore consider the Franz-Keldysh effect with a strong influence of the excitonic Coulomb interaction as the most probable explanation of the optical absorption band tails in GaN NWs. The specific energy of the Franz-Keldysh absorption tail, which corresponds to the surface electric field of the band-bending model presented in Fig. 4, fits well with the experimental band tail energy as function of diameter.Reference Cavallini, Polenta, Rossi, Stoica, Calarco, Meijers, Richter and Lüth47 The dominance of the Franz-Keldysh effect provides further evidence for the strong influence of the surface on NW properties.
Similarly, Armstrong et al.Reference Armstrong, Li, Bogart, Lin, Wang and Talin50, Reference Armstrong, Li, Lin, Talin and Wang51 observed for catalyst-induced GaN NWs that the onset of the photocurrent is shifted to lower energy than the bandgap. These authors proposed an alternative explanation and attributed the energy shift to photoemission from a discrete deep bandgap state.
The SPC spectra in Fig. 6 show, besides the bandgap-related transition, deep levels corresponding to the yellow at about 2.30 eV, green at 2.52 eV, and blue bands at 2.85 eV.Reference Cavallini, Polenta, Rossi, Richter, Marso, Meijers, Calarco and Lüth52 A clear increase of the defect-induced SPC signal with increasing wire diameter is observed in the SPC curves of Fig. 6. An obvious explanation for this trend may seemingly be simply a lower concentration of defects in thin NWs, as also discussed in relation to the PPC data [Figs. 1(c) and 1(d)]. However, to properly understand the origin of such a size dependence one has to take into consideration different generation–recombination mechanisms for band-to-band and sub-band gap transitions. For both transitions and under uniform photogeneration intensity G, the total generation in a NW is proportional to the volume ∼d 2G, while the diameter dependence of the recombination is different for localized levels and band-to-band transitions.
As discussed above within the frame of the surface band-bending model, the recombination in band-to-band excitation is dominated by recombination at the surface (mobile holes drift to the NW surface and electrons have to overcome the surface potential barrier for recombination). In this case, the recombination probability is proportional to the NW surface and has a linear dependence on diameter ∼dS r, where S r is the surface recombination coefficient. Thus, the band-to-band photocurrent is given by the ratio of the total carrier generation and recombination probability:

In defect-assisted PC, holes are generated on localized states and cannot drift to the surface. As result, both generation and recombination take place in the NW core and PC is proportional to the volume of the NW core and to the localized state density. If we approximate the diameter of the core, which contributes to the defect-assisted photocurrent (PC def), to the NW diameter and suppose a constant recombination probability for the localized states in the core, then PC def ∼ d 2. As a consequence PC def/PC BB ∼ d, which approximately describes the experimental result. A more accurate fit of the diameter dependence of the normalized defect-assisted photocurrent is given in Ref. Reference Polenta, Cavallini, Rossi, Calarco, Marso, Stoica, Meijers, Richter and Lüth53. Once again, the experimental results can be explained by properly taking into account the surface-induced electric fields and their influence on carrier recombination. Thus, the data in Fig. 6 do not provide conclusive evidence for self-purification. Therefore, caution has to be applied in the interpretation of experimental data taken from NWs because surface-induced effects may have more complex consequences than naively expected.
The surface versus bulk nature of defects has also been investigated by other groups. Armstrong et al.Reference Armstrong, Li, Bogart, Lin, Wang and Talin50 observed in catalyst-induced GaN NWs a deep level state at E c − 3.19 eV and assigned it bulk character due to its similarity to previously found GaN bulk defects. In the same work, another deep level was detected at E c − 2.81 eV and related to a carbon-related defect also observed in GaN:C thin films. The same authors further investigated the subject by comparing simple GaN and GaN/(Al,Ga)N core–shell NWs and assigned a surface character to the level found at E v + 2.6 eV.Reference Armstrong, Li, Lin, Talin and Wang51 In fact, the lack of the aforementioned state in the core–shell NWs was attributed to the chemical passivation of the GaN NW surface states. This surface passivation was indeed successful as it efficiently suppressed unoccupied surface states, which may lead after physisorption to a shift of the surface E F.
III. DOPANTS
The second overall topic of this review is the effect of the NW surfaces on dopants. Although the charge carriers associated with doping are typically probed by transport measurements, such experiments cannot access the depletion zone. Thus, any changes in the properties of dopants close to the surface are invisible to transport studies. Here, we measure the PL of single GaN NWs at low temperature.Reference Brandt, Pfüller, Chèze, Geelhaar and Riechert54, Reference Pfüller, Brandt, Flissikowski, Chèze, Geelhaar, Grahn and Riechert55 The sensitivity of PL spectroscopy to impurities in semiconductors is unsurpassed by any other technique. Although it is difficult to extract absolute concentrations, energy levels can be determined with very high precision.
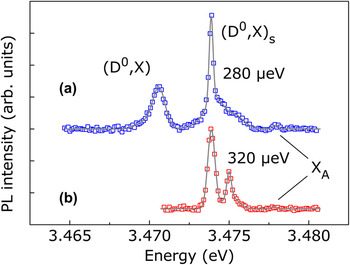
The NW samples under investigation are nominally undoped, and consequently a low unintentional concentration of donors is expected, mostly due to Si and O impurities. Figure 7(a) displays the PL spectrum in the near-band-edge region of a single GaN NW that was dispersed on a Si carrier substrate. The donor-bound exciton (D0,X A) at 3.472 eV and the free A exciton X A at 3.479 eV are easily identified. The spectrum is dominated by the transition at 3.475 eV, and this line is remarkably sharp. In fact, the extracted linewidth of 280 μeV is limited by the resolution of the spectrometer. Most importantly, in this energy range strong transitions are unknown for bulk or unstrained layered GaN. In other single NWs, significant emission is also observed in the spectral range between donor-bound and free exciton, but with peaks at slightly different positions. A detailed analysis of possible transitions and energy shifts leads to the conclusion that these lines are caused by excitons bound to donors located close to the surface.Reference Brandt, Pfüller, Chèze, Geelhaar and Riechert54 Simple theoretical considerations predict that the ionization energy of impurities is reduced in the vicinity of the surface.Reference Levine56 The main reason for this phenomenon is the change of electrostatic potential that the bound charge carrier experiences close to the surface. It should be noted that the dielectric mismatch increases the ionization energy in thin NWs (less than 10 nm, depending on the NW material). However, for a given NW diameter, the ionization energy close to the surface is always decreased.Reference Diarra, Niquet, Delerue and Allan57 Since a reduced donor ionization energy leads to a smaller exciton binding energy and thus to a blueshift in the PL spectrum compared to the bulk-like donor-bound exciton, our experimental results verify this effect in GaN NWs. Therefore, we demonstrate that in self-induced GaN NWs, surface effects induce a reduction of the ionization energy for donors located near the surface.
μPL spectra of a single NW acquired at 10 K (a) directly after and (b) 1 month after dispersion on a Si(111) carrier substrate. The background was subtracted to show the peaks more clearly. The symbols represent the data, and the solid lines are Gaussian fits.

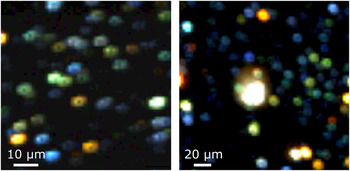
The presence of surface donor-bound excitons was evidenced in single-dispersed NWs.Reference Brandt, Pfüller, Chèze, Geelhaar and Riechert54 However, the spectra of the majority of dispersed NWs are significantly broadened due to inhomogeneous strain that results from interaction with the carrier substrate. Hence, such experiments do not allow to ascertain the statistical relevance of the surface-induced energy shift. To probe a large number of single strain-free NWs, we acquired PL area maps of as-grown samples for which the mean distance between neighboring free-standing NWs is greater than 1 μm.Reference Pfüller, Brandt, Flissikowski, Chèze, Geelhaar, Grahn and Riechert55 This large nearest-neighbor distance is found close to the edge of the wafer and is attributed to a locally very high substrate temperature during growth. For the same reason, the average NW diameter is only 30 nm. The PL intensity maps are presented in Fig. 8. The spots correspond to single NWs, and the color of each pixel indicates the energy range of the dominant transition line at this location: bulk-like donor-bound (red/orange), surface donor-bound (green), and free (blue) exciton. Yellow and white pixels represent spectra with multiple strong lines, but there are only very few such NWs. Obviously, on both samples there is a significant number of green spots. Therefore, the occurrence of surface donor-bound excitons is not an exception but rather common. In other words, in the NWs under investigation a significant number of donors is located so close to the surface that their ionization energy is changed.
μPL intensity area maps of as-grown free-standing GaN NWs on Si(100) (left) and Si(111) (right). The color of each pixel indicates the dominant transition of the spectrum acquired at that location: red/orange for bulk-like donor-bound excitons, green for surface donor-bound excitons, and blue for free excitons. The large white spot in the center of the right-hand map is caused by unintentionally dispersed NWs and is excluded from further analysis.

One consequence of this phenomenon is that in PL measurements of NW ensembles the width of the donor-bound exciton line is at least 1 meV or even largerReference Geelhaar, Chèze, Jenichen, Brandt, Pfüller, Münch, Rothemund, Reitzenstein, Forchel, Kehagias, Komninou, Dimitrakopulos, Karakostas, Lari, Chalker, Gass and Riechert15 because many donors are probed that are located in a range of distances to the NW surfaces. This value for the linewidth is at least one order of magnitude larger than what is expected for strain-free material as found in NWs. Corfdir et al.Reference Corfdir, Lefebvre, Ristić, Valvin, Calleja, Trampert, Ganière and Deveaud-Plédran58 were the first to explain this discrepancy by the effect of the surface on the transition energy of donor-bound excitons. In addition, these authors argued on the basis of time-resolved PL measurements that surface effects strongly enhance the relative intensity of the two-electron satellite of the donor-bound exciton transition, giving rise to the PL line at 3.45 eV that is commonly found in MBE-grown GaN NWs. However, it should be noted that there are also other explanations for that line.Reference Geelhaar, Chèze, Jenichen, Brandt, Pfüller, Münch, Rothemund, Reitzenstein, Forchel, Kehagias, Komninou, Dimitrakopulos, Karakostas, Lari, Chalker, Gass and Riechert15
So far our conclusions have been based on the spectral positions of transition lines, and we learned how the NW surface affects the properties of single dopants. Now, we consider the quantitative analysis of the PL area maps to address the question of dopant incorporation and their spatial distribution. To this end, we focus on the NWs whose emission is dominated by free excitons, i.e., the blue spots in Fig. 8. The detailed analysis of the NW size and the excitation conditions reveals that these NWs most likely do not contain any donors at all.Reference Pfüller, Brandt, Flissikowski, Chèze, Geelhaar, Grahn and Riechert55 On both PL maps, about 25% of all NWs are donor free. At the nanoscale and in the limit of small numbers, the distribution of donors in NWs is described by Poissonian statistics. For the given NW size, the experimentally determined fraction of donor-free NWs corresponds to an unintentional doping concentration of (6–8) × 1015 cm−3, which is comparatively low for GaN. The doping concentrations extracted from the photocurrent measurements described above are significantly higher. However, one has to take into consideration that the sample characterized by PL was grown at higher temperature, which is consistent with the very low doping concentration. Even lower values down to 5 × 1014 cm−3 were recently reported for similar NWs.Reference Sanford, Blanchard, Bertness, Mansfield, Schlager, Sanders, Roshko, Burton and George35 In contrast, in common GaN layers, the impurity concentration is usually >1016 cm−3. The reduced impurity concentration in NWs is in accord with theoretical predictions that in Si NWs impurities segregate at the surface,Reference Fernández-Serra, Adessi and Blasé59 a phenomenon which is known for nanocrystals as “self-purification.”Reference Dalpian and Chelikowsky31
There are additional indications that self-purification is a relevant effect for self-induced GaN NWs. First, if grown under optimized conditions they do not emit any yellow luminescence, a common problem for GaN layers that is caused by point defects. Second, independently of the type of nitrogen plasma source used for growth, the NW PL intensity is always very high. In contrast, the PL intensity of GaN layers grown by plasma-assisted MBE is prone to ion damage from certain plasma sources. Third, even at room temperature the PL spectra of single NWs evolve with time. This effect is demonstrated by the comparison of the two spectra shown in Fig. 7. Spectrum (b) was acquired on the same NW but 1 month later than spectrum (a). This observation is easily understood in the framework of our above findings: The changes in spectral position and intensity of the bulk and surface donor-bound excitons imply that the spatial distribution of donors with respect to the surfaces varies with time. In other words, donors diffuse and/or segregate. If this phenomenon can occur at room temperature, it is even more likely at growth temperature. All these results strongly suggest that donors in catalyst-free GaN NWs segregate during growth to the surface.
Corresponding observations have also been made for catalyst-induced GaN NWs. In particular, Wang and Li investigated the defect-related cathodoluminescence in such NWs.Reference Li and Wang60 Strong yellow luminescence, characteristic for common defects in GaN, was detected at the sidewall surfaces but was much weaker in the NW bulk. The thickness of the surface region emitting strong yellow luminescence depends roughly linearly on the NW diameter but is much thinner than what is expected for defect incorporation during NW sidewall growth. The authors therefore tentatively ascribed this nonuniform distribution of defects to their possible diffusion toward the NW sidewall surfaces during growth, i.e., self-purification. Last, while we are not aware of any theoretical investigations that address the possibility of dopant segregation in GaN NWs, first-principles calculations did find that the formation energy of native defects (vacancies, antisites, and interstitials) is lower at the surface of GaN NWs than in the core.Reference Carter and Stampfl32, Reference Wang, Li, Gao and Weber61
As a consequence of self-purification, the spatial donor distribution within GaN NWs is not homogeneous and the concentration is lower than in planar layers. Although our experimental data were acquired for unintentionally doped NWs with very low impurity concentration, the same surface effect is likely to occur for intentional doping. This finding is important for applications because control over charge carrier concentration is an essential prerequisite for the design of devices.
IV. CONCLUSIONS
We have experimentally demonstrated that the Fermi level is pinned at M-plane GaN surfaces 0.55 eV below the conduction band minimum. For GaN NWs, this effect results in electric fields perpendicular to the NW axis whose strength depends on the NW diameter and doping level. Our model for the diameter dependence of the photocurrent allows to quantitatively determine the carrier concentration in the NWs. The Fermi level pinning at the NW sidewall surfaces depends on the oxidation state of the GaN surface and can be modified by UV illumination. The correct interpretation of electrical and optical experiments necessitates taking into account the internal electric fields induced by surface effects. In particular, these electric fields lead to light absorption below the bandgap via the Franz-Keldysh effect.
With respect to doping we have shown that the ionization energy of donors located close to the NW surface is reduced, which results in a decreased exciton binding energy. Nominally undoped NWs may contain zero or very few donors. Several of the experimental results would be consistent with a segregation of donors to the surface, but there are also alternative explanations.
For device design a consequence of paramount importance is that NWs with a diameter below a critical value are fully depleted and thus insulating. Surface passivation appears to be essential to ensure the long-term stability of devices. At the same time, surface-induced effects can be used profitably in sensing applications.
ACKNOWLEDGMENTS
We thank all the coauthors of our own papers reviewed in this work, and in particular C. Pfüller for helping with the figures. We acknowledge U. Jahn for the careful and critical reading of the manuscript. Our own research reviewed here has been partially supported by the EU Marie Curie Research Training Network “Interfacial Phenomena at Atomic Resolution and multiscale properties of novel III-V SEMiconductors” (PARSEM) under Grant MRTN-CT-2004-005583 and through the Information Society Technologies project “Nanowire-based One-Dimensional Electronics” (NODE) under Grant 015783 as well as by the German Federal Ministry of Education and Research joint research project “MONALISA - Epitaxie von monolithisch-integrierten III-V Materialien auf Silizium als Lichtemitter” (Contract No. 01BL0810).