Introduction
Following the Cairo Conference in 1994 and the Millennium Declaration in 2000, improvement in reproductive and child health services was placed at the forefront of the global, national and regional development agenda to improve demographic outcomes in developing countries. Programmatic attention on increasing antenatal care (ANC), medical assistance at birth and child immunization has been emphasized to improve child survival, reduce maternal mortality and increase the use of contraception (Shen & Williamson, Reference Shen and Williamson1999; Kristensen et al., Reference Kristensen, Aaby and Jensen2000; Bairagi & Datta, Reference Bairagi and Datta2001; Seltzer, Reference Seltzer2002; Koblinsky, Reference Koblinsky2003; Breiman et al., Reference Breiman, Streatfield, Phelan, Shifa, Rashid and Yunus2004; Angeles et al., Reference Angeles, Guilkey and Mroz2004; Liu & Becker et al., Reference Liu and Becker2008; Singh & Darroch et al., 2009; Stover & Ross, Reference Stover and Ross2010). In the last two decades, there has been significant progress in achieving demographic and health-related goals in developing countries; the under-five mortality rate declined from 100 (per 1000 live births) in 1990 to 50 in 2013 (UNICEF, 2014) and the maternal mortality ratio declined from 430 (per 100,000) to 230 live births (WHO et al., 2013) over the same period. Despite this progress, the global and national pattern in demographic trends are uneven and divergent (Watkins, Reference Watkins1990; Wilson, Reference Wilson2001; Franklin, Reference Franklin2002; Reher, Reference Reher2004; Dorius, Reference Dorius2008, Reference Dorius2010; Lanzieri, Reference Lanzieri2010; Lee & Reher, Reference Lee and Reher2011).
The national pattern in demographic trends conceals large disparities across regions and among socioeconomic groups (Alagarajan & Kulkarni, Reference Alagarajan and Kulkarni1998, Reference Alagarajan and Kulkarni2008; Franklin, Reference Franklin2002; Alagarajan, Reference Alagarajan2003; Bongaarts, Reference Bongaarts2003; James & Nair, Reference James and Nair2005). India, with 17% of the global population, accounts for one-fifth of under-five and maternal mortality. Though the Total Fertility Rate (TFR) is nearing replacement level in the country, the demographic trends among the states and districts are diverging (Arokiasamy & Goli, Reference Arokiasamy and Goli2012; Mohanty et al., Reference Mohanty, Fink, Chauhan and Canning2016). The state of Uttar Pradesh, which accounts for 17% of India’s population, is improving its demographic targets, but at a slow pace. The global effort in achieving health-related millennium goals and demographic convergence in India is contingent on the progress in the state of Uttar Pradesh, as it accounts for more than one-fifth of all maternal and child deaths in the country.
Efforts to improve Reproductive and Child Health (RCH) services in India were intensified during the last decade. The Government of India launched the National Rural Health Mission (NRHM) to improve RCH services in the country. The NRHM (later known as the National Health Mission), the largest flagship programme of the Government of India, covered the entire country. Its prime goal was to reduce infant, child and maternal mortality through promoting newborn care, immunization, antenatal care, institutional delivery and post-partum care. The interface between the community and the public health system at the village level was entrusted to a female Accredited Social Health Activist (ASHA), a health volunteer receiving performance-based compensation for the promotion of universal immunization, referral and escort services for RCH, the construction of household toilets and other health care schemes. To promote institutional delivery, a cash incentive programme under the Janani Suraksha Yojana (JSY) scheme was made an integral component of NRHM. Studies maintain that NRHM has had a positive impact on service delivery (Mohanty & Srivastava, Reference Mohanty and Srivastava2012).
The state of Uttar Pradesh, due to its population size, low level of development and low utilization of RCH services, has been given high priority. During 2001–11, the state had an annual population growth rate of 2.01% compared with the national average of 1.7%. The TFR in the state remained high but declined by 30% in the post-NRHM period, from 4.4 in 2002 to 3.1 in 2013. On the other hand, the Infant Mortality Rate (IMR) declined by 38% (from 80 in 2002 to 50 in 2013) and the Under-Five Mortality Rate (U5MR) was estimated at 64 in 2013 (Registrar General of India, 2003, 2014). There has been a spectacular increase in RCH services; institutional delivery increased from 9% in 2002 to 58% in 2013 (Registrar General of India, 2003, 2014). There has been an increase in the use of modern methods of contraception, from 26% in 2004 to 37% in 2013 (IIPS, 2002–04; Registrar General of India, 2012–13). Though access to RCH services is crucial for improved child survival and increased contraceptive use, the spread of these services often accompanies other important social, economic and institutional changes that affect fertility behaviour (Bhat, Reference Bhat1996; Mason, Reference Mason1997).
The state average in demographic and RCH services conceals large disparities across the districts of Uttar Pradesh. As of 2011, there were 71 districts with an average population of 2.8 million and varying demographic and health outcomes. Inter-district variations in demographic parameters are large. Studies have often been confined to state-level differentials and less is known about the inter-district variations within the state. In this context, this paper attempts to understand the inter-district variations in RCH services and their effects on fertility and mortality in the districts of Uttar Pradesh.
Methods
Data
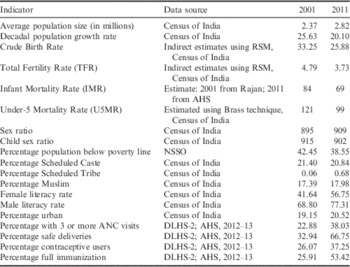
Study data were from multiple sources: the 2012–13 Annual Health Survey (AHS), the second round of District Level Household Surveys (DLHS-2) in 2002–04, the Census of India and the Sample Registration System (SRS). A brief description of the variables used, data sources and their mean values are presented in Table 1. The AHS was conducted during 2010–13 by the Registrar General of India to provide the key indicators in 284 districts belonging to the nine Backward States of India (Assam, Bihar, Jharkhand, Uttar Pradesh, Uttarakhand, Madhya Pradesh, Chhattisgarh, Orissa and Rajasthan). The sample size covered under AHS was sufficiently large and estimates were provided on access to maternal, child health and family planning services, access to health care for identified morbidities and the prevalence of disabilities, injuries and acute and chronic illnesses. Percentage of ever-married women aged 15–49 who received three or more ANC visits, percentage of women who had safe delivery, percentage of children aged 12–23 months fully immunized and percentage of currently married women using any modern contraceptive method for 2012–13 were taken from the AHS (Registrar General of India, 2012–13). The sampling methods and survey results are described elsewhere (Registrar General of India, 2010–11).
Data sources and descriptive statistics of demographic, socioeconomic and health indicators in districts of Uttar Pradesh
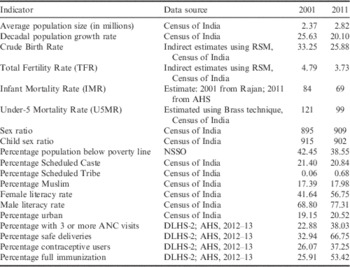
AHS, Annual Health Survey; DLHS-2, District Level Household Survey 2002–04; NSSO, National Sample Organization; RMS, Reverse Survival Method.
The DLHS is the largest ever Demographic and Health Survey in India and DLHS-2 is the second in the series (preceded by DLHS-1 in 1998–99), which covered 593 districts in 2002–04. In Uttar Pradesh, the DLHS-2 covered 72,050 households and 64,207 women. It provides comprehensive information on antenatal, natal and postnatal care, immunization, contraception, living conditions of household, health infrastructure and other information like the effectiveness of Accredited Social Health Activists (ASHA) and Janani Suraksha Yojana (JSY) in promoting RCH care. The survey methodology and findings are available elsewhere (IIPS, 2002–04). The same set of RCH indicators for the pre-NRHM period were taken from DLHS-2 and these estimates were taken as baseline estimates.
The TFR estimates were derived from the number of children under seven years of age from the 2001 and 2011 Censuses of India. The children ever-born and children surviving were used to provide estimates of under-five mortality at the district level using the MORTPAK software package. The infant mortality rates were borrowed from Irudaya Rajan’s estimates for 2001, and from the AHS report for 2011 (Rajan et al., Reference Rajan, Nair, Sheela, Jagatdev and Mishra2008; Registrar General of India, 2010–11). The district is the unit of analysis and the estimates were either borrowed or computed at the district level.
Analyses
Descriptive statistics, construction of composite indices, estimation of U5MR using the United Nations Palloni–Heligman method, estimation of TFR using the Reverse Survival Method (RSM) and a set of regression models were used in the analyses. A brief description of some of these methods is given below.
Construction of the RCH Index
A composite index on RCH was constructed using four RCH indicators: three or more ANC visits, safe delivery, full immunization and contraceptive use. ‘Three or more ANC visits’ was defined as the percentage of currently married women having at least three ANC check-ups during the last pregnancy. Safe delivery was defined as the percentage of women having institutional delivery or home delivery assisted by skilled persons during child birth. Full immunization was defined as the percentage of children aged 12–23 months who received one dose of BCG, three DPT injections, three doses of Polio vaccine and one dose of Measles vaccine, while currently married women using any modern contraceptive method were defined as ‘contraceptive users’.
For constructing the composite index, each RCH indicator was converted into a dimensional index and then a geometric mean of dimensional indices was obtained to arrive at the composite index. The dimensional indices were normalized as ‘0’ or ‘1’. The dimensional index was computed using the following formula:
 $${\rm Dimensional}\,{\rm index}\,{\rm {\equals}}\,{{Actual\, value\,{\minus}\,Minimum\, value} \over {Maximum \,value\,{\minus}\,Minimum \,value}}$$
where the minimum value of each indicator was taken as 0, the maximum value of ANC, safe delivery and full immunization was taken as 100, while for contraceptive use, it was taken as 80. The composite index depicts the overall level of RCH services in the districts of Uttar Pradesh and is linked to TFR, IMR and U5MR.
Estimation of the TFR
The TFR was derived from the Crude Birth Rate (CBR) and the CBR was estimated using the Reverse Survival Method (RSM). The basic inputs used for RSM were 0–6 year population, mid-year population and the survival ratio. The figures for the population in the 0–6 year age group were obtained from the Census of India and those of the mid-year population were computed using the inter-censal growth rate of each district. To obtain the survival ratio of the 0–6 population, the under-five mortality and survival ratios were regressed at the state level for 2008 using SRS data and it was found that the coefficients were stable over time. To estimate the TFR at the district level, the CBR was regressed with TFR at the state level for a period of 30 years (1981–2010) and the coefficient was used at the district level. While Bhat (Reference Bhat1996) used a log-linear regression of TFR and CBR for seventeen states, it was found that the regression without intercept fitted better.
Regression analysis
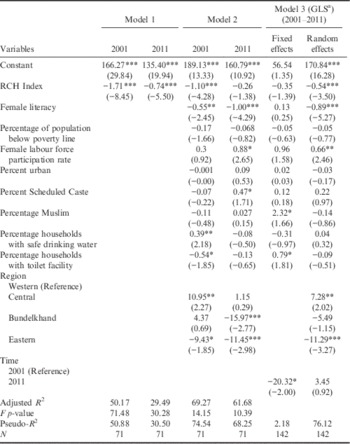
A set of econometric models was used to understand the effect of RCH services on TFR, IMR and U5MR (dependent variables). In the first model, each dependent variable was regressed against the RCH Index to understand the role of RCH in explaining variations in dependent variables. In the second model, the TFR was regressed against the RCH Index, female literacy, percentage of population below poverty line, female labour force participation rate, percentage of urban population, percentage of Scheduled Caste population, percentage of Muslim population and four regional dummies. In the third model, fixed- and random-effects models were used on the same set of variables used in Model 2. The regression equations used were in the form:
 $$Y_{{dt}} \,{\equals}\,\alpha _{d} \,{\plus}\,\beta {\rm }\,{\rm RCH}_{{dt}} \,{\plus}\,e_{{dt}} $$
 $$Y_{{dt}} \,{\equals}\,\alpha _{d} \,{\plus}\,\beta {\rm }\,X_{{dt}} \,{\plus}\,e_{{dt}} $$
 $$Y_{{dt}} \,{\equals}\,\alpha _{d} \,{\plus}\,\beta \,{\rm }X_{{dt}} \,{\plus}\,Z_{t} \,{\plus}\,e_{{dt}} $$
where Y dt is a dependent variable, i.e. TFR, IMR or U5MR, in district d at time t, RCH dt is the RCH Index in district d at time t, X dt is the vector of explanatory variables other than the RCH Index, Z t is the time dummy variable and e dt is the error term.
Along with cross-sectional and panel regression, three regression models – that is, difference-in-difference, difference and base value and hybrid models – were also analysed. The difference-in-differences panel model is given as:
 $$\Delta Y\,{\equals}\,\alpha \,{\plus}\,\beta _{1} \,\Delta {\rm FLit}\,{\plus}\,\beta _{2} {\rm \Delta BPL}\,{\plus}\,\beta _{3} \,{\rm \Delta FLPR}\,{\plus}\,\beta _{4} \,{\rm \Delta RCH}\,{\plus}\,{\varepsilon}_{i} $$
The difference and base value model is given as:
 $$\eqalignno {\Delta Y_{d} \,{\equals}\, & \alpha \,{\plus}\,\beta _{{1\,}} Y_{{d,2001}} \,{\plus}\,\beta _{2} \,{\rm FLit}_{{d,2001}} \,{\plus}\,\beta _{3} \,{\rm BPL}_{{d,2001}} \cr & \,{\plus}\,\beta _{4} \,{\rm FLPR}_{{d2001}} \,{\plus}\,\beta _{5} {\rm RCH}_{{d2001}} {\plus}{\varepsilon}_{i} $$
The hybrid model includes both initial values as well as change values and is given as:
 $$\eqalignno {\Delta Y_{d} \,{\equals}\, & \alpha \,{\plus}\,\beta _{1} \,Y_{{d,2001}} \,{\plus}\,\beta _{2} \,{\rm FLit}_{{d,2001}} \,{\plus}\,\beta _{3} \,{\rm BPL}_{{d,2001}} \,{\plus}\beta _{4} \,{\rm FLPR}_{{d,2001}} \cr & \,{\plus}\,\beta _{5} \,{\rm RCH}_{{d,2001}} \,{\plus}\, \beta _{6} \,\Delta {\rm FLit}\,{\plus}\,\beta _{7} \,{\rm \Delta BPL}\,{\plus}\,\beta _{8} \,{\rm \Delta FLPR}\,{\plus}\,\beta _{9} \,{\rm \Delta RCH}\,{\plus}\,{\varepsilon}_{i} $$
where Δ stand for changes in indicators during 2001–11, β 1, β 2, …β 8 are regression coefficients, ε i is an error term, Y d is a dependent variable in district d, BPL d,2001 is the percentage of population below poverty line, FLit d,2001 is the female literacy rate in district d in 2001, FLPR is the female labour force participation rate and RCH is the RCH Index in district d.
Results
Table 1 presents the data source along with descriptive statistics of the selected demographic, socioeconomic and health indicators in the districts of Uttar Pradesh. The mean population size of the districts increased from 2.37 million in 2001 to 2.82 million in 2011, while the decadal population growth rate declined from 25.63 to 20.10 during the same period. The TFR declined by more than one birth per woman over the decade. The mean U5MR and IMR declined by one-fifth suggesting little improvement in child survival. Though the percentage of population living below the poverty line declined over time, more than one-third of the population in the state were living below the poverty line in 2011. There was remarkable progress in female literacy from 41.64% in 2001 to 56.75% in 2011. Over the decade, the percentage of women who had gone for three or more ANC visits increased by 65%. The percentage of women who had a safe delivery and the percentage of children fully immunized almost doubled during 2001–11. However, the increase in modern contraceptive use was slow in the state.
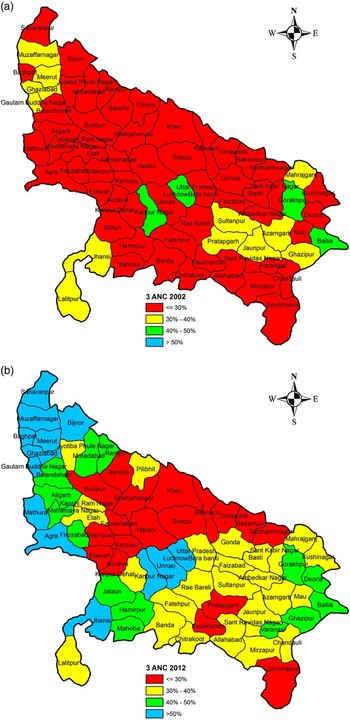
Antenatal care use by mothers in Uttar Pradesh increased from 26.4% in 2002–04 to 37.8% in 2012–13. Figure 1(a) and (b) presents ANC use in 2002–04 and 2012–13, respectively, for 71 districts in Uttar Pradesh. Large variation in coverage of ANC care was observed in the districts. By 2012–13, ANC coverage was highest in Lucknow followed by Ballia, and lowest in Kaushambi preceded by Shrawasti. The coefficient of variation for three or more ANC visits among the districts was 41% in 2002 and 29% in 2013. The coverage of ANC was low in many of the districts in 2002–04: nearly 55 of the 71 districts had ANC coverage of less than 30%, and even in 2012–13 the ANC coverage in eighteen districts was lower than 30%. The districts with low ANC were largely in the western and eastern regions of the state. During 2002–13, 31 of the 71 districts recorded a more than 80% increase in ANC coverage, fifteen recorded an increase of 50–80%, thirteen an increase of 20–50% and eight an increase of 10–20%. Four districts (Pratapgarh, Kheri, Etawah and Ballia) recorded a marginal decline in ANC coverage. Thus it is clear that the level of, and changes in, ANC coverage varies greatly across the districts of Uttar Pradesh.
Map of Uttar Pradesh showing the levels of ‘three or more ANC visits’ in the districts during (a) 2002–04 and (b) 2012–13.

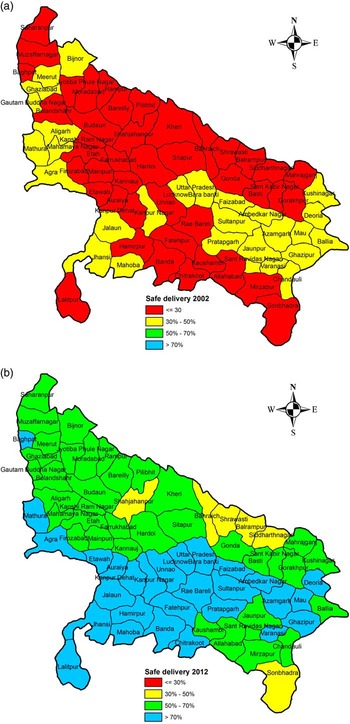
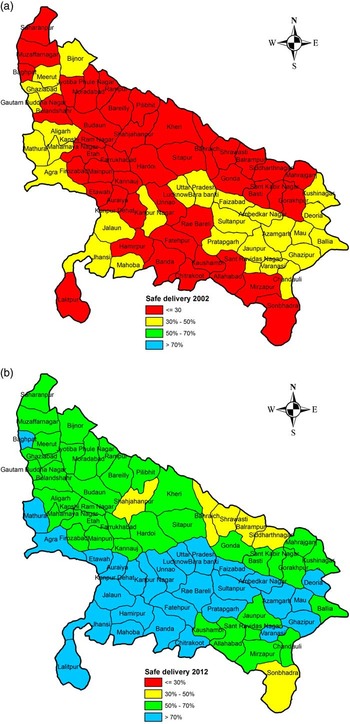
Safe delivery has been used as a key strategy to reduce infant and maternal mortality and improve postnatal services. The NRHM had put special emphasis on increasing safe delivery by addressing the constraints in supply and demand, including cash incentives. Safe delivery in the state increased from 28.7% in 2002–04 to 63.3% in 2012–13. An increase in safe delivery was recorded in most districts (Fig. 2). In 2012–13, safe delivery was highest in Jhansi district (90.8%) and lowest in Balrampur district (39%). The coefficient of variation in safe delivery among districts was 33% in 2002 and 16% in 2013. By 2012–13, among 71 districts, thirteen recorded a more than three-fold increase in safe delivery, 39 a two- to three-fold increase and seventeen recorded a one- to two-fold increase in the coverage of safe delivery. Compared with ANC, the increase in safe delivery was faster in most of the districts of Uttar Pradesh. Though the coverage of safe delivery has increased in most districts, large inter-district variations remain. It appears that programme emphasis has been more on increasing delivery at health centres compared with antenatal or postnatal care.
Map of Uttar Pradesh showing the levels of ‘safe delivery’ in the districts during (a) 2002–04 and (b) 2012–13.
The full immunization of children is a composite variable that includes one dose of BCG, three DPT injections, three doses of Polio and one dose of Measles vaccine, which protect children from childhood mortality and morbidity. Immunization coverage has improved significantly over time. Most districts that were at a lower level of immunization coverage during the base year recorded a significant increase in immunization coverage. The district of Deoria had highest immunization coverage in 2002–04 (55%) and recorded a 20% increase from 2002 to 2013. Among all districts, ten recorded a more than three-fold increase in immunization, 29 recorded a two- to three-fold increase and 32 a one- to two-fold increase; and it must be mentioned that none of the districts recorded a decline in immunization coverage.
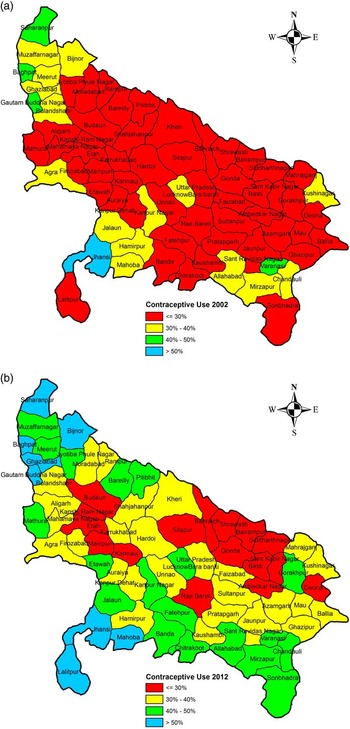
Contraceptive use is the key proximate determinant of fertility change. Current use of contraception in Uttar Pradesh increased from 35.6% in 2002–04 to 59% in 2012–13, while current use of modern methods increased from 26.2% to 36.7% over the same period. The large increase in the use of traditional methods is a matter of concern as this has a lesser impact on the aversion of births. Figure 3 (a) and (b) presents the current use of modern contraception in the districts of Uttar Pradesh for 2002–04 and 2012–13, respectively. Current use of contraception was highest in the district of Jhansi (67%) and lowest in the district of Balrampur (15.5%) in 2013. The current use of contraception increased by over 80% in eight districts, between 50% and 80% in sixteen districts, between 20% and 50% in 37 districts and less than 20% in eight districts. The increase in contraception was highest in the district of Azamgarh and lowest in Bahraich district. Compared with the improvement in safe delivery and immunization coverage, the increase in the use of contraception was slow in many districts in Uttar Pradesh.
Map of Uttar Pradesh showing the levels of ‘contraceptive use’ in the districts during (a) 2002–04 and (b) 2012–13.

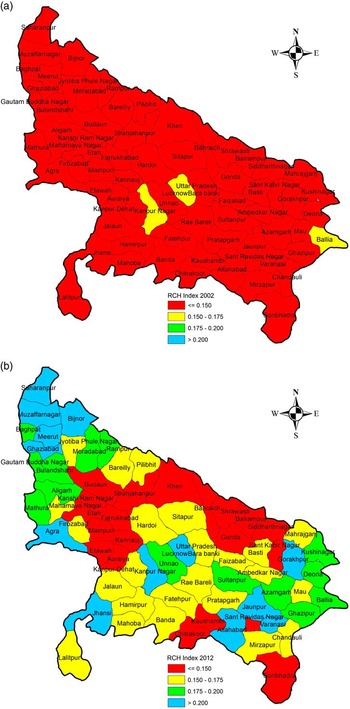
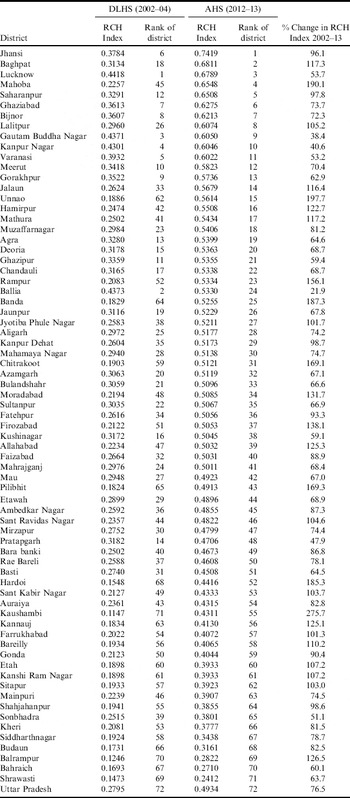
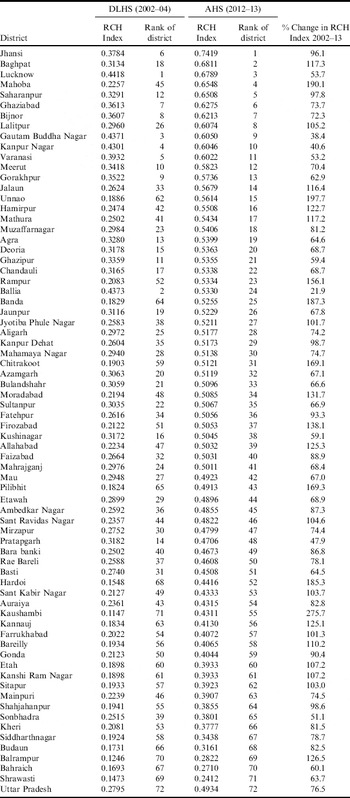
Based on these four indicators, a composite index of RCH services (the RCH Index) was computed for two periods of time (Table 2). Figure 4 presents the composite index of RHC in the districts of Uttar Pradesh for the periods 2002–04 and 2012–13. The composite index depicts the relative position of districts on RCH over time. In 2012–13, the index value ranged from a minimum of 0.241 in Shrawasti to 0.741 in Jhansi district. In 2012–13, twelve districts had a RCH Index of less than 0.40, eighteen districts had between 0.40 and 0.50, 30 districts between 0.50 and 0.60 and eleven districts had an RCH Index of more than 0.60. While in 2002–04 none of the districts had an RCH Index of more than 0.50, four districts had between 0.40 and 0.50, and 67 districts had an RCH Index of less than 0.40. Over the period, there was a significant improvement in the RCH Index. The improvement in RCH Index between 2002–04 and 2012–13 was highest in the district of Kaushambi (more than three-fold), followed by Unnao, Mahoba, Banda, Hardoi, Pilibhit and Chitrakoot districts, and lowest in the district of Ballia, preceded by Gautam Budh Nagar, Kanpur Nagar, Pratapgarh, Sonbhadra, Varanasi and Lucknow. Moreover, between 2002 and 2013, out of the 71 districts in Uttar Pradesh, one had experienced a more than three-fold increase in the RCH Index, 25 districts a two-fold increase, 41 districts experienced a 50–100% increase and four districts experienced a less than 50% increase in the RCH Index.
RCH Index in the districts of Uttar Pradesh in (a) 2002–04 and (b) 2012–13.

Ranking of districts by RCH Index and percentage change in RCH Index from 2002 to 2013, Uttar Pradesh
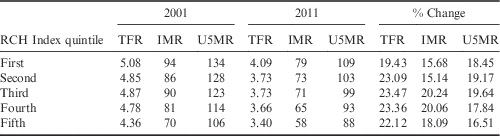
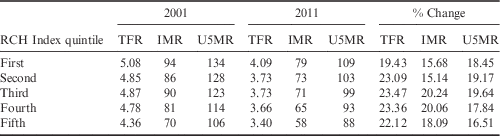
To understand the effect of the RCH Index on demographic outcomes, the districts were classified into quintiles based on the RCH Index. Table 3 presents the mean TFR, U5MR and IMR values of districts based on a quintile of the RCH Index. In 2002 the mean TFR among districts with the poorest RCH quintile was 5.08 while it was 4.36 among districts with the highest quintile. The pattern was similar but of lower degree in 2012–13. Districts in the third quintile of the RCH Index had the highest decline in TFR followed by districts in the fourth quintile of the RCH Index. Districts in the third and fourth quintiles of the RCH Index made significant improvement in IMR. Districts in the third quintile of the RCH Index, followed by those in the second quintile, had the greatest improvement in U5MR.
Mean TFR, U5MR and IMR by RCH Index in districts of Uttar Pradesh during 2001–11
The effect of RCH services on fertility
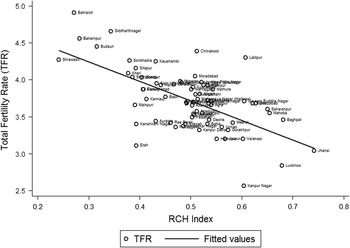
The impact of RCH services on the reduction of fertility in the districts of Uttar Pradesh was examined using scatter-plot and regression models. A scatter-plot of TFR with the RCH Index in the districts of Uttar Pradesh for 2011 is shown in Fig. 5. A higher level of RCH care was found to be associated with a lower level of TFR in the districts of Uttar Pradesh. The correlation coefficient of the RCH Index and TFR was high and stable: −0.60 in 2001 and −0.63 in 2011.
Association between RCH Index and TFR in the districts of Uttar Pradesh, 2011.

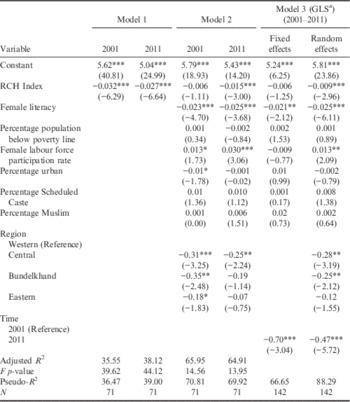
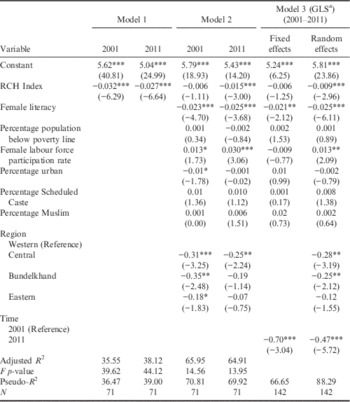
Table 4 presents the results of three alternative regression models. In Model 1, only the RCH Index was included as an explanatory variable. The coefficient of the RCH Index was −0.032 in 2001 and −0.027 in 2011, suggesting that, on average, a 10% increase in the RCH Index led to a reduction in TFR by 0.32 units in 2001 and 0.27 units in 2011. Both coefficients were significant and the model explains 36% of the variations in TFR in 2001 and 39% in 2011. In Model 2, female literacy, percentage of population below poverty line, female labour force participation rate, percentage of urban population, percentage of Scheduled Caste population, percentage of Muslims and four regional dummies, in addition to the RCH Index, were included. The RCH Index, female literacy, female labour force participation rate and central regional dummies were significant for 2011, while for 2001 female literacy, female labour force participation rate, percentage urban and all regional dummy variables were significant. By including other explanatory variables, the coefficient of the RCH Index was −0.006 in 2001 and −0.015 in 2011. The coefficient of female literacy was larger (−0.023 in 2001 and −0.025 in 2011) suggesting that a 10% increase in female literacy leads to a decline in TFR by 0.23 in 2001 and 0.25 in 2011.
Results of Ordinary Least Square (OLS) analysis with TFR as dependent variable
a GLS, Generalized Least Squares.
*p<0.1; **p<0.05; ***p<0.01; t-values in parentheses.
In Model 3, two sets of models – fixed effects and random effects – were used. The advantage of the fixed-effects model is that it takes district-specific effects into account, while the random-effects model assumes that the district-specific random error is uncorrelated with the other explanatory variables. In the fixed-effects model, the RCH Index was insignificant, while in the random-effects model it showed a significant and negative association with TFR. The other statistically significant explanatory variables were female literacy and female labour force participation rate. The time dummy was significant in the model suggesting that fertility declined over time. In the random-effects model, 88% of the variations in TFR were explained compared with 67% in the fixed-effects model. The RCH Index remained significant in the random-effects model suggesting that improvement in RCH services reduces fertility levels.
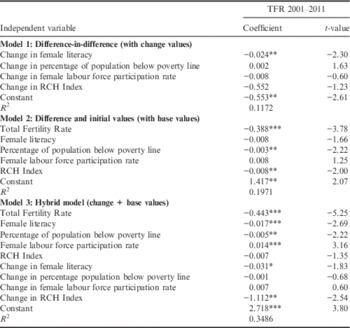
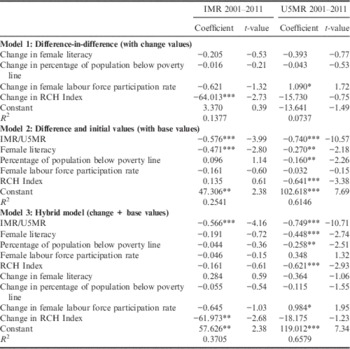
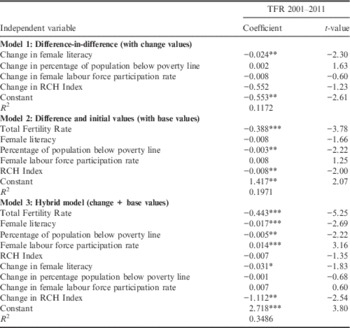
Table 5 presents results of the difference-in-difference model, difference and initial model and hybrid model. In all these models, the change in TFR during 2001–11 was the dependent variable. In the difference-in-difference model, change in TFR (TFR of 2011−TFR of 2001) was regressed with change in four explanatory variables (female literacy, female labour force participation, percentage of population living below poverty line and RCH Index). Female literacy was the only significant predictor and the model explained only 12% of the overall changes in fertility. The estimated coefficient of −0.024 for female literacy rate suggests that, on average, a 10% increase in female literacy would lead to a 0.24 unit decline in TFR. In Model 2, the change in fertility level was regressed with initial values of the explanatory variables. The base values of TFR, percentage of population below poverty line and RCH Index were significant in the model. The regression coefficient was larger for TFR (−0.39) followed by the RCH Index (–0.008). In the third model, both initial and change values of the explanatory variables were included. Both level and changes in female literacy exerted a large influence on change in fertility. The other significant variables were initial TFR, percentage of population below poverty line, female labour force participation rate and change in the RCH Index. This model explained 35% of the variations in fertility changes over the period.
Results of regression analysis with change in TFR from 2001 to 2011 as the dependent variable under alternative model specification
*p<0.1; **p<0.05; ***p<0.01.
Effect of RCH services on infant mortality and under-five mortality
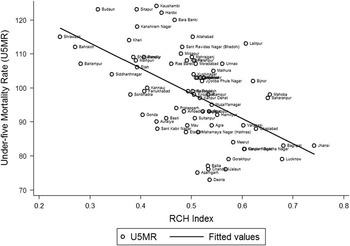
The impact of RCH services on mortality was examined using IMR and U5MR over the last decade. Unlike fertility, the correlation coefficient of IMR and the RCH Index weakened over time, from −0.63 in 2001 to −0.57 in 2011. The correlation coefficient of U5MR with the RCH Index was −0.71 in 2001 and −0.55 in 2011 (Fig. 6).
Association between RCH Index and U5MR in the districts of Uttar Pradesh, 2011.

Cross-sectional and panel regression analysis was used to understand the impact of the RCH Index on infant and child mortality during 2001–2011. Like TFR, three sets of models for IMR and U5MR were used: Model 1 with only RCH Index, Model 2 with the RCH Index along with other variables and Model 3 with fixed effects and random effects. Table 6 shows that the RCH Index alone explains 30–40% of the variation in IMR across districts. The coefficient of the RCH Index was highly significant and negative for both periods. The effect of the RCH Index was lower in 2011 than in 2001. In the second model, the RCH Index and female literacy were significant in 2001. In 2011, other than the RCH Index, the eastern regional dummy was significant. In the third model, fixed effects and random effects were estimated using the same set of predictors used in Model 2. Both models confirmed the cross-sectional findings. When the district effects were taken as fixed, the coefficients of the RCH Index remained negative and highly significant. The percentage of Muslim population, and percentage of households having drinking water and toilet facility were significant in the fixed-effects model. However, in the random-effects model female literacy, time and eastern regional dummies were significant, even controlling for RCH Index. No significant association of infant mortality with the percentage of population below poverty line, female labour force participation rate, percentage urban, percentage of Scheduled Castes and percentage of Muslim population was found. This model explained about 62% of the variations in infant mortality reduction.
Results of Ordinary Least Square (OLS) analysis with IMR as the dependent variable
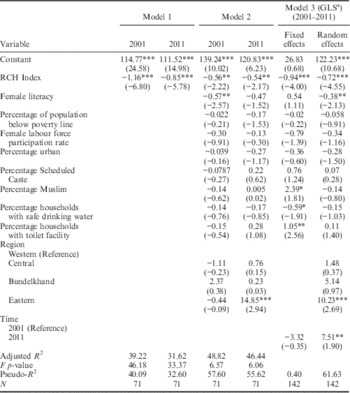
a GLS, Generalized Least Squares.
*p<0.1; **p<0.05; ***p<0.01; t-values in parentheses.
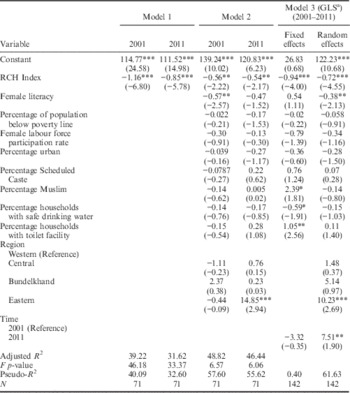
Table 7 presents the results of regression analysis for U5MR. These results are very similar to those obtained for IMR. In Model 1, the coefficients of the RCH Index continued to be negative and highly significant with U5MR. It has been found that the RCH Index accounted for half of the variation in the U5MR across districts in 2001. On average, a 10% increase in the RCH Index led to a 17-unit and 7-unit decrease in U5MR in 2001 and 2011, respectively. In Model 2, the addition of other variables increased the explanatory power of the model from 51% to 75% in 2001 and from 31% to 68% in 2011. The coefficient of the RCH Index was negative and highly significant in 2001 and insignificant in 2011. The coefficient of female literacy was negative and significant for both periods. On the contrary, a coefficient of female labour force participation rate was positive and significant in 2011. With respect to regional dummies, Bundelkhand and the eastern regions were significant in explaining variations in child mortality across districts in 2011. This indicates a significant role of regional variables in explaining variations in child mortality level. In pooled data (Model 3), fixed and random effects were estimated. The results of the random-effects model revealed that the RCH Index, female literacy, female labour force participation rate and central and eastern regions to be significant predictors of child mortality reduction. The time dummy was not significant in this model. This model accounts for three-quarters of the change in child mortality across districts.
Results of Ordinary Least Square (OLS) analysis with U5MR as the dependent variable
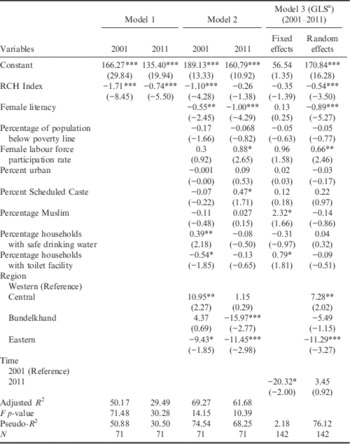
a GLS, Generalized Least Squares.
*p<0.1; **p<0.05; ***p<0.01; t-values in parentheses.
The results of the difference-in-difference, difference-and-initial values and hybrid models for IMR and U5MR are presented in Table 8. In all these models, changes in IMR and U5MR were the dependent variables and female literacy, percentage of population below poverty line, female labour force participation rate and the RCH Index were the independent variables. In the difference-in-difference model of IMR, all the explanatory variables except the RCH Index remained insignificant over the period. This model explained only 13% of the changes in IMR. In the second model, the changes in IMR were regressed with initial values. It was found that IMR and female literacy were significant in the model. The regression coefficient was larger for baseline IMR (−0.58) followed by female literacy (−0.47). In the third model, both initial and change values of the explanatory variables were included. Here changes in the RCH indices exerted a larger influence on the change in infant mortality. This model explained 37% of the variations in infant mortality changes during 2001–11.
Result of regression analysis with change in IMR and change in U5MR from 2001 to 2011 as the dependent variable under alternative model specification
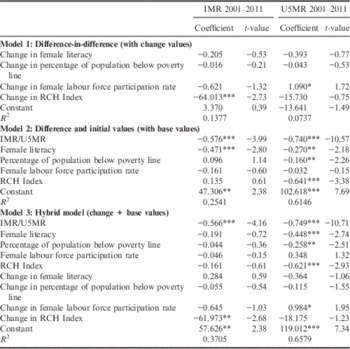
*p<0.1; **p<0.05; ***p<0.01.
With respect to U5MR, only the female labour force participation rate was significant in Model 1 and this explained 7% of the decline in U5MR over the period. In Model 2, the base values of all the explanatory variables, except female labour force participation rate, were significant. The estimated coefficient of the RCH Index (−0.64) suggests that, on average, a 10% increase in index value leads to a 10% decline in child mortality. In the third model, initial levels of the RCH Index, U5MR, female literacy, percentage of population below poverty line and changes in female labour force participation rate were significant. This model explains 66% of the reduction in child mortality over the period.
Discussion
The last decade saw an intensification of programme and policies at global, national and regional levels to achieve health-related Millennium Development Goals. The Government of India launched the largest flagship programme – the National Rural Health Mission – to improve the health of mothers and children. Though RCH services have increased over time, there has been no attempt to understand their effect on demographic change, and specifically changes in fertility and infant and under-five mortality in the state of Uttar Pradesh. This paper examined the impact of RCH services on total fertility rate, infant mortality rate and under-five mortality rate in the state. The analyses were carried out at the district level with 2002–04 as the base year (pre-NRHM period) and 2012–13 as the final year (post-NRHM period).
The results show an increase in all four RCH services in many of the districts, the greatest increase being in the case of safe delivery followed by full immunization and three or more ANC visits. Contraceptive use recorded a minimum increase during the period, suggesting that perhaps the emphasis has been on improving maternal care, especially delivery at health centres. Second, the inter-district variations in RCH services and the RCH Index are large. The relative ranking of districts in the RCH Index has remained similar over time, so the poor-performing districts are lagging over time. From a programmatic point of view, the poor-performing districts should be given programme priority to reduce inter-district inequality in RCH care. Third, both female literacy and the RCH Index have a strong and positive effect on the reduction of fertility. Investment in female education and increase in RCH services have helped to reduce fertility levels in the districts of Uttar Pradesh. Fourth, the impact of the RCH Index on IMR and U5MR is stronger than that of fertility. The coefficient of the RCH Index is largest among the explanatory variables suggesting that investment in RCH services improves child survival.
From the above findings, it can be inferred that improvement in RCH services and female education have had a positive impact on the reduction in fertility, infant mortality and under-five mortality in the districts of Uttar Pradesh. However, inter-district variations in RCH services are large, suggesting that targeted intervention is needed in the poor-performing districts in the state. Increasing programmatic attention on poor-performing districts and a continued focus on girls’ education and RCH services will help to achieve demographic and health targets in the state.
Acknowledgments
This paper is part of Mamta Rajbhar’s PhD research entitled ‘Socio-economic development and demographic change in districts of Uttar Pradesh’. MR received funding from the University Grant Commission (UGC), Government of India. The authors thank the reviewer for their valuable suggestions on an earlier draft of the paper.