Implications
Information on chemical composition and standardized ileal digestibility (SID) of CP and amino acids (AA) of recently introduced barley genotypes in pigs is lacking. The observed lower SID of AA in these genotypes compared to corresponding values for barley in current feed tables suggests that data on the protein value of barley for pigs need to be re-evaluated, thereby assisting the feed industry in formulating diets more precisely targeted at pigs’ AA requirement.
Introduction
In the European Union, more than 306 million tons of cereals are produced per year, of which about 60 million tons are grown as barley (FAOSTAT, 2013). For livestock feeding, especially for growing pigs, 37 million tons of barley are annually used in the European Union (FAOSTAT, 2013). Its CP content varies considerably, ranging between 7.3% and 16.1% dry matter (DM; Spindler et al., Reference Spindler, Mosenthin and Eklund2014), and is low compared to protein ingredients such as soybean meal. However, due to high dietary inclusion levels, barley can supply usually up to half of the feed protein in pig diets. As prices and availability of protein ingredients are affected by the world market, cereal grains, including barley, may aid pig producers in reducing feed costs, provided that the contents of digestible amino acids (AA) from recently introduced and locally produced cereal grains are known. Standardized ileal digestibility (SID) of AA in barley has been summarized in several feed tables (e.g. Evonik Degussa, 2010; NRC, 2012), but according to the results of a recently performed meta-analysis by Spindler et al. (Reference Spindler, Mosenthin and Eklund2014), there is a great variation in SID of AA compared to data compiled in these feed tables. Changes in environmental conditions during growing season but also genetic variations among barley genotypes have been shown to be responsible for differences in nutrient content between barley samples (Bach Knudsen, Reference Bach Knudsen1997; Spindler et al., Reference Spindler, Mosenthin and Eklund2014). These differences may also affect SID of AA, however, information on both chemical composition and SID of AA in new genotypes of barley is lacking. Therefore, the objective of the present study with growing pigs was to determine the chemical composition, physical characteristics, and SID of CP and AA in eight genotypes of winter barley, recently added to the German Descriptive Variety List, and to establish potential relationships between nutrient content and SID values.
Material and methods
Experimental protocols complied with the guidelines of the Danish Animal Experiments Inspectorate, Ministry of Justice, Copenhagen, Denmark. The experiment was conducted at Aarhus University (Department of Animal Science, Research Center Foulum, Tjele, Denmark).
Animals, experimental design and diets
A total of nine crossbred barrows ([Landrace×Yorkshire]×Duroc), with an average initial BW of 30±2 kg, were housed individually in smooth sided pens with a concrete floor (2.8 m2). The temperature was maintained at 22±2°C. All pigs were fed individually and had free access to drinking water. After 2 weeks of adaption to the new environment, pigs were surgically fitted with simple T-cannulas at the distal ileum. The internal diameter of the barrel of the cannulas was 20 mm, the length of the barrel was 60 mm and the flange was 85 mm in length. The pigs were allowed 6 to 9 days for recovery from surgery. During the adaption and recovery period, a standard diet was fed, containing 15.8% CP and 13.2 MJ metabolizable energy (ME)/kg diet (as-fed).
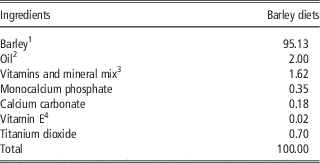
The experiment was arranged as an 8×9 Youden square design with nine pigs, eight diets and eight periods of 6 days each. In total, eight seed-grade, hulled genotypes of winter barley, including Yool (Syngenta Seeds GmbH, Bad Salzuflen, Germany) Travira (Ackermann Saatzucht GmbH & Co. KG, Irlbach, Germany), Lomerit (KWS LOCHOW GmbH, Bergen, Germany), Campanile (LIMAGRAIN GmbH, Edemissen, Germany), Canberra (LIMAGRAIN GmbH), Anisette (NORDSAAT Saatzucht-GmbH, Langenstein, Germany), Metaxa (Ackermann Saatzucht GmbH & Co. KG), and Fridericus (KWS LOCHOW GmbH) were assayed. In the growing season 2010/11, the experimental barley genotypes were grown under identical environmental conditions on the same site close to the University of Hohenheim (Stuttgart, Germany). The study, however, was not designed as a variety trial, as annual and environmental effects were not taken into account. After harvest, the eight barley genotypes were gently dried to lower moisture content to levels of about 12%, and cleaned with a combination of air-screen cleaner and indented cylinder to obtain high quality seeds without any impurities. The experimental diets contained one of the eight genotypes each, with barley being the sole source of dietary CP and AA (Table 1). The barley batches were ground using a hammer mill (SKIOLD A/S, Sæby, Denmark) to pass a 2-mm sieve. There was no further processing of the barley batches. A commercial mineral and vitamin premix, monocalcium phosphate, sodium chloride and calcium carbonate were added to the experimental diets to meet the NRC (1998) nutrient requirements for pigs above 20 kg of BW, except for CP and AA. All experimental diets were supplemented on as-fed basis with plant oil at a level of 2%, and 0.02% of dl- α-tocopherol acetate was added as antioxidant. Titanium dioxide (0.70%) was used as an indigestible marker. At the beginning of each period, pigs where weighed and fed the experimental diets at a daily feed intake level of 4% (as-fed) of average BW of all animals, corresponding to approximately three times their daily energy requirement for maintenance (i.e. 106 kcal of ME (as-fed)/kg of BW0.75; NRC, 1998).
Composition of the experimental diets for determination of standardized ileal digestibility of CP and amino acids in eight barley genotypes (%, as-fed)

1 Eight barley genotypes: Yool (Syngenta Seeds GmbH), Travira (Ackermann Saatzucht GmbH & Co. KG), Lomerit (KWS LOCHOW GmbH), Campanile (LIMAGRAIN GmbH), Canberra (LIMAGRAIN GmbH), Anisette (NORDSAAT Saatzucht-GmbH), Metaxa (Ackermann Saatzucht GmbH & Co. KG), Fridericus (KWS LOCHOW GmbH).
2 Blend of rapeseed (75%) and soybean oil (25%).
3 Deutsche Vilomix Tierernährung GmbH, Neuenkirchen-Vörden, Germany. Supplied per kg of diet: Ca, 4.0 g; P, 0.8 g; Na, 0.9 g; Mg, 162 mg; Fe, 65 mg (FeSO4·H2O); Cu, 8 mg (CuSO4·5H2O); Mn, 43 mg (MnO); Zn, 54 mg (ZnO); J, 1.1 mg (Ca(IO3)2); Se, 0.2 mg (Na2SeO3); Co, 0.1 mg (2CoCO3·3Co(OH)2·H2O); Vitamin A, 6480 IU; Vitamin D3, 972 IU; Vitamin E, 41 mg; Vitamin B1, 1 mg; Vitamin B2, 3 mg; Vitamin B6, 2 mg; Vitamin B12, 16 µg; Vitamin K3, 2 mg; Niacin, 10 mg; Ca-pantothenat, 6 mg; Folic acid, 0.4 mg; Choline chloride, 122 mg.
4 Euro OTC PHARMA GmbH, Bönen, Germany.
Experimental feeding and sample collection
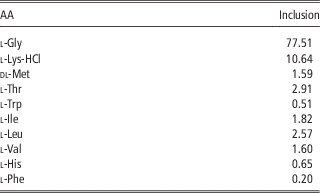
The experimental diets were fed in two equal meals (mash feeding) at 0800 and 2000 h. Occasional feed refusals were weighed and discarded after determination of DM content. The initial 4 days of each period were considered as an adaption period to the diets. During the initial 3.5 days of each period, a mixture of crystalline AA (Table 2) was added to the diets, to meet the animals’ CP and AA requirement. Crystalline AA are assumed to be 100% digestible and not to influence digestibility values that we measured in the experiment (Pedersen et al., Reference Pedersen, Boersma and Stein2007). At the evening feeding of day 4, 0.2% (as-fed) of chromic oxide was added to the experimental diets as marker to allow for visual differentiation of digesta originating from the experimental diets devoid of synthetic AA.
Composition of the crystalline amino acids (AA) mixture added to the experimental diets (%, as-fed)1,2

1 All crystalline AA were supplied by Evonik Industries AG, Hanau-Wolfgang, Germany. The purity of all crystalline AA was 99%, except for l-Lysine-HCl (78%).
2 The crystalline AA mixture was fed to the pigs during the initial 3.5 days of each period. The total amount was adjusted to their daily feed allowance in the respective periods, and was 50, 54, 59, 64, 69, 75, 81, and 87 g/feeding in periods one to eight, respectively.
Ileal digesta samples were collected for a total of 12 h. They were sampled on day 5 of period one, three, five and seven from 1000 to 1200, 1400 to 1600 and 1800 to 2000 h, and on day 6 of period one, three, five and seven from 2000 to 2200, 2400 to 0200 and 0400 to 0600 h. In addition, digesta collection was conducted on day 5 of period two, four, six and eight from 0800 to 1000, 1200 to 1400 and 1600 to 1800 h, and on day 6 of period two, four, six and eight from 2200 to 2400, 0200 to 0400 and 0600 to 0800 h. Ileal digesta were collected in plastic bags. Each bag was removed at least every 30 min, and 4 ml of 2.5 M formic acid were added to every bag to minimize further bacterial fermentation. Digesta samples were pooled within pig and period and immediately frozen at −20°C.
Sample analyses
After conclusion of the experiment, digesta samples were freeze-dried, ground to 0.5 mm and homogenized before analyses. All analyses of proximate nutrients, gross energy (GE), protein fractions and carbohydrates were done in duplicate, except singular analysis of cellulose and soluble non-cellulosic polysaccharides (NCP). Thousand seed weight (TSW) was determined according to the method by the International Seed Testing Association (ISTA, 2013). Test weight (TW) in kg/hl was calculated from a measured volume of a quarter liter. Falling number (FN, as measure for the degree of sprout damage) was determined with a Perten FN 1800 (Perten Instruments, Hägersten, Sweden) based on two subsamples of a 7 g wholemeal sample based on the method of the International Association for Cereal Chemistry protocol (IACC, 1968). The following nutrients in barley genotypes were analyzed according to official standard methods described by Naumann and Bassler (Reference Naumann and Bassler1976): dry matter (DM; method 3.1), nitrogen (N; method 4.1.1), ash (method 8.1), crude fiber (CF; method 6.1.1), ether extract (EE; method 5.1.1 using petroleum ether), NDF was assayed with a heat-stable amylase exclusive of residual ash (aNDFom; method 6.5.1), and ADF was also expressed exclusive of residual ash (ADFom; method 6.5.2). Acid detergent lignin was analyzed by solubilization of cellulose with sulfuric acid (method 6.5.3). Starch content was analyzed enzymatically according to Seifried et al. (Reference Seifried, Steingaß and Rodehutscord2015). Sugar contents (glucose, fructose, sucrose), fructans, NCP, non-starch polysaccharides (NSP) and Klason lignin in the barley genotypes were determined by enzymatic-colorimetric and enzymatic-chemical-gravimetric methods as described by Bach Knudsen (Reference Bach Knudsen1997). The content of total and soluble arabinoxylan (AX) was determined as the sum of arabinose and xylose residues in total and soluble NSP. Total and insoluble β-glucans were measured by the enzymatic-colorimetric method of McCleary and Glennie-Holmes (Reference McCleary and Glennie-Holmes1985). Soluble β-glucan content was calculated as difference between total β-glucan and insoluble β-glucan content after extraction of the soluble β-glucan in water (Åman and Graham, Reference Åman and Graham1987). Gross energy content was measured by means of a bomb calorimeter (IKA calorimeter, C200; IKA®-Werke GmbH & Co. KG, Staufen, Germany). Nitrogen content in experimental diets and digesta samples was analyzed using a gas combustion method (FP-2000; Leco Corp., St. Joseph, MI, USA) according to the official method 990.03 of the Association of Official Analytical Chemists (AOAC, 2000). Crude protein content was calculated by multiplying the content of N with 6.25. Ethlyenediaminetetraacetic acid was used as a reference standard before and after all N analyses. Amino acid contents in barley genotypes, experimental diets and digesta samples were determined as described by Rosenfelder et al. (Reference Rosenfelder, Mosenthin, Spindler, Jørgensen, Bach Knudsen, Sauer, Htoo and Eklund2015). In the barley genotypes, the Osborne protein fractions albumin, globulin, prolamin and glutelin were analyzed, based on their solubility in a series of solvents, according to procedures described by Wroblewitz et al. (Reference Wroblewitz, Hüther, Manderscheid, Weigel, Wätzig and Dänicke2014). Concentration of titanium dioxide in the experimental diets and ileal digesta samples was measured according to a method outlined by Brandt and Allam (Reference Brandt and Allam1987).
If not stated otherwise, nutrients are presented on as-fed basis.
Calculations
Apparent ileal digestibility (AID) of CP and AA in the experimental diets was calculated according to the following equation:
 $${\rm AID}\,{\equals}\,\left[ {1{\minus}({\rm AA}_{{{\rm digesta}}} /{\rm AA}_{{{\rm diet}}} ){\times}({\rm Ti}_{{{\rm diet}}} /{\rm Ti}_{{{\rm digesta}}} )} \right]{\times}100\,\%\,$$
where AID is the apparent ileal digestibility of CP or AA in the experimental diet (%), AAdigesta the CP or AA content in ileal digesta (% DM), AAdiet the CP or AA content in the experimental diet (% DM), Tidiet the marker content in the experimental diet (% DM) and Tidigesta the marker content in ileal digesta (% DM).
The basal ileal endogenous losses of CP and AA (IAAend)/kg DM intake were adopted from a study by Jansman et al. (Reference Jansman, Smink, van Leeuwen and Rademacher2002), as IAAend can be considered to be constant among groups of pigs (Jansman et al., Reference Jansman, Smink, van Leeuwen and Rademacher2002; Stein et al., Reference Stein, Sève, Fuller, Moughan and de Lange2007). The SID in the barley genotypes was determined according to the equation:
 $${\rm SID\,{\equals}\,AID{\plus}(IAA}_{{{\rm end}}} {\rm /AA}_{{{\rm diet}}} {\rm )}{\times}{\rm 100\,\%\,}$$
where SID is the standardized ileal digestibility of CP or AA in the barley genotype (%), IAAend the basal ileal endogenous losses of CP and AA (g/kg DM intake), and AAdiet the CP or AA content in the experimental diet (g/kg DM).
Standardized ileal digestible content (cSID) of CP and AA was calculated as follows:
 $${\rm cSID\,{\equals}\,SID}{\times}{\rm AA}_{{{\rm barley}}} $$
where cSID is the standardized ileal digestible content of CP and AA in the barley genotype (%, as-fed) and AAbarley the CP or AA content in the barley genotype (%, as-fed).
Statistical analyses
Homogeneity of variance and normal distribution of the data were confirmed and outliers were detected by analysis of the residuals for ileal DM digestibility in the experimental diets, ileal Pro recovery and SID of CP and all AA using the UNIVARIATE procedure (SAS, 2008; Institute Inc., Cary, NC, USA). Observations in the respective periods were therefore removed from the data set and not statistically analyzed when studentized residuals were >|2.5|. Data on chemical composition and physical characteristics of the eight barley genotypes were analyzed using the CORR procedure of SAS. Standardized ileal digestibility of CP and AA in the genotypes was analyzed using the MIXED procedure of SAS, where barley, genotype and pig were considered as fixed, and period and period×pig as random effects. Results are reported as least square means. A t-test, with degrees of freedom, determined by the Kenward-Roger method for multiple comparisons was conducted, provided that preliminary simple F-test revealed differences at P⩽0.05. Significant differences among barley genotypes were indicated by different superscript letters, using the algorithm for letter-based representation of all pair-wise comparisons (Piepho, Reference Piepho2004). Linear and multiple regression analyses were performed on effects of chemical composition, including CP, protein fractions, starch, NDF, ADF, ADL, NSP fractions (soluble, insoluble, and total NSP, AX and β-glucan), and physical parameters, on SID and cSID of CP and AA in all barley genotypes, and the best structure according to the Akaike Information Criterion (AIC) was selected. For all Wald-type F-tests, the significance level was set at α=0.05, and trends were discussed at 0.05<α⩽0.10.
Results
General observations
The animals recovered well from surgery, remained healthy throughout the experiment and readily consumed their daily feed allowances.
Physical characteristics and chemical composition of the eight barley genotypes
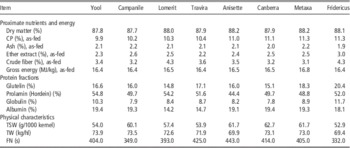
Mean FN value was 395.6 s (Table 3). There was only small variation in ash content between the genotypes. Crude fiber content averaged 3.6%. Gross energy and EE were positively correlated (P<0.05), with average EE and GE contents of 2.5% and 16.5 MJ/kg, respectively. Additionally, FN increased (P<0.05) with increasing EE content.
Contents of proximate nutrients, gross energy, protein fractions and physical characteristics in eight genotypes of barley grown under identical environmental conditions (for details please see footnote 1 in Table 1)

TSW=thousand seed weight; TW=test weight; FN=falling number.
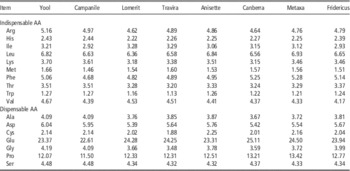
The average CP content was 10.7%. Mean contents of Lys, Met, Thr and Trp were 3.4%, 1.6%, 3.3% and 1.2% of CP, respectively (Table 4). The mean proportions of glutelin and globulin in barley protein were 16.8% and 9.0%, and mean proportions of prolamin (hordein) and albumin in barley protein were 50.7% and 17.9%, respectively.
Amino acid (AA) contents (% of CP) in eight genotypes of barley grown under identical environmental conditions (for details please see footnote 1 in Table 1)

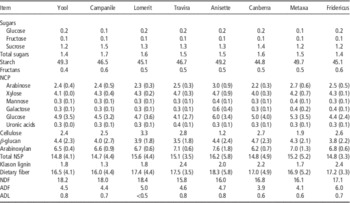
Average fructan and starch contents (Table 5) in the genotypes were 0.5% and 47.1%, respectively. Starch content was negatively correlated (P<0.05) with fructan content. Among the NCP, mean total arabinose and xylose contents were 2.5% and 4.3%. Total glucose content (among NCP) in the eight barley genotypes averaged 4.9%, whereas mean cellulose content accounted for 2.4%. Glucose and fructose among the sugar fraction, and mannose, galactose and uronic acids among the NCP fraction, were only present in traces. Dietary fiber and Klason lignin contents averaged 17.1% and 2.0%. Dietary fiber content was negatively correlated with TW (P<0.05). Mean ADF content was 4.7%, whereas ADL content averaged 0.6%.
Carbohydrate and lignin content (%; as-fed) in eight genotypes of barley grown under identical environmental conditions (for details please see footnote 1 in Table 1)Footnote 1

NCP=non-cellulosic polysaccharides; NSP=non-starch polysaccharides.
1 Values in parentheses represent soluble fractions.
Standardized ileal digestibility and standardized ileal digestible content of CP and AA in the eight barley genotypes
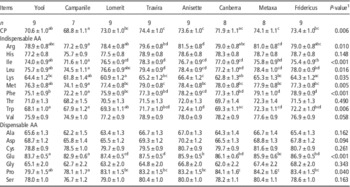
The SID of CP varied between 69% and 74% (Table 6), with greatest values for the genotypes Travira, Anisette and Metaxa, and lowest value for Campanile (P<0.01). The SID of Lys was greater (P<0.05) in genotype Anisette compared to Campanile, Lomerit and Canberra, whereas Travira showed the greatest SID value for Met (P<0.05) in comparison with Yool and Campanile, and SID of Trp was greater (P<0.05) in genotype Anisette compared to Yool, Campanile, Lomerit and Canberra. For SID of Arg, His, Ile, Leu, Met, Phe, Thr, Trp, Val, Cys, Glu and Pro, there was up to 5% units linear increase (P<0.05), as the CP content in the barley genotypes increased from 9.9% to 11.3%, and SID of Phe, Trp and Gly linearly increased (P<0.05) upon increase of glutelin content. In contrast, SID of Arg and Trp linearly decreased (P<0.05), when prolamin content increased, and SID of CP and most AA in the barley genotypes linearly decreased (Leu, Phe, Trp, Glu; P<0.05) or tended to linearly decrease (Arg, His, Ile, Met, Cys, Pro, Ser; P<0.1) up to 5% units following increase in TW from 69.4 to 73.9 kg/hl. With increasing total NSP content from 14.6% to 16.2%, SID of CP, Arg, Ile, Met, Trp and Glu linearly increased (P<0.05). Similarly, SID of CP and Arg, Leu, Lys, Trp, Ala, Asp and Ser linearly increased (P<0.05) as total AX content increased from 6.2% to 7.6%, whereas SID of Glu, and SID of CP and Glu linearly decreased (P<0.05) as content of both total and soluble β-glucan increased from 3.5% to 4.7% and 1.8% to 2.7%, respectively. Moreover, SID of all AA except for Thr, Cys and Gly, linearly decreased (P<0.05) as NDF content increased from 15.8% to 18.4%. Similarly, SID of Arg, Lys, Asp and Trp linearly decreased (P<0.05), and SID of Phe, Trp and Ala showed a trend toward a linear decrease (P<0.1), as the cellulose content in the barley genotypes increased from 1.2% to 3.3%. On the other hand, increase in total dietary fiber from 16.0% to 18.3% and in Klason lignin content from 1.3% to 2.4% resulted in higher SID values (P<0.05) for all AA, except for Lys, Thr, Ala, Asp and Gly, and for all AA except for Lys, Thr, Ala, Asp, Gly and Ser, respectively. An increase in contents of total sugar and sucrose in barley genotypes from 1.4% to 1.7% and from 1.2% to 1.5%, respectively, was associated with a decrease in SID of CP and most AA (P<0.05).
Standardized ileal digestibility of CP and amino acids (AA; LS means±SEM (%)) in eight genotypes of barley grown under identical environmental conditions (for details please see footnote 1 in Table 1) fed to growing pigs

n=number of pigs per treatment.
a,b,c,dValues within a row with different superscripts differ significantly at P<0.05.
1 P-value for Wald-type F-tests for treatment differences.
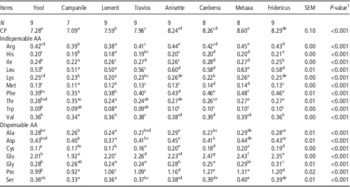
An overall effect of genotype on cSID of CP and AA could be observed (Table 7; P<0.001). Additionally, cSID of all AA, except for Gly, linearly decreased (P<0.05) as the content of NDF increased. With increasing CP content, cSID of all AA linearly increased (P<0.05), and cSID of most AA also increased (P<0.05) with increasing glutelin content. Furthermore, cSID of Leu, Trp, Val, Cys, Glu, Pro and Ser linearly increased (P<0.05) as TSW increased from 52.9 to 62.7 g/1000 kernel, whereas increasing TW resulted in decreasing cSID of all AA except for Ile and Met (P<0.05), and increasing prolamin content resulted in decreased cSID of most AA (P<0.05). With increasing starch content, cSID of His, Phe, Thr, Trp, Cys, Glu, Pro and Ser decreased linearly (P<0.05). The SID of almost all AA decreased (P<0.05) with increasing content of total sugar and sucrose. The cSID of all AA, except for Ile, Leu, Met, Glu, Pro and Ser, increased (P<0.05) as contents of total β-glucan increased. Furthermore, with increasing soluble β-glucan content, cSID of all AA, except for Arg, His, Met, Phe, Thr, Trp and Val increased (P<0.05). For CP, Arg, Leu, Lys, Ala, Asp and Cys, cSID linearly increased (P<0.05) as total AX content increased, and cSID of all AA except for Lys, Thr, Trp, Ala, Asp and Gly, and for Ile, Leu, Met, Phe, Val, Glu and Pro increased (P<0.05) with increasing Klason lignin and total dietary fiber content, respectively. Regression analyses were performed as single correlations, as the performance of multiple regression analysis did not reveal better model fit, according to their AIC values.
Standardized ileal digestible contents of CP and amino acids (AA; LS means, % as-fed basis) in eight genotypes of barley grown under identical environmental conditions (for details please see footnote 1 in Table 1) fed to growing pigs

n=number of pigs per treatment.
a,b,c,d,e,fValues within a row with different superscripts differ significantly at P<0.05.
1 P-value for Wald-type F-tests for treatment differences.
Discussion
Mean contents of CP and indispensable AA (in % of CP) in the barley genotypes, except for Yool, were lower when compared with reported values (NRC, 2012), but still within the range of tabulated values of Evonik Degussa (2010) and Spindler et al. (Reference Spindler, Mosenthin and Eklund2014). The SID of indispensable AA in the barley genotypes was between 3% and 12% units lower when compared to values summarized in current feed tables (Evonik Degussa, 2010; CVB, 2011; NRC, 2012), whereas SID of His, Ile, Leu, Met, Val and Cys in the genotype Travira was close to these reported values. Differences in SID values could possibly be caused by variations in IAAend used for calculation of SID of CP and AA, as not all feed tables disclose this information.
Due to the low content and SID of CP and some indispensable AA, corresponding mean cSID values in most of the barley genotypes were also lower, except for His, Phe and Trp, compared to average values of current feed tables (Evonik Degussa, 2010; CVB, 2011; NRC, 2012), but within the range of reported variations (Evonik Degussa, 2010). In support of the relatively low SID and cSID of AA in the present experiment, a more recent study by Cervantes-Pahm et al. (Reference Cervantes-Pahm, Liu and Stein2014) reported similar SID and cSID of most AA in barley determined by the direct method. Recently, this observation has been confirmed by Rosenfelder et al. (Reference Rosenfelder, Mosenthin, Spindler, Jørgensen, Bach Knudsen, Sauer, Htoo and Eklund2015) who determined in wheat SID of AA in the lower range of values published in feed tables, but comparable to those obtained under similar experimental conditions as reported herein and in the aforementioned study by Cervantes-Pahm et al. (Reference Cervantes-Pahm, Liu and Stein2014). Thus, future research should clarify, whether these differences compared to feed tables are caused by experimental conditions or reflect a consistent decrease that needs to be accounted for in feedstuff tables. If results of future studies confirm that SID of AA in barley and other cereal grains is in the same range, current feed tables need to be updated.
Both content and SID of CP and AA increased linearly as TW decreased. This observation agrees with findings of Kim et al. (Reference Kim, Mullan, Simmins and Pluske2003) for wheat, indicating that the weight of grains is negatively correlated with their protein content. In barley protein, both AA composition and ileal digestibility of AA can be influenced by the proportions of the major seed proteins albumin, globulin, glutelin and prolamin (hordein) as these proportions may differ between genotypes (Jørgensen et al., Reference Jørgensen, Gabert and Fernández1999). Mean prolamin content of 50.6% in the present genotypes was greater compared to 46.6% reported by Giuberti et al. (Reference Giuberti, Gallo, Cerioli and Masoero2012), and compared to mean albumin and globulin contents in the present study (17.9% and 9.0%, respectively). Gabert et al. (Reference Gabert, Jørgensen, Brunsgaard, Eggum and Jensen1996) reported greater proportions of Lys and lower proportions of Glu in barley protein, when Lys-poor prolamin fraction decreased and Lys-rich glutelin fraction increased (Shewry et al., Reference Shewry, Field, Kirkman, Faulks and Miflin1980; Gabert et al., Reference Gabert, Jørgensen, Brunsgaard, Eggum and Jensen1996). Thus, lower mean Lys and greater mean Leu, Phe and Pro contents in the assay genotypes compared to values reported by NRC (2012) are reflected in a greater proportion of prolamin and lower proportions of albumin and globulin. The SID of Arg, His, Ile, Leu, Met, Phe, Thr, Trp, Val, Cys, Glu and Pro and the cSID of all AA in the barley genotypes increased with increasing dietary CP content. According to Jørgensen et al. (Reference Jørgensen, Gabert and Fernández1999), this increase in SID of AA, particularly of Leu, Phe and Pro, can be attributed to an increase in the prolamin fraction, mainly present in the endosperm, and is associated with a greater CP content and higher ileal AA digestibility. Similarly, there were also positive relationships between the glutelin content and SID of Phe, Trp and Gly, and cSID of most AA. On the other hand, contrary to the findings by Jørgensen et al. (Reference Jørgensen, Gabert and Fernández1999), there were negative relationships between prolamin content and SID of Arg and Trp and most cSID of AA, but the reasons for this inconsistency remain unclear. There is sufficient evidence, that hulless barley genotypes contain more AA than hulled genotypes (Baidoo and Liu, Reference Baidoo and Liu1998; Mariscal-Landín et al., Reference Mariscal-Landín, Rodríguez and Reis de Souza2005; Ige et al., Reference Ige, Kiarie, Akinremi, Rossnagel, Flatten and Nyachoti2010). This could be another explanation for the overall lower contents of CP and indispensable AA and SID of AA in the present hulled barley genotypes compared to values reported in feed tables, as it cannot completely ruled out that rather these data include digestibility values determined both in hulled and hulless barley.
Contents of total sugar and sucrose had negative impacts on both, SID and cSID of CP and AA. To our knowledge, these effects have never been studied before, thus further studies are warranted to confirm, if total sugar and sucrose content may aid to predict SID and cSID of CP and AA. Mean NDF content of the present barley genotypes was lower than reported values by NRC (2012; 17.1% v. 18.3%), and, in addition, mean ADF and ADL values were 1.2% and 1.6% units, respectively, lower than tabulated values of NRC (2012). There were linear effects of NDF content on SID and cSID of most AA, resulting in lower SID and cSID values with increasing NDF content. Similarly, SID of Arg, Lys and Asp, and cSID of most AA decreased with increasing cellulose content, whereas Klason lignin and total dietary fiber led to increasing SID of some AA. However, it cannot be completely ruled out that rather these relationships were accidental, for example due to only small variations in dietary contents of these variables.
Reported total NSP content differed between 9.2% and 13.3% (for hulled and hulless barley; Baidoo and Liu, Reference Baidoo and Liu1998; Yin et al., Reference Yin, Baidoo, Lin, Liu, Schulze and Simmins2001a), whereas present genotypes ranged between 14.7% and 16.2%. Greater NSP values in the present genotypes could possibly be attributed to different environmental conditions during the growing season, as according to Holtekjølen et al. (Reference Holtekjølen, Uhlen and Knutsen2008), a higher humidity in July similar to the conditions in the harvest year of the present barley genotypes may result in higher NSP contents. In fact, in 2011, the precipitation was 61% above average values (Bauer, Reference Bauer2011). The NSP are known to increase digesta viscosity (Libao-Mercado et al., Reference Libao-Mercado, Yin, van Eys and de Lange2006), thereby limiting access of substrates to digestive enzymes (O’Connell et al., Reference O´Connell, Sweeney, Callan and O´Doherty2005). As NSP values of the current genotypes were greater than in literature, the overall lower SID of AA in the present experiment compared to values reported by NRC (2012) may be due to the elevated NSP contents coupled with their negative effects on digestibility. Among the NSP fraction, the major components in barley are β-glucan and AX; β-glucan is confined to the aleurone layer and the endosperm, whereas AX is present in endosperm, aleurone but also in the hull layer (Holtekjølen et al., Reference Holtekjølen, Uhlen, Bråthen, Sahlstrøm and Knutsen2006). In the present study, mean β-glucan content was 1.1% units greater than reported values for hulled barley but still within the range of values for hulless barley (Jha et al., Reference Jha, Rossnagel, Pieper, Van Kessel and Leterme2010). There is evidence from studies in broilers (Bedford and Classen, Reference Bedford and Classen1992) and weaned pigs (Yin et al., Reference Yin, Baidoo, Schulze and Simmins2001b) that β-glucan may contribute to a decrease in digestibility of AA due to increasing digesta viscosity, but only SID of few AA in the present genotypes decreased with increasing content of total β-glucan or soluble β-glucan. The most likely reason therefore is the considerable bacterial fermentation of β-glucan occurring in the small intestine of pigs (Bach Knudsen and Hansen, Reference Bach Knudsen and Hansen1991), which may, at least in part, compensate for the negative effect of viscosity on AA digestibility.
The AX represents the largest fraction within the NSP, with values ranging between 38% and 52% of total NSP. Mean AX content of the present barley genotypes (6.8%) was in the lower range of values for AX content reported by Holtekjølen et al. (Reference Holtekjølen, Uhlen, Bråthen, Sahlstrøm and Knutsen2006) for hulled and hulless barley (6.5% to 13.8%). According to Holtekjølen et al. (Reference Holtekjølen, Uhlen, Bråthen, Sahlstrøm and Knutsen2006), differences in AX content between the present genotypes and literature values can possibly be attributed to differences in growing conditions (e.g. different growing locations). The SID and cSID of AA in the present genotypes was not affected or even increased with increasing content of total AX or soluble AX. This is not in accordance with literature as AX, as part of NSP, are known to reduce nutrient digestibility (Yin et al., Reference Yin, Baidoo, Lin, Liu, Schulze and Simmins2001a). Again, it needs to be emphasized that due to low content and variation of AX among barley genotypes a relationship between SID of AA and AX contents could be of minor importance.
In conclusion, current barley genotypes contain significant amounts of cSID of CP and AA, although these values were lower than tabulated values. Significant differences in SID and cSID of AA between barley genotypes need to be accounted for in diet formulation. There exist linear relationships for example between CP, TW, total sugar, sucrose and NDF contents and SID and cSID of CP and AA. In particular, NDF content may aid to predict SID and cSID of CP and AA in barley, whereas the predictive power of other parameters such as TW is limited as only few AA exhibited close relationships. Therefore, additional studies with current barley genotypes grown under different environmental conditions are warranted to elucidate if varying environmental conditions might result in closer relationships between SID and cSID of AA and the physical and chemical composition of barley.
Acknowledgments
The project was supported in the framework of GrainUp by funds of the Federal Ministry of Food, Agriculture, and Consumer Protection (BMELV) based on a decision of the Parliament of the Federal Republic of Germany via the Federal Office for Agriculture Food and (BLE) under the innovation support program.
The authors appreciate the assistance of W. Østergaard Thomsen, R. M. Engberg, K. Johansen, M. Lykkegaard Jørgensen, L. Bech Madsen and P. Scharbau Sørensen (Department of Animal Science, Faculty of Science and Technology, Aarhus University, Tjele, Denmark). Many thanks to Stefanie Wroblewitz (Friedrich-Loeffler-Institut, Federal Research Institute for Animal Health, Braunschweig, Germany).