Implications
The search for genes affecting economically important traits is an useful tool to prospect major genes and better understand the genetic architecture and the physiology behind the expression of the phenotypes. The current study shows the genes that affect growth traits in Nelore beef cattle, which could lead to comparisons across breeds and future breeding strategies.
Introduction
In Brazil, beef cattle farming is undergoing a process of modernization because of the need to increase the production efficiency of the herds due to expansion of the consumer market and competition with other types of meat. One approach to ensure competitiveness is genetic selection (Ferraz Filho et al., Reference Ferraz Filho, Ramos, Silva, Souza, Alencar and Malhado2002). Growth traits such as body weight, which are measured from the early stage of development of the animal until older ages, are important for determining the economic efficiency of any production system. These measures are traditionally included in the selection criteria of beef cattle breeding programs as they are directly related to meat production and exhibit heritability of moderate to high magnitude, indicating that selection for these traits is effective (Frizzas et al., Reference Frizzas, Grossi, Buzanskas, Paz, Bezerra, Lôbo, Oliveira and Munari2009). The genetic correlation between growth traits varies from moderate to high (Boligon et al., Reference Boligon, Albuquerque, Mercadante and Lôbo2009; Baldi et al., Reference Baldi, Albuquerque and Alencar2010). High genetic associations are caused by linkage disequilibrium and pleiotropic effects of genes. However, the genes that influence the traits and the magnitude of their effects are still unknown.
The use of markers permits the identification of chromosome regions with great influence on a trait. According to Peters et al. (Reference Peters, Kizilkaya, Garrick, Fernando, Reecy, Weaber, Silver and Thomas2012), there are practical applications such as the understanding of the genetic structure of populations and subsequent application to genomic selection.
An alternative to the traditional approach of genome-wide association study (GWAS) has recently been proposed by Wang et al. (Reference Wang, Misztal, Aguilar, Legarra and Muir2012) in which all genotypes, phenotypes and pedigree information are considered in a single step (ssGBLUP), thus permitting the use of different models and all relationships simultaneously. Using this approach, all SNPs are considered at the same time together with all phenotypes of genotyped and non-genotyped animals.The objective of this study was to identify regions in the cattle genome that most influence birth weight, weight gain from birth to weaning and from weaning to yearling and yearling height and cow weight in Nelore animals genotyped with a high-density SNP panel.
Material and methods
Phenotypic data
Data from 296 871 Nelore animals (Bos taurus indicus) from herds belonging to farms in different regions of Brazil that participate in the DeltaGen and PAINT breeding programs were used. The following traits were evaluated: birth weight (BW), weight gain from birth to weaning (GBW) and from weaning to yearling (GWY), yearling height (YH), and cow weight (CW) Average daily gains were calculated as the difference between the subsequent and previous weight divided by the number of days comprising the period between two weight recordings.
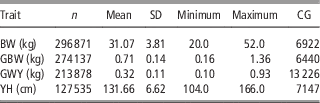
Contemporary groups (CG) for BW were formed by the concatenation of the effects of sex, month, year, farm and management group at birth. For GBW, the farm and management group at weaning were also included. The CG for GWY and YH also included the farm and management group at yearling. Records outside the interval given by the mean of the CG plus or minus three standard deviations were excluded. In addition, CG with fewer than three observations were eliminated. Table 1 shows the overall structure of the data set analyzed. The relationship matrix of genotyped animals contained 5064 animals.
Number of observations (n), mean and respective standard deviation (SD), minimum, maximum and number of contemporary groups (CG) for birth weight (BW), weight gain from birth to weaning (GBW), weight gain from weaning to yearling (GWY) and yearling height (YH)

Genomic data cleaning
The animals were genotyped using a high-density panel containing 777 962 SNPs (High-Density Illumina Bovine BeadChip). Quality control of the genotype data was performed in an iterative process, in which first SNPs and then samples were excluded at each iteration until none of remaining SNPs or samples was excluded. The following criteria were used for the exclusion of SNPs: non-autosomal regions; mapped at the same position; P-value for Hardy–Weinberg equilibrium <10−5; minor allele frequency <2%; GenCall score <70%; and genotyping efficiency of each SNP (call frequency) less than 95%. Samples with a call rate <92% and/or duplicate samples were excluded. The procedures were done using R software (R Core Team, 2014).
Genome-wide association study
The single-step methodology (ssGBLUP) proposed by Wang et al. (Reference Wang, Misztal, Aguilar, Legarra and Muir2012) was used for GWAS. The following single-trait model was applied:
 $$Y\,{\equals}\,Xb{\plus}Za{\plus}e$$
where Y is the vector of phenotypic observations; X the incidence matrix that relates the phenotypes to the fixed effects; b the vector of fixed effects of the CG and covariates (linear and quadratic effects of age of the cow were included in model for BW, GBW, GWY and YH. In addition, the linear and quadratic effect of the age of the animal at measurement were used as covariates for GBW, GWY, YH and CW). Z the incidence matrix that relates the phenotypes to the animals; a the vector of effects of the animals, and e the vector of residual effects.
The variances of a and e are given by:
 $$Var\,\left[ {\matrix{ a \cr e \cr } } \right]{\equals}\left[ {\matrix{ {H\sigma ^{2} _{a} } & 0 \cr 0 & {I\sigma ^{2} _{e} } \cr } } \right]$$
where σ 2 a is the additive genetic variance and σ 2 e the residual variance. H is the matrix that combines the relationship matrix and genomic information matrix as described by Aguilar et al. (Reference Aguilar, Misztal, Johnson, Legarra, Tsuruta and Lawlor2010), and I an identity matrix. The inverse of matrix H is:
 $$H^{{{\minus}1}} \,{\equals}\,A^{{{\minus}1}} {\plus}\left[ {\matrix{ 0 & 0 \cr 0 & {G^{{{\minus}1}} \,{\minus}\,A^{{{\minus}1}} _{{22}} } \cr } } \right]$$
where A is the relationship matrix for all animals; A 22 is the matrix for genotyped animals, and G is the matrix of genomic information, which was calculated as described by Vanraden (Reference Vanraden2008).
 $$G\,{\equals}\,ZDZ'\lambda $$
where Z is the coefficient matrix adjusted for allele frequency; D the weight matrix for SNPs (initially D=I), and λ the weighting factor based on SNP frequencies (Vanraden, Reference Vanraden2008):
 $$\lambda \,{\equals} \,{{ \sigma ^{2} _{u} } \over { \sigma ^{2} _{a} }}\,{\equals}\, {1 \over {\Sigma _{{i\,{\equals}\,1}}^{M} 2p_{i} \left( {1\,{\minus}\,p_{i} } \right)}}$$
The effects of the SNPs and weights were derived following the steps proposed by Wang et al. (Reference Wang, Misztal, Aguilar, Legarra, Fernando, Vitezica, Okimoto, Wing, Hawken and Muir2014). The iteration process was repeated twice, that is, the weights of SNPs were recalculated, repeating steps 2 to 6. The objective of these iterations is to increase the weight of SNPs with large effects and to reduce the weight of those with small effects (Wang et al., Reference Wang, Misztal, Aguilar, Legarra, Fernando, Vitezica, Okimoto, Wing, Hawken and Muir2014). The analyses were processed with the BLUPF90 family of programs (Misztal, Reference Misztal2012). The GWAS results are reported as the proportion of variance explained by a window of 50 adjacent SNPs. The Map Viewer tool for the bovine genome available at NCBI was used to report the genes within the windows: (http://www.ncbi.nlm.nih.gov/projects/mapview/map_search.cgi?taxid=9913&build=103.0). Assembly: Bos_taurus_UMD_3.1.
Results and discussion
Supplementary Material Figures S1, S2, S3, S4 and S5 show the Manhattan plots with the variances of SNP windows that explain >1.5% of the additive genetic variance for BW, GBW, GWY, YH and CW, respectively, after two iterations. Practically all traits have SNP windows that explain >1.5% of additive genetic variance. Important SNP windows were identified on BTA 14 for BW, on BTA 5 and 29 for GBW, on BTA 11 and 8 for GWY, and on BTA 12 for YH. Cow weight exhibited no SNP windows that explained >1.5% of genetic variance.
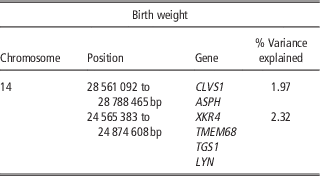
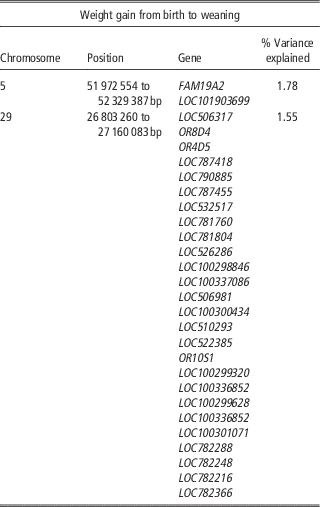
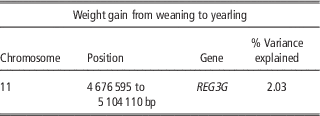
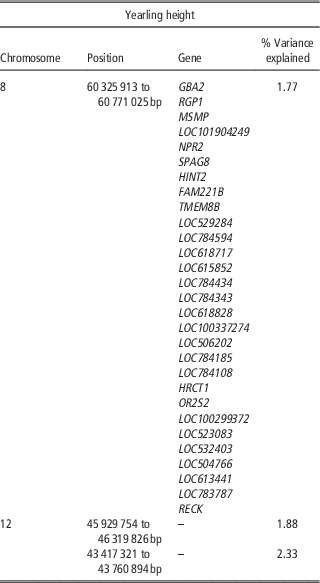
Tables 2, 3, 4 and 5 show the genes (chromosome and position) found in a window of 50 SNPs that explain >1.5% of the additive genetic variance for BW, GBW, GWY and YH, respectively. For BW, the window that explains the highest percentage of additive genetic variance in the trait contains genes already described in previous studies for other traits. Lindholm-Perry et al. (Reference Lindholm-Perry, Sexten, Kuehn, Smith, King, Shackelford, Wheeler, Ferrell, Jenkins, Snelling and Freetly2011) found SNPs in the TMEM68 gene. This gene is expressed in the rumen, abomasum, intestine and adipose tissue. It codes for an enzyme whose role is to catalyze important reactions that involve proteins, lipids or other substrates located within or near the fat layers (Lindholm-Perry et al., Reference Lindholm-Perry, Sexten, Kuehn, Smith, King, Shackelford, Wheeler, Ferrell, Jenkins, Snelling and Freetly2011). The TMEM68 and XKR4 genes have been associated with feed intake and average daily gain in cattle. SNPs near the XKR4 gene have also been associated with subcutaneous fat thickness (Porto-Neto et al., Reference Porto-Neto, Bunch, Harrison and Barendse2012) and the gene has been indicated as a candidate for carcass traits (Ramayo-Caldas et al., Reference Ramayo-Caldas, Ballester, Fortes, Esteve-Codina, Castelló, Noguera, Fernández, Pérez-Enciso, Reverter and Folch2014), both also in cattle.
Identification of genes, chromosome and position based on the genetic variance explained by windows of 50 single nucleotide polymorphisms for birth weight

Identification of genes, chromosome and position based on the genetic variance explained by windows of 50 single nucleotide polymorphisms for weight gain from birth to weaning

Identification of genes, chromosome and position based on the genetic variance explained by windows of 50 single nucleotide polymorphisms for weight gain from weaning to yearling

Identification of genes, chromosome and position based on the genetic variance explained by windows of 50 single nucleotide polymorphisms for yearling height

The LYN gene has been identified in a candidate region for BW of Nelore cattle in other GWAS (Utsunomiya et al., Reference Utsunomiya, Carmo, Carvalheiro, Neves, Matos, Zavarez, O’Brien, Sölkner, McEwan, Cole, Vantassel, Schenkel, Silva, Porto-Neto, Sonstegard and Garcia2013). In another nearby window on the same chromosome, the ASPH gene has been associated with muscle hypertrophy (Perez et al., Reference Perez, Cañón and Dunner2010) and also indicated as a candidate for carcass traits in cattle (Ramayo-Caldas et al., Reference Ramayo-Caldas, Ballester, Fortes, Esteve-Codina, Castelló, Noguera, Fernández, Pérez-Enciso, Reverter and Folch2014). Some genes are candidates for the same trait (BW), while others are candidates for traits correlated with BW, indicating the pleiotropic effect of these genes. Utsunomiya et al. (Reference Utsunomiya, Carmo, Carvalheiro, Neves, Matos, Zavarez, O’Brien, Sölkner, McEwan, Cole, Vantassel, Schenkel, Silva, Porto-Neto, Sonstegard and Garcia2013), studying BW in Nelore cattle, found SNPs located on BTA 14 that explained 4.62% of the genetic variance in the trait. This region has also been indicated by other authors to be associated with reproductive traits, highlighting the PLAG1, CHCHD7, MOS, RPS20, LYN, RDHE2 (SDR16C5) and PENK genes that are associated with height in humans and cattle. The LYN gene was the only gene found in the present study (associated with BW) that has also been reported by other authors.
In the analysis of GBW, the FAM19A2 gene was identified on BTA 5. This gene is associated with body mass index and weight in humans (Comuzzie et al., Reference Comuzzie, Cole, Laston, Voruganti, Haack, Gibbs and Butte2012), providing evidence of its participation in performance and body growth in other species. Also for GBW, the second window that explained most of the additive genetic variance, on BTA 29, contains olfactory receptors (OR) genes (OR8D4, OR4D5 and OR10S1) and many LOC genes corresponding to OR genes. In a study on rats, some olfactory receptor genes exhibited high levels of expression in the duodenum when the animals received diets rich in fatty acids (Primeaux et al., Reference Primeaux, Braymer and Bray2012). It means that OR genes may be related to fatty acids metabolism/absorption in the duodenum, establishing a clear explanation for their influence in GBW trait.
Analysis of the association with GWY identified the REG3G gene located on BTA 11. This gene plays a role in jejunal homeostasis and has been suggested to act on the renewal of intestinal cells in mice (Everard et al., Reference Everard, Lazarevic, Gaia, Johansson, Stahlman, Backhed, Delzenne, Schrenzel, François and Cani2014). More efficient renewal of the intestinal epithelium improves the absorption of nutrients and consequently increases weight gain. Buzanskas et al. (Reference Buzanskas, Grossi, Ventura, Schenkel, Sargolzaei, Meirelles, Mokry, Higa, Mudadu, Silva, Niciura, Torres Júnior, Alencar, Regitano and Munari2014), studying growth traits such as weaning and yearling weight in Canchim cattle, found SNPs associated with weaning weight on BTA 4, 6 and 11 and with yearling weight on BTA 7, 22, 25 and 27. These regions are different from the ones found here. Divergent results can be explained by allele variations among different breeds and by differences in the methodologies used in each study, factors that can lead to over- or underestimation of the effects of QTLs and SNPs.
A total of 29 genes located on BTA 8 were associated to YH. Two SNP windows stood out on BTA 12, which explained 1.88% and 2.33% of the additive genetic variance of this trait, but there is no description of any gene in these regions. In the window associated with BTA 8, the NPR2 gene is an important regulator of skeletal growth. In humans, the loss of function or mutations in this gene cause acromesomelic dysplasia, type Maroteaux (AMDM), a condition that results in disproportionally short stature. Humans with AMDM are born with a normal size and abnormal growth becomes apparent after birth (Olney et al., Reference Olney, Bükülmez, Bartels, Prickett, Espiner, Potter and Warman2005).
The TMEM8B gene was associated with YH, which was also identified in the analysis of the association with BW in the present study, plays an important role in different biological processes with its role explained above. The OR2S2 is an olfactory receptor gene as probably the LOC genes at the same window. They possibly play a role as the olfactory receptors associated with GBW. There are no genes described or associated with cow weight that explain more than 1.5% of the additive genetic variance in the trait.
Many studies have reported genes associated with growth traits in regions different from those found in this study (Alexander et al., Reference Alexander, Geary, Snelling and MacNeil2007; Gutiérrez-Gil et al., Reference Gutiérrez-Gil, Williams, Homer, Burton, Haley and Wiener2009; Bolormaa et al. (Reference Bolormaa, Hayes, Savin, Hawken, Barendse, Arthur, Herd and Goddard2011); Pryce et al. (Reference Pryce, Hayes, Bolormaa and Goddard2011); Buzanskas et al., Reference Buzanskas, Grossi, Ventura, Schenkel, Sargolzaei, Meirelles, Mokry, Higa, Mudadu, Silva, Niciura, Torres Júnior, Alencar, Regitano and Munari2014). This fact might be explained by the different genetic constitution of breeds. Variations in allele frequency, linkage disequilibrium and SNP coverage of the chip in the breed can affect the results. Some factors such as methodology and the number of animals used can also be responsible for these differences. The present study used a large number of animals and an innovative methodology and we believe that the results obtained are reliable for the breed and for future comparisons between breeds.
The identification of genome regions that affect economic traits in cattle is extremely important since knowledge of these regions will likely contribute in the future to the selection of these traits in breeding programs of the Nelore breed. Genes of great contribution to the variance of traits are candidates for future studies on causal mutations to compose SNP chips of low density and to help with the process of genetic evaluation at a better cost–benefit ratio.
Conclusions
The ssGBLUP methodology permitted to identify chromosome regions that were associated with BW, GBW, GWY and YH. The regions identified in this study help elucidate the genes that most contribute to the variance of the traits, permit a better understanding of the physiological process underlying the expression of phenotypes, and indicate candidate genes for future fine-mapping studies. Moreover, it evidences possible strong genetic differences across breeds, useful for future breeding comparison strategies.
Acknowledgments
The costs associated to genotyping of animals was supported by the thematic project ‘Genomic tools for the genetic improvement of economically important traits in Nelore cattle’ supported by Fundação de Amparo a Pesquisa do Estado de São Paulo (FAPESP grant numbers 2009/16118-5).
Supplementary material
To view supplementary material for this article, please visit https://doi.org/10.1017/S1751731117003068