Introduction
Muskmelon is a highly relished cucurbit because of its attractive fruit with unique aromatic musky flavour, sweet taste and high contents of vitamins and minerals. Muskmelon is extensively grown worldwide during frost free period (Munshi and Choudhary, Reference Munshi, Choudhary, Peter and Hazra2014). Melon (Cucumis melo L.) is an important vegetable crop cultivated mostly in tropical regions, and to some extent, in sub tropical regions of the world. The global production of melon is about 27.35 million metric tonnes from an area of 1.047 million ha (FAOSTAT, 2018). Although India stands 4th amongst the major producers of melon in the world after China, Turkey and Iran (FAOSTAT, 2018), it produces only about 1.261 million tonnes from 0.58 million ha with a productivity of 22.79 tonnes/ha (FAOSTAT, 2018; NHB, 2019). Worldwide, efforts to improve the shelf life, quality, disease and pest resistance and yield of melons are underway. For instance, germplasm curation and genetic improvement of melons are underway in China (Luan et al., Reference Luan, Delannay and Staub2008). In many countries, efforts are also being made to enhance the market class diversity of melons. The genus Cucumis, which includes cucumber (Cucumis sativus) and melon (Cucumis melo), has several wild African species, and it was considered that melon originated in Africa but cucumber originated in India because wild cucumber still exists in India and a closely related species lives in the Eastern Himalayas. However, Sebastian et al. (Reference Sebastian, Schaefer, Telford and Renner2010) reported that melon and cucumber both are of Asian origin, and a recent study established that Indian and African germplasm of melon are genetically distinct and supported independent domestication events (Gonzalo et al., Reference Gonzalo, Díaz, Dhillon, Reddy, Picó and Monforte2019). Cucumis melo is considered as one of the most diverse and highly polymorphic species in Cucurbitaceae family which comprises a large number of botanical varieties or horticultural groups, which may be a consequence of higher genetic diversity (Decker-Walters et al., Reference Decker-Walters, Chung, Staub, Quemada and López-Sesé2002). Classification of Cucumis melo into six horticultural groups cantalupensis (Cantaloupe and muskmelon), inodorous (winter melon), flexous (Long melon), conomon (Pickling melon), dudaim (pomegranate melon) and momordica (Sanpmelon) is widely accepted (Munger and Robinson, Reference Munger and Robinson1991; Robinson and Deckers-Walters, Reference Robinson and Decker-Walters1997). Later, Pitrat et al. (Reference Pitrat, Prohens and Nuez2008) classified these botanical groups into 15 varieties. Cantalupensis was classified into cantalupensis, reticulatus, adana, chandalak and ameri, flexuosus was classified into chate, flexuosus and acidulus, dudaim was classified into dudaim and chito and conomon was classified into conomon, makuwa, chinensis and tibish. Inodorus and momordica were not classified further. Muskmelon shows enormous variation in fruit traits such as size, shape, colour, taste, texture and nutritional composition across these botanical or varietal groups.
Improvement in yield and quality is generally achieved by selecting genotypes with desirable character combinations existing in nature or by hybridization. Large genetic diversity for various fruit traits in melon germplasm (Reddy et al., Reference Reddy, Munshi, Behera and Kaur2005; Dhillon et al., Reference Dhillon, Monforte, Pitrat, Pandey, Singh, Reitsma, Garcia-Mas, Sharma, McCreight and Janick2011; Pitrat, Reference Pitrat, Grumet, Katzir and Garcia-Mas2016), characterization of germplasm from different horticultural groups into different classes based on fruits quality and its nutritional compositions (Bhimappa et al., Reference Bhimappa, Choudhary, Sharma and Behera2018, Reference Bhimappa, Choudhary, Behera, Sharma, Zakir and Tomar2019) have been reported. However, the genetic diversity based on molecular markers is still less explored. Analysis of genetic diversity and population structure using molecular markers is highly useful in population differentiation. Simple sequence repeats (SSRs) in plant genomes provide unique opportunities to investigate genetic diversity as they are multi-locus, highly abundant in the genome, easy to use and low cost (Vignal et al., Reference Vignal, Milan, San Cristobal and Eggen2002). Past reports of genetic diversity in muskmelon (Lopez-Sese et al., Reference Lopez-Sese, Staub and Gomez-Guillamon2003; Staub et al., Reference Staub, López-Sesé and Fanourakis2004; Sensoy et al., Reference Sensoy, Buyukalaca and Abak2007; Luan et al., Reference Luan, Delannay and Staub2008) mostly used the C. melo accessions from one or few cultivar group, and mostly from a major geographical region. Traditional Indian muskmelon varieties (Kashi Madhu, Pusa Madhuras, Hara Madhu) commercially being grown are mainly from reticulatus group, characterized by sweet fruit with strong musky flavour and very poor in shelf life due to climacteric ripening. Later, few genotypes were introduced from cantalupensis group (Charentis type) with heavy netting on the rind, mild flavour and little improved shelf life. Recently, few specialty melon varieties from inodorous group (DHM 163/Pusa Sarda) were developed, which have fruits shelf life up to 20–30 d at room temperature due to non climacteric ripening behaviour, and have no musky flavour. Snapmelon (C. melo var. momordica) is being grown in northern Indian states of Haryana, Punjab and Rajasthan during kharif or rainy season, and these fruits are less sweet and sour in taste. Similarly Oriental melon (C. melo var. conomon) is being grown in southern Indian states of Kerala, Tamil Nadu for immature fruit used in culinary purposes (Fergany et al., Reference Fergany, Kaur, Monforte, Pitrat, Rys, Lecoq, Dhillon and Dhaliwal2011). A rich diversity of muskmelon varieties are found in India, as well as other musk melon growing countries such as China, Turkey and Iran. However, the genetic diversity of musk melon is less explored compared to the available phenotypic diversity in this species. In this study, we sought to investigate the genetic diversity and population structure of 46 muskmelon genotypes selected from 4 different horticultural or 6 varietal groups (inodorus, cantalupensis, momordica, conomon, and one accession from callosus), using 38 polymorphic SSRs.
Materials and methods
Plant materials
Forty-six accessions belonging to 4 different horticultural or 6 varietal groups of inodorus, cantalupensis, momordica, conomon and one accession from callosus were collected from different Indian agro-climate regions and maintained at the research farm of Division of Vegetable Science, IARI, New Delhi. The horticultural or varietal groups, places of collection, and morphological features of the genotypes are mentioned in online Supplementary Tables S1 and S2.
Genomic DNA extraction and SSR genotyping
For DNA extraction, fresh young leaves were collected in ice from field and stored in a −20° freezer, with proper labeling. Genomic DNA was extracted using the conventional CTAB method, with minor modifications (Murray and Thomson, Reference Murray and Thompson1980). The quality of DNA quantity was assessed on 0.8% agarose gel.
Fifty polymorphic SSR primer pairs uniformly distributed across the muskmelon genome were chosen from a previous study (Zhu et al., Reference Zhu, Guo, Song, Luan, Hu, Sun and Yang2016). PCR amplification was performed in 10 μl reaction mixture comprising of 1 μl of PCR buffer (1X), 0.2 μl of dNTP (0.25 mM), 0.5 μl of each primer (l M), 0.2 μl of Taq DNA polymerase, 2 μl of genomic DNA (20 ng) and 6.6 μl of nuclease free water. The PCR protocol comprised of initial denaturation step at 94°C for 4 min, followed by 35 cycles of 94°C for 30 s, annealing at 55°C for 30 s, elongation at 72°C for 1 min, and a 8 min of final extension at 72°C. The amplified products were resolved on 4% ultra high resolution agarose gels and visualized using Syngene Gel Documentation System.
Genetic diversity analysis
The major allele frequency, polymorphism information content (PIC), gene diversity and heterozygosity were computed using Power Marker software version 3.25 (http://www.powermarker.net) (Liu and Muse, Reference Liu and Muse2005). Genetic distance based clustering was done using unweighted pair-group method for arithmetic average (UPGMA) method. The dendrogram was constructed using MEGA 7.0 software (Tamura et al., Reference Tamura, Dudley, Nei and Kumar2007). Principal component analysis (PCA) was performed using DARwin 6.0 programme (Perrier and Jacquemoud-Collet, 2006). To investigate population differentiation, analysis of molecular variance (AMOVA) and estimation of pair wise F statistics (F ST) among populations was performed using Genalex program (Peakall and Smouse, Reference Peakall and Smouse2006).
Population structure analysis
STRUCTURE v. 2.3.4 software was used to characterize population structure, by assigning accessions to subpopulations based on genetic similarity. The program employs a Bayesian clustering approach, without any previous knowledge on genotype affinities and assumes the model of admixture. (Pritchard et al., Reference Pritchard, Stephens and Donnelly2000; Falush et al., Reference Falush, Stephens and Pritchard2003). The number of presumed populations (K) was set from 1 to 10, and each K value was run in five replicates. For each run, the burn-in number and Markov Chain Monte Carlo (MCMC) were set to 150,000 each, and iterations were set to 10. The optimal number of subgroup populations was determined by plotting the K value against the estimated Delta K (log probability for the rate of change of the data), using the Evanno Test (Evanno et al., Reference Evanno, Regnaut and Goudet2005). The run with the highest likelihood was then used to allocate each accession to subgroups of populations, using ‘Structure harvester’ (Earl and vonHoldt, Reference Earl and VonHoldt2012).
Results
Genetic diversity
Out of the 50 SSRs initially selected, 38 markers were highly polymorphic across all the accessions, generating 76% average polymorphism. The remaining 12 markers were monomorphic, and hence they were excluded from analysis. The list of 38 polymorphic markers, along with their primer sequence, is mentioned in online Supplementary Table S3. A total of 99 alleles were identified among 46 muskmelon accessions, with an average of 2.06 alleles per locus (Table 1). The number of allele per locus varied from 2 to 5. The major allele frequency varied between 0.33 and 0.95, with a mean value 0.62. Heterozygosity for individual loci among accessions ranged from 0.00 to 0.21, and the highest value (0.21) was observed for the CMCTN71 marker. The gene diversity and PIC values varied from 0.08 to 0.72 and 0.07 to 0.67, with an average of 0.47 and 0.38, respectively. The primer which showed the highest gene diversity and PIC values was DM0913. The lowest gene diversity and PIC values were observed for the primer, DE185.
List of polymorphic markers along with major allele frequency, allele number, gene diversity, heterozygosity and PIC values

Population structure
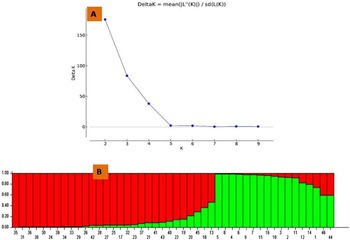
Model-based cluster analysis based on a Bayesian approach was carried out to infer the population structure of 46 muskmelon accessions, using 38 genomic SSR markers. The LnP (D) as well as Evanno's ΔK identified two genetically distinct populations (Fig. 1). The individual membership coefficients were used to assign individual genotypes to sub populations. The sub population I (shown in red) consists of 29 (63.04%) accessions while the sub population II (shown in green) consists of 17 (36.95%) accessions, respectively. The grouping of accessions as per the two structure groups is given in Table 2. The number of pure and admixed individuals in sub population I was 26 (89.6%) and 3 (10.34%), respectively. These numbers in sub population II were 14 (82.35%) and 3 (17.64%), respectively. Individuals were considered admixed if they showed at least 20% ancestry from a different population. Sub population I consists of all the cantalupensis accessions (n = 28) from both varietal groups, cantalupensis and reticulatus, and one accession (DG 12) from callosus type, which is possibly a natural intermediate type between cantalupensis and callosus. Sub population II consists of accessions from momordica, inodorous and conomon horticultural groups.
(a) Population structure analysis of muskmelon accessions with delta K values for different assumed (K) populations. (b) Population structure analysis using STRUCTURE 3.2.1, a distribution and classification of 46 muskmelon accessions into two subpopulations.

Distribution of muskmelon accessions into two sub-groups based on SSR markers

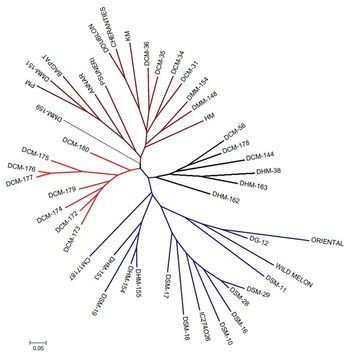
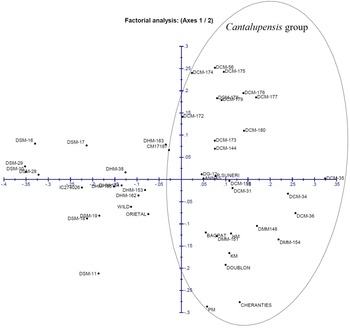
Clustering based on molecular data using the Unweighted Pair Group Method with Arithmetic Mean (UPGMA) method separated the accessions into two major groups and thus supported the result of STRUCTURE analysis (Fig. 2). The upper branches of the tree are comprised of mostly accessions from the cantalupensis horticultural group, consisting of two varietal groups: reticulatus and cantalupensis. The lower branches of the tree are comprised of accessions belonging to other horticultural groups. The branches in the phylogenetic tree clearly formed subgroups according to their botanical classification, i.e. different horticultural groups. Three accessions (DCM 56, DCM 144 and DCM 178), which belong to the cantalupensis subgroup, were separated from the rest cantalupensis accessions, and branched with other horticultural groups in the lower part of the tree with exotic lines introduced from other countries. The genotype, DG 12, which belongs to Cucumis melo var. callosus, oriental melon, and wild melon grouped closely with the momordica accessions. PCA was also applied to characterize the accessions in the present study. The PCA also well separated the cantalupensis accessions from the momordica, inodorus and conomon accessions. PC1 and PC2 explained 17.33 and 9.72% variation, respectively (Fig. 3). A three dimensional PCA graph based on genotypic data of polymorphic SSR markers in 46 Muskmelon accessions is presented in online Supplementary Fig. S1.
Dendrogram of 46 muskmelon accessions based on UPGMA clustering.

Two dimensional PCA graph based on genotypic data of polymorphic SSR markers in 46 Muskmelon accessions.

Analysis of genetic variance
Comparing the two groups, AMOVA results indicated that 18% of the total genetic variation was partitioned among populations, 68% among individuals and 14% within individuals (Table 3). Calculation of Wright's F statistic at all SSR loci revealed that F IS was 0.82, and F IT was 0.85. Determination of F ST for the polymorphic loci across all accessions showed F ST as 0.18, which implies high genetic variation (Table 3).
Analysis of molecular variance (AMOVA) for 46 muskmelon accessions from 2 groups based on 38 polymorphic SSR data

Discussion
Understanding genetic diversity is crucial for crop improvement as it forms the basis of parent selection. SSR markers provide a low cost method of assessing genetic diversity in crop plants. (Reddy et al., Reference Reddy, Venkat, Reddy, Aswath, Avinash, Nandini and Sreenivasa Rao2016) In the present investigation, 38 polymorphic SSRs were used to assess the genetic diversity among 46 accessions of muskmelon, selected from 4 different horticultural groups; inodorous, cantalupensis, momordica and conomon. Altogether, 6 varietal groups were represented by these four horticultural groups. One accession from Cucumis callosus and another accession from an unidentified wild species were also included in the germplasm collection. The 38 SSRs generated a total of 99 alleles from 46 accessions, with an average of 2.06 alleles per locus. This result is similar to those reported earlier by Emmanouil et al. (Reference Emmanouil, Antonio, Abdelhak, Zacharias, Tefkros, Ioannis and Panagiotis2009), Escribano et al. (Reference Escribano, Lazaro, Cuevas, Lopez-Sese and Stau2012) and Reddy et al. (Reference Reddy, Venkat, Reddy, Aswath, Avinash, Nandini and Sreenivasa Rao2016), but lower than those reported by Nakata et al. (Reference Nakata, Staub, López-Sese and Katzir2005), Raghami et al. (Reference Raghami, López-Sesé, Hasandokht, Zamani, Moghadam and Kashi2014) and Hu et al. (Reference Hu, Wang, Su, Wang, Li and Sun2015), using different germplasm. The level of diversity observed here is comparable to that of traditional Greek and Cypriot cultigens, and also to that of Spanish melons found in the Madrid province. However, the level of diversity is lower than that of Japanese accessions and also than that of Iranian accessions, along with some exotic accessions. The number of allele per locus ranged from 2 to 5. The major allele frequency varied between 0.33 and 0.95, with a mean value 0.62. Heterozygosity for individual loci among accessions ranged from 0.00 to 0.21, and the highest value (0.21) was observed for the CMCTN71 marker. Mean heterozygosity was estimated to be 0.07. Wang et al. (Reference Wang, Gao, Yang, Xu, Zhu, Yang, Li, Hu, Sun and Ma2018) also reported a mean heterozygosity of 0.06 in a set of oriental thin-skinned melons from India and China, which is close to the present findings. The low heterozygosity observed by all the SSR loci suggests that the accessions used in this study have already attained high level of homozygosity. The remaining low level of heterozygosity may be important for maintaining genetic polymorphisms in the population (Yan et al., Reference Yan, Yang, Shah, Sánchez-Villeda, Li, Warburton and Xu2010). The gene diversity and PIC values varied from 0.08 to 0.72 and 0.07 to 0.67, with an average of 0.47 and 0.38, respectively. The primer which had the highest gene diversity and PIC values was DM0913. The lowest gene diversity and PIC values were observed for the primer DE185. The average PIC value of 0.38 indicates the presence of intermediate level of polymorphism. This result is in close proximity with that of earlier reports by Fergany et al. (Reference Fergany, Kaur, Monforte, Pitrat, Rys, Lecoq, Dhillon and Dhaliwal2011) and Reddy et al. (Reference Reddy, Venkat, Reddy, Aswath, Avinash, Nandini and Sreenivasa Rao2016), but lower than that reported by Raghami et al. (Reference Raghami, López-Sesé, Hasandokht, Zamani, Moghadam and Kashi2014) and Wang et al. (Reference Wang, Gao, Yang, Xu, Zhu, Yang, Li, Hu, Sun and Ma2018). Reddy et al. (Reference Reddy, Venkat, Reddy, Aswath, Avinash, Nandini and Sreenivasa Rao2016) reported average gene diversity of 0.43 in a set of Indian melon accessions, which is comparable our present observation (0.47). Model based population structure analysis using STRUCTURE identified 2 subpopulations among the 46 accessions. Sub population I consists of all the cantalupensis accessions (n = 28) from both varietal groups cantalupensis and reticulatus and one accession (DG 12) from callosus type, which is thought to be a natural intermediate type between cantalupensis and callosus. Sub population II consists of accessions from momordica, inodorous and conomon horticultural groups. Horticultural groups, momordica and conomon, come under the agrestis sub-species and harbour many resistance genes. Currently, cantalupensis and inodorus both are classified under the melo sub-species; still, here inodorus was separated from the cantalupensis group which may be due to its non-climacteric nature and lack of musky flavour. An earlier investigations had also reported the presence of two structure groups (K = 2) among musk melon accessions from India, using SSR markers (Reddy et al., Reference Reddy, Venkat, Reddy, Aswath, Avinash, Nandini and Sreenivasa Rao2016).
Clustering based on molecular data using the UPGMA also separated the 46 accessions into two major groups, thus, supported the result of STRUCTURE analysis. The upper branches of the tree are comprised of mostly accessions from the cantalupensis horticultural group, consisting of two varietal groups: reticulatus and cantalupensis. Majority of the accessions in this group are Indian muskmelon varieties such as Punjab Sunheri, Kashi Madhu, Pusa Madhuras and Hara Madhu, having sweet juicy fruits with strong aroma, and are cultivated commercially in North Indian plains. One accession, DMM 159, from this group was later released as Pusa Madhurima by IARI, New Delhi. The lower branches of the tree are comprised of accessions belonging to other horticultural or varietal groups. The branches in the phylogenetic tree clearly formed subgroups according to their botanical classification. Three accessions (DCM 56, DCM 144 and DCM 178), which belonged to the cantalupensis subgroup, were separated from the rest of the cantalupensis accessions and branched with other horticultural groups, in the lower part of the tree with exotic lines introduced from other countries. The genotype, DG 12, which belonged to Cucumis melo var. callosus, oriental melon, and wild melon, grouped closely with the momordica accessions. PCA was also applied to characterize the accessions in the present study. The PCA also well separated the cantalupensis accessions from the momordica, inodorus and conomon accessions. These analyses showed that cantalupensis accessions were largely distinct from all other botanical groups. The cantalupensis accessions show climacteric fruit ripening, have strong musky flavour; therefore, they are easily distinguished from the other types of melon from inodorous group, which shows non-climacteric fruit ripening. PC1 and PC2 explained 17.33 and 9.72% variation, respectively. Although almost all the cantalupensis accessions grouped together, the Indian and exotic accessions within this group were clearly diverged. Earlier Anamika et al., (Reference Anamika, Bal, Fergany, Kaur, Singh, Ajaz, Singh, Monforte and Dhillon2012) showed regional differentiation among Indian accessions and a differentiation between Indian and exotic accessions, based on SSR analysis. Here, we observed little inconsistencies between botanical classification and marker based classification as all the cantalupensis accessions did not form a single group. However, most of the cantalupensis accessions clustered together. The lack of consistency in the clustering of accessions from the same botanical groups was also observed by Soltani et al. (Reference Soltani, Akashi, Kashi, Zamani, Mostofi and Kato2010) and Aragao et al. (Reference Aragao, Torres Filho, Nunes, Queiróz, Bordallo, Buso, Ferreira, Costa and Bezerra Neto2013). One of the reasons for this variation may be the inevitable out-crossing among melon genotypes. Intermediate forms might have been formed among the different groups due to the old farming practices employed by local small-scale melon producers in the different countries.
AMOVA results indicated that 18% of the total genetic variation was partitioned among populations, 68% among individuals and 14% within individuals. Calculation of Wright's F statistic at all SSR loci revealed that F IS was 0.82, and F IT was 0.85. Determination of F ST for the polymorphic loci across all accessions has shown F ST as 0.18 which implies high genetic variation. High F IT value indicates lack of equilibrium across subgroups. Overall, the results show deviation from the Hardy-Weinberg frequencies.
Analysis of genetic diversity is crucial for its utilization in crop improvement. It also helps in maintenance of biodiversity, essential to provide genetic reservoir from which future crops will be developed (Kersey et al., Reference Kersey, Collemare, Cockel, Das, Dulloo, Kelly, Lettice, Malécot, Maxted, Metheringham and Thormann2020). The present study has shown the existence of sufficient variation in country's muskmelon germplasm resources, which is comparable to the level of diversity observed in Greek, Spanish and Chinese accessions. Investigation of population structure has shown the presence of two structure groups (K = 2) that were primarily separated on the basis of their botanical classification. Significant variations between the two structure groups, among and within individuals were identified. The present study also provides more evidence on the relationship between botanical and marker based molecular classification. Our study shows that although these two systems of classification are largely consistent, the marker based classification is better at classifying the cantalupensis accessions. Variations within horticultural groups were also detected using molecular markers. Many of the wild accessions used in this study contain beneficial genes, which can be used in breeding programs by selecting parents from diverse groups. Overall, the present study supports the existence of sufficient variation among muskmelon accessions in India and provides more evidence on the relationship between botanical and marker based molecular classification of muskmelon accessions.
Supplementary material
The supplementary material for this article can be found at https://doi.org/10.1017/S1479262122000193.
Acknowledgements
The authors are grateful to ICAR-Indian Agricultural Research Institute, New Delhi, India, for providing research financial support and laboratory facilities during this study.
Author contributions
Harshawardhan Choudhary and A.D Munshi conceived and designed the experiments. Koushik Saha carried out the experiment and statistical analysis with assistance from Harshawardhan Choudhary and Dharmendra Singh. Koushik Saha wrote the manuscript. Harshawardhan Choudhary made necessary corrections. All the authors discussed the results and commented on the manuscript.
Conflict of interest
The authors declare that they have no conflicts of interest.