1 Introduction
Web services are becoming more important to the daily use of computers. People use Web services to find the weather, travel schedules, and the best restaurant while traveling. As tasks get more complex, allowing the computer to do more of the work is necessary. The Semantic Web addresses this concern. Ontologies allow Web services to be machine readable, and thus software agents can handle more of the decision making in completing a task. Functioning as a Web Service API, they allow users to use services that were independently developed to work a task, facilitate the use of agents to collect, process, and exchange information necessary to complete the task, and permit Web service requests based on a concept.
While the use of ontologies to support the Semantic Web is growing, so is the use of resource-constrained computers, such as mobile devices. The International Data Corporation predicts that mobile devices shipments are expected to reach 82 million by 2011 as reported by Cellular-News (2007). With enhanced Web browsing and processing ability, mobile devices are becoming more like computers and less like simple PDAs and phones. A study of mobile device use found that the users accessing Web services doubled in 2009 to over 63 million with 22 million doing so daily as reported in Mobile Marketer (2009).
However, while these machines are evolving in capability, they are limited by power usage and therefore performance constrained for the foreseeable future. At the same time, ontologies and Web services are becoming larger and more complex. The Full Suggested Upper Merged Ontology (SUMO) is a proposed high level ontology that other application specific ontologies could build upon. At present it contains 20 000 terms, 70 000 axioms, and 3000 rules from Ontology Portal (2009). Seidenberg and Rector (Reference Seidenberg and Rector2006) found, using the GALEN medical ontology, that most ontology reasoners currently available cannot handle the full ontology and it must be segmented to be processed on a personal computer. Clearly, it would be difficult for a resource-constrained device to download and process an ontology this large in a reasonable amount of time.
It is impractical to expect a Blackberry to download and reason across an ontology with 10 000 nodes in a reasonable time, when it only needs a small portion of the ontology to perform its work. As Manning et al. (Reference Manning, Raghavan and Schütze2006) observed, there is a computational penalty if an agent has to perform reasoning across a large ontology, if it only requires a small subset of it. In these cases, a reduction of the service ontology, geared to the agent's request, would enable the agent to access what is necessary to complete its task.
Creating a reduced ontology of high quality is a nontrivial task. Such a reduced ontology must be complete enough to allow usefulness, but contain minimal extraneous information. It must also be small enough for the agent to handle. If we are seeking more automation in Web service discovery and use, it makes sense to automate the reduction process. The question is, when is a reduced ontology ‘good enough’ to be used instead of the original complete ontology?
We first considered the idea of using the Web server containing an ontology to perform the reasoning and return the results to the client device. This is the typical model when using ontologies as a knowledge store or for concept translation. When using ontologies for service discovery, however, there are a few drawbacks to this approach.
First, it limits the flexibility of the client in making decisions based on what is contained within the ontology. Reasoning might be adapted as the structure and concepts of the ontology are discovered. It would be difficult, both conceptually and with respect to bandwidth, to pass enough information to the server in advance to handle the user's full task.
Second, it prevents the agent from caching the ontology locally and reusing it for a later request. The ontology structure would be hidden from the client if the server simply returned the results. Any change in the client's request would require communication between the agent and the server and would use more of the mobile device's limited bandwidth.
Finally, forcing the service to provide reasoning for multiple requests simultaneously impacts the server's resources. For a gateway Web server that takes thousand of requests a minute, this could lead to a time delay for each request. Using our reduction approach, the server would take a performance hit in creating the reduced ontologies, but the download time, reasoning time, and memory requirements for the mobile device would be significantly shortened, giving an overall performance increase. With limited resources available, optimizing the mobile device performance is more important.
In this paper, our aim is to establish a predictive model that uses metrics to evaluate the quality and performance of a reduced ontology. The quality of a reduced ontology can be defined in two parts. First, it needs to be small relative to the original ontology, to make the sub-graphing worthwhile. Second, it needs to retain all of the information in the ontology relative to the concept of interest (COI). We measure these two aspects of quality using an information measure and a performance measure defined in Section 3.
Our approach is dynamic, meaning it can operate at runtime, as clients make requests. It employs easy-to-calculate metrics combined in a predictive model based on previous statistical evidence, allows a dynamic creation of reduced ontologies, as well as speedy selection of reduced ontologies that will be good substitutes for the original ontology. By using these smaller reduced ontologies for downloading and reasoning over, the overall performance of the mobile devices are improved.
A linear regression model was created for information content in a previous study (Schrimpsher & Etzkorn, Reference Schrimpsher and Etzkorn2009b). However, this study only focused on a single domain, travel. In order to have confidence in a domain-independent model, as well as creating a model for performance, this study is looking at multiple domains of ontologies in order to create the model.
In this paper, we create a linear regression model of previously defined ontology metrics (Yao et al., Reference Yao, Orme and Etzkorn2005; Orme et al., Reference Orme, Yao and Etzkorn2006a, Reference Orme, Yao and Etzkorn2006b; Schrimpsher & Etzkorn, Reference Schrimpsher and Etzkorn2009a) to predict both the informational quality and performance of the reduced ontologies. Section 2 gives an overview of ontologies, ontology metrics, and previous work to reduce ontologies. Section 3 provides the methods we used to conduct this study. Section 4 provides the statistical results and models created. Finally we will conclude and discuss future work in Section 5.
2 Background
2.1 Web service ontology
Vrandecic and Sure (Reference Vrandecic and Sure2007) define a Web service ontology as both the terminology and information required to access Web services by providing a machine-readable description of a group of services and their consequences. Martin et al. (Reference Martin, Paolucci, McIlraith, Burstein, McDermott, McGuinness, Parsia, Payne, Sabou, Solanki, Srinivasan and Sycara2004) demonstrated this ability through a specific implementations of OWL, known as OWL-S, which was designed to work with existing Web service protocols, including the Web service description language (WSDL) and the Simple Object Access Protocol (SOAP). OWL-S enhances WSDL with the ability to incorporate semantics into Web service discovery and use. The utility of OWL-S has been demonstrated through its use in enhancing Amazon's WSDL-based Web services. In this project, it was demonstrated that through ontology-based semantics a client agent can query Amazon's database without requiring human interaction, as would have been necessary if using only WSDL.
Hull (Reference Hull2005) advanced the Semantic Web Service Ontology initiative given by DAML (2005) by integrating the Process Specification Language with Web services. He integrated OWL-S style atomic services, WSDL like messages, and process and data flow models of the Web services. This yields semantically accessible Web service discover and translations between semantic concepts on the client and server sides.
These are some examples of how semantic Web services are incorporating ontologies into their methods for discovery and communications. Our research is not tied to these technologies, however, and is flexible enough to work with emerging types of semantic Web services that incorporate ontologies.
2.2 A reduced ontology
Seidenberg and Rector (Reference Seidenberg and Rector2006) demonstrated that very large ontologies are difficult to process and reason over. In the database world, large data sets are filtered down into smaller sets through views. There has been some research into creating a database type ‘view’ for ontologies (e.g. Stuckenschmidt & Klein, Reference Stuckenschmidt and Klein2003; Volz et al., Reference Volz, Oberle and Studer2003; Noy & Musen, Reference Noy and Musen2004; Jiménez-Ruiz et al., Reference Jiménez-Ruiz, Berlanga, Nebot and Sanz2007a, Reference Jiménez-Ruiz, Nebot, Berlanga, Sanz and Rios2007b). This idea treats the full ontology as a database and queries for one or more COIs.
To help solve this problem, Jiménez-Ruiz et al. (Reference Jiménez-Ruiz, Nebot, Berlanga, Sanz and Rios2007b) built a Protege-based query language, called OntoPath. Much like a database query, OntoPath allows users to query an ontology for concepts and relationships to retrieve an ontology view, or ‘personalized modules’. An OWL ontology is stored in a database where OntoPath can query it much like a traditional database. While OntoPath's XPath-based query language is relatively easy to use, it requires the user to understand more about the ontology being queried than a typical semantic Web user or agent would understand.
Volz et al. (Reference Volz, Oberle and Studer2003) acknowledge that the semantic Web must support the ‘needs of specific user communities’ and create particular information for them. To fill this need, they created a ‘view language’. This view language is designed to show users a view of an ontology based on a query or set of queries in an extension of the RDF Query Language (RQL). The views they create are designed to be indistinguishable from the source ontology by the agent. However, they do require the use of an ontology to describe their view language to a user. Updates of these views are also limited and the semantic characterizations of the views cannot be computed automatically. While this is a step in the direction of dynamic reduced ontologies, it still requires the user to build specific queries to get the view they want and does not say anything about the quality of the view created. The burden is placed on the user agent.
In order to limit the information, a user has to process when interacting with large ontologies, Noy and Musen (Reference Noy and Musen2004) created a traversal algorithm. This algorithm builds a ‘traversal view’ from a COI or set of COIs by following property resources out a set distance defined by the user. They define a view built by a query, such as the Jiménez-Ruiz et al. (Reference Jiménez-Ruiz, Nebot, Berlanga, Sanz and Rios2007b) OntoPath method as an ontology view. However, they realize that this view does not allow a user to see all concepts closely related to their COI. They propose a traversal view to complement the query views to serve this need. Again, although this is a step in the direction of dynamic sub-graphing to create reduced size ontologies, it is still targeted toward users interacting with a tool to access information contained within a classifying ontology, such as a genome.
There has also been research into creating modular rather than monolithic ontologies that could be merged by the agent when they are needed. Stuckenschmidt and Klein (Reference Stuckenschmidt and Klein2003) defined an architecture to create modular ontologies during the design and development phase. Their goal is to create modular ontologies with loose coupling, self-containment, and integrity. The architecture uses queries between modules to map the modular ontologies together when needed. This allows reasoning across multiple modules through these mappings. A necessary piece of this architecture is a method for detecting changes in modules that effect a mapping. However, these modules are defined at development time and do not address the specific needs of an agent dynamically.
Kusnierczyk (Reference Kusnierczyk2008) looked at partitioning the Gene Ontology by using the Taxonomy of Species to define how to automatically generate the slimmed modules. The framework relates concepts in the Gene Ontology to the Taxonomy of Species through validity, specificity, and relevance.
Grau et al. (Reference Grau, Kazakov and Sattler2007) developed a method to extract reusable fragments, or modules, from ontologies based on a given set of terms. They show that minimal module extraction is not algorithmically solvable. Their syntactic locality algorithm was compared with Noy and Musen's (Reference Noy and Musen2003) PROMPT-FACTOR algorithm and Grau et al.'s (Reference Grau, Parsia, Sirin and Kalyanpur2006) Modularization Algorithm. Grau et al. (Reference Grau, Kazakov and Sattler2007) found in every case, their locality algorithm created smaller modules than either of the other two algorithms using a series of complex and simple ontologies. This work is similar to ours in that Grau et al. (Reference Grau, Kazakov and Sattler2007) wanted to create fragments of large ontologies. It is, however, still a static model designed to create reusable modules rather than a dynamic method, such as our method, for creating reduced ontologies. However, their success with syntactic locality gives confidence that a dynamic locality-based sub-graphing algorithm such as the algorithm we use in our method is a reasonable approach.
2.3 Ontology metrics
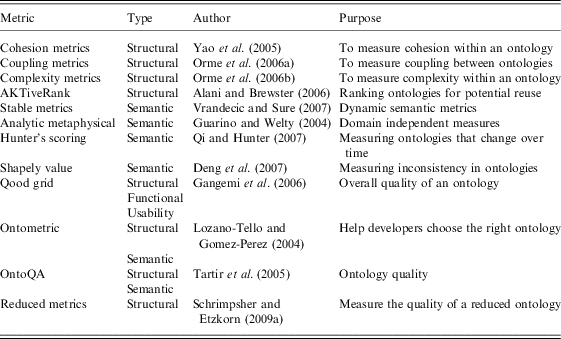
Metrics are widely used in software engineering and information retrieval to judge quality. Various metrics to measure cohesion, coupling, and complexity in software engineering, and the use of recall, and precision metrics to determine the accuracy of information retrieval queries and approaches are all familiar topics in these fields (e.g. Etzkorn et al., Reference Etzkorn, Gholston, Fortune, Stein, Utley, Farrington and Cox2004; Manning et al., Reference Manning, Raghavan and Schütze2006). Metrics have recently been applied to ontologies as well. A summary of ontology metrics is given in Table 1.
Overview of ontologies metric studies

Much early work in ontology metrics translated standard object-oriented software metrics to apply to ontologies rather than to object-oriented software. For example, Yao et al. (Reference Yao, Orme and Etzkorn2005) applied cohesion metrics to RDF-based ontologies. They defined Number of Roots (NoR), Number of Leafs (NoL), and Average Depth of Inheritance Tree–Leaf Nodes (ADIT-LN) metrics. Then these ontologies were evaluated by experts and correlated with the metric values. There was a medium to high correlation between the cohesion metrics and the experts’ opinions of the cohesion of the ontology.
In later work, Orme et al. (Reference Orme, Yao and Etzkorn2006a) applied coupling metrics to ontologies. These metrics included number of external classes (NOEC), reference to external classes (REC), and referenced includes (RI). Again they found that these metrics were highly correlated with expert analysis of the coupling of the ontology.
Most recently, Orme et al. (Reference Orme, Yao and Etzkorn2006b) applied complexity metrics to ontologies. These metrics included number of classes (NoC), number of Fan-outs (NoF) and ADIT-LN. Once again these metrics were highly correlated with expert analyses of the ontologies. We can take from these studies a confidence that the quality of ontologies in general can be measured by metrics.
Alani and Brewster (Reference Alani and Brewster2006) created AKTiveRank, a system for ranking ontologies for their reuse potential. AKTiveRank uses an idea similar to the page rank system of Google. Using the Java Universal Network/Graph framework (JUNG) query system to query the RDF ontologies, AKTiveRank makes four measurements. The first of these metrics is the Class Match Measure (CMM), which measures the coverage of an ontology over a set of terms. Second, the Density measure calculates the information content of a class within an ontology. This includes ideas, such as number of subclasses and number of properties. Third, the Semantic Similarity Measure (SMM) calculates, within an ontology, how close together classes are that match the query. Finally, the Betweenness measure calculates the number of shortest paths that pass through each node in the graph. Alani and Brewster compared their results with expert analyses and found that the CMM matched up best with the experts, but using a weighting of 0.4(CMM), 0.3(BEM), 0.2(SMM), and 0.1(DEM) on the four metrics yielded a total score that was highly correlated with expert opinion.
Vrandecic and Sure (Reference Vrandecic and Sure2007) extend ontology metrics from purely structural metrics into semantic metrics. They also introduce the concept of normalizing ontologies prior to computing the metrics, which they argue allows them to ‘apply known structural metrics in a semantics-aware way’. A ‘stable metric’ refers to a metric that maintains its meaning even as new axioms are added to the ontology. They argue that both of these properties allow them to measure semantic metrics in a dynamic environment.
In the same vein, Guarino and Welty seek to find ‘analytic metaphysical’ (Guarino & Welty, 2004) measures of ontologies that are valid regardless of the ontology domain or structure. These include ideas of essence, rigidity, identity, and unity. However, this framework deals with individual properties and not with the quality of the ontology of a whole, except perhaps by uniting the metrics for individual axioms (Guarino & Welty, 2004).
Lozano-Tello and Gomez-Perez (Reference Lozano-Tello and Gomez-Perez2004) created a tool, ONTOMETRIC, to measure the quality and usefulness of an ontology relative to the system needs. This method uses 160 characteristics, which Lozano-Tello and Gomez-Perez call their multilevel framework of characteristics. Their characteristics were validated by 10 ontology experts. They further categorized these characteristics into five domains including content, language, methodology, tools, and costs. Rather than confine themselves to one ontology language, they build a multilevel tree of characteristics (MTC) based on a reference ontology, which includes generic items, such as ontology, class, attribute, instance, relation, and axiom. ONTOMETRIC is a semi-automated system that works as a decision aid to help developers choose the right ontology given the requirements for the system (Lozano-Tello & Gomez-Perez, Reference Lozano-Tello and Gomez-Perez2004).
Tartir et al. also created a tool for measuring the quality of an ontology, called OntoQA. This tool analyzes the ontology schema and the knowledge bases it describes through a set of metrics. These metrics are defined in two categorize, schema metrics and instance metrics. Schema metrics include relationship richness, attribute richness and inheritance richness. Instance metrics include two more categories, knowledge base metrics and class metrics. Class richness, average population and cohesion are included in knowledge base metrics, while importance, fullness, inheritance richness, relationship richness, connectivity, and readability make up the class metrics. They use these OntoQA and these metrics to analyze a number of ontologies (Tartir et al., Reference Tartir, Arpinar, Moore and Sheth2005).
We previously (Schrimpsher & Etzkorn, Reference Schrimpsher and Etzkorn2009a) defined five new metrics that are intended to measure the information content and performance speedup in reduced ontology relative to the original ontology. The informational metrics include Proximity, Relevance, and Completeness (Schrimpsher & Etzkorn, Reference Schrimpsher and Etzkorn2009b). The performance metrics include Size and Compactness. These metrics were measured, given a specific COI, against mechanically generated reduced ontology candidates. Multiple queries were applied to both the original ontology and the candidate ontologies to compute mean average recall (MAR). A significant correlation was found between all the informational metrics and MAR (Schrimpsher & Etzkorn, Reference Schrimpsher and Etzkorn2009b). A linear regression model using these metrics along with other structural metrics was constructed for a group of travel agency ontologies (Schrimpsher & Etzkorn, Reference Schrimpsher and Etzkorn2009b). However, by building the model on a single domain, it runs the risk of being domain specific. In this new study, we expand the model to multiple domains to create more confidence it is domain agnostic and can operate over any domain.
3 Research description
The purpose of this study is to demonstrate that some subset of the structural metrics chosen can predict both the information quality of a reduced ontology compared with the original ontology, and the performance advantage provided by the reduced ontology relative to the original ontology. First, we choose the ontologies and queries for the study. Then reduced ontology candidates were generated automatically for each ontology. Next, MAR and MAP were computed for each reduced ontology relative to its original ontology. Finally, the selected metrics were applied to each reduced ontology candidate and used to generate a regression model to predict MAR and MAP. Each of these steps is described in detail in the following sections.
3.1 Definition of quality and performance
We define a ‘good’ reduction in two ways, informational quality and performance. When creating a reduced ontology, the independent quality of the base ontology is ignored. Rather, the base ontology is considered the ‘gold standard’ from an information retrieval perspective. Information quality determines how well COI queries were answered on the reduced ontology, relative to how those same queries previously were answered on the base ontology. On the other hand, performance measures the download and processing speed improvement for the client for the reduction versus the original ontology.
To measure informational quality, we use MAR. From information retrieval, recall is defined as the ratio of the number of items returned from a query in the reduced ontology to the number of items returned in the original ontology. Recall is computed for each of the queries for an ontology and the mean of these recall scores forms the MAR. Thus, MAR measures the average amount of information retained in a reduced ontology relative to the COI.
To measure performance, we use MAP. Performance is computed by taking the ratio of time required for a mobile device to download and process a reduced ontology versus its base ontology. This measures the speedup of handling the reduced ontology. This is performed in a simulated mobile device environment multiple times. The average speed up is the MAP score.
3.2 Ontology and concept of interest selection
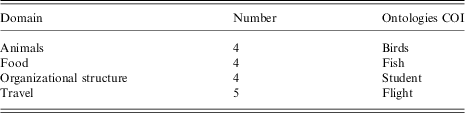
In this study, we selected four domains to pull ontologies from. There are 21 ontologies in total coming from the domains of food (5), travel (4), animals (4), and organizational structure (4). These ontologies were implemented in OWL, with a total of 829 named classes, to analyze in this paper. A common COI was chosen for each domain as a sample request a mobile device's agent might make. These COIs are show in Table 2.
Overview of ontologies selected for study
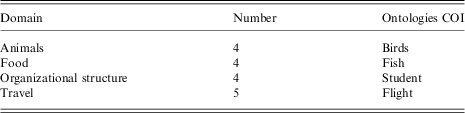
Based on the COI, seven queries for each domain were created by five unaffiliated volunteers. These queries represent information a task a client using a mobile device might to perform in that domain. These queries were applied to each ontology in the domain. The results of these queries are used to calculate MAR for each reduced ontology.
3.3 Constructing reduced ontologies
An OWL ontology can be viewed as a graph, where the nodes are vertices and relationships, including both inheritance and property relations, are edges. A reduced ontology is defined as a subset of nodes and relationships from a base ontology that together form a smaller ontology. A reduced ontology should contain a subset of information contained in the base ontology specific to a COI and exclude non-relevant information.
A modified traversal algorithm created in a previous study (Jiménez-Ruiz et al., Reference Jiménez-Ruiz, Nebot, Berlanga, Sanz and Rios2007b) was run on the ontologies with each node as the center. Each ontology generated N sub-graphs, where N is the number of nodes in the original ontologies. There is no claim this is the only way, or even the best way, to create reduced ontologies, but it is efficient and mechanical. The traversal starts with the selected center node and follows all of its references (property, parents, and children). Each new node is added to the sub-graph and the algorithm is recursively called with that node as the center. This process continues until either there are no more new nodes referenced or the path length passes PLthreshold. Children classes are the same as their parents and thus hold all the parents’ references as their own. For that reason the relationship is traversed, but the reference is not counted toward PLthreshold.
Each class defined in each of the ontologies was selected as the center for the traversal algorithm and a calculation was run with a threshold path length of two. Thus, from the 814 nodes in the original ontologies, 814 reduced ontology candidates were created, each one with the center set to a unique node in its original ontology.
3.4 Computing MAR and MAP
Informational quality is a somewhat subjective idea. Previous work has developed various methods for create subsets or views of an ontology. However, the only attempt to validate the ontologies was with Gangemi et al., who matched information retrieval with expert opinions (Gangemi et al., 2005). In order to develop a dynamic model, we need a computable measure of quality. For this study, we have chosen to use MAR to measure informational quality.
Five volunteers unrelated to this research were asked to create typical queries they would have about concepts in the domain. These volunteers had no knowledge of the specific ontologies being used for this study. These volunteers created 28 queries to use in this study. It should be noted that the queries were written in English and had to be mechanically converted to fit the naming conventions of each original ontology. However, no change to the structure or purpose of the query was performed.
The querying of both the original ontology and all the reduced ontology candidates was performed using SPARQL (Stuckenschmidt & Klein, Reference Stuckenschmidt and Klein2003) after loading each ontology into the Jena OWL parser (Etzkorn et al., Reference Etzkorn, Gholston, Fortune, Stein, Utley, Farrington and Cox2004). The set of queries was applied to all 814 ontologies (the originals and all the reduced ontology candidates).
The recall score for each query was computed and the MAR for the reduced ontology candidates was computed over all the queries. As we discussed earlier, we are only concerned with recall with respect to the original ontology.
Performance though less subjective is still a broad term. There have been some studies into the performance of subsets versus full ontologies (Grau et al., Reference Grau, Kazakov and Sattler2007). However, performance has typically been defined as simple size and has not been related to any metrics. We must first define what is meant by performance.
We choose to define performance gain in two parts, bandwidth and processing time. As with quality, the original ontology forms the basis for performance measurement. We measure the bandwidth requirements and processing time of the base ontology and then for the reduced ontology candidates.
In order to make these measurements, a simulation of a mobile device, with various processing capability and bandwidths, was created. This simulation interacts with a mock semantic Web service provider. A series of runs with various capabilities for bandwidth and processing were completed with noise applied to the actual amount of resources the simulated device contained. From the results we computed average bandwidth and processing time required for the original ontology and its reduced ontology candidates. The ratio of average time for the original ontology and each reduced ontology candidate was set to the MAP for that reduced ontology.
3.5 Applying the metrics
While metrics have been in use for software systems for many years, applying them to ontologies is a relatively new idea. There have been metrics previously defined to describe the structure of an ontology (Yao et al., Reference Yao, Orme and Etzkorn2005; Orme et al., Reference Orme, Yao and Etzkorn2006a, Reference Orme, Yao and Etzkorn2006b). We chose the structural metrics because the are computable in a short time, making them useful for a dynamic model. Other, semantic type metrics, are difficult to compute in a short time and therefore not as useful for this model.
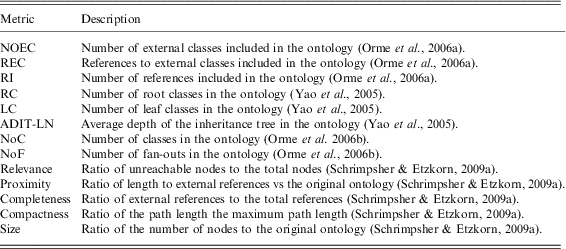
None of the metrics defined for general ontology quality give a look at reduced ontologies specifically. So we define five new reduced ontology metrics in a previous study (Schrimpsher & Etzkorn, Reference Schrimpsher and Etzkorn2009a) in order to look at how well a reduced ontology matches the original ontology. Table 3 represents a description of structural metrics chosen for this study.
Ontology metrics used in this study
NOEC = number of external classes; REC = reference to external classes; RI = referenced includes; NoC = number of classes; NoF = number of fan-outs.
The metrics were applied to each reduced ontology candidate and the original ontology. For this study, COIs are limited to a single choice of a node in the ontology. Since Jena provides an indexed list of the nodes in the ontology, checking for a single node is a trivial task.
We then computed the metrics defined in Table 3 on each of the remaining reduced ontologies. Each metric was automatically computed by a tool the authors developed in Java based on the Jena OWL parser. Each of the metrics defined in Table 3 is then correlated with the MAR score. This correlation provides a filter on which metrics are actually useful at predicting quality. This will provide confidence in which metrics are useful to quality and which may not be.
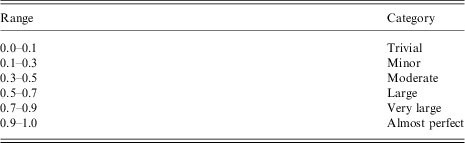
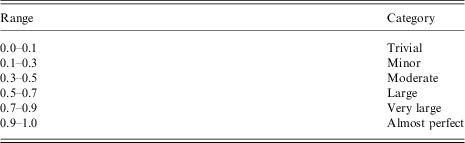
Each of the metrics defined in Table 3 is then correlated with the MAP score. This correlation provides a filter on which metrics are actually useful at predicting performance. This will provide confidence in which metrics are useful to performance and which may not be. We used Cohen's correlation magnitude scale (Cohen, Reference Cohen1998) shown in Table 4.
Cohen's correlation magnitude scale
3.6 Building the model
Linear regression is a well understood way to finding linear models between observed data and responses. However, it does suffer from sensitivity to intercorrelation, so the first step in creating this a linear regression model is finding and removing metrics with intercorrelation. Once the metrics to be used in the regression are decided, a step-wise regression is performed to find out which metrics provided the best model.
A preliminary attempt at creating a linear model between metrics and MAR in a single domain was performed previously (Schrimpsher & Etzkorn, Reference Schrimpsher and Etzkorn2009b). This study expands those results to include models predicting MAP as well as MAR and using multiple domains. The plan is create two linear regressions (one for MAR and one for MAP) based on the 829 reduced ontology candidates in the four domains chosen. Once the two models are found, a standard analysis will be performed.
4 Results
4.1 MAR and MAP correlations
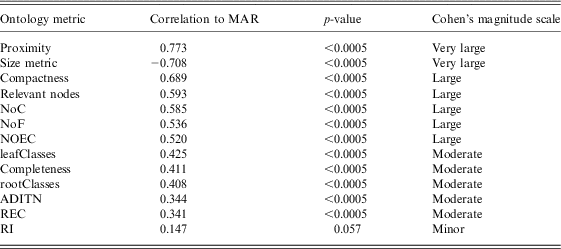
In the first part of this study, each metric was correlated with the MAR and MAP scores. These correlations were ranked according to Cohen's magnitude scale (Cohen, Reference Cohen1998). The MAR correlations are shown in Table 5. Two metrics have a very large correlation with MAR, proximity and size. Compactness, relevant nodes, NoC, NoF, and NOEC all have large correlations. The rest have moderate correlations except for RI, which has a minor correlation. This is promising for creating a useful model, since all but one of the metrics have at least a moderate correlation with MAR.
The correlations between ontology metrics and MAR
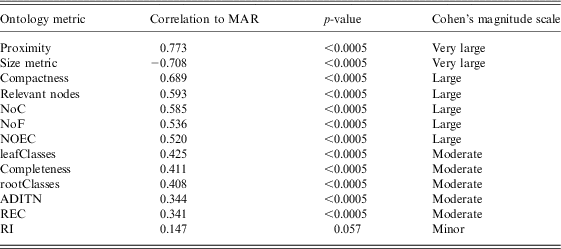
NoC = number of classes; NoF = number of fan-outs; NOEC = number of external classes; MAR = mean average recall; REC = reference to external classes; RI = referenced includes.
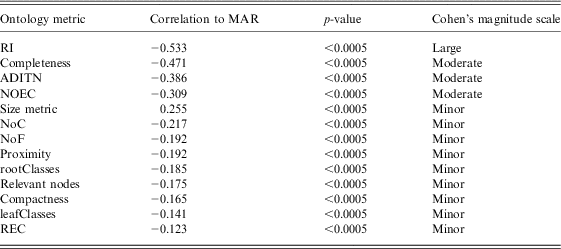
The MAP correlations are shown in Table 6. RI is the only metric with a large correlation with MAP. Completeness, ADITN, and NOEC all have moderate correlations. The rest of the metrics have minor correlations. While this is less promising than the MAR results, it is still possible we can create a good model to predict MAP. However, it may be there are variables mission from this model that are needed to estimate MAP.
The correlations between ontology metrics and MAP
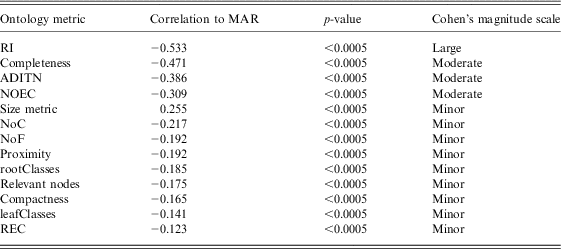
MAP = mean average performance; MAR = mean average recall; RI = referenced includes; NOEC = number of external classes; NoC = number of classes; NoF = number of fan-outs; REC = reference to external classes.
4.2 Intercorrelation
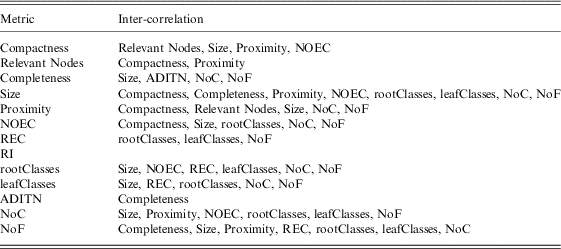
In order to create a linear regression model, we must first identify and remove any intercorrelated metrics, since these will bias the results and give us an unreliable model. As a threshold, we set a correlation of 0.5 to say two metrics were intercorrelated. Table 7 shows each metrics and which other metrics it is intercorrelated with.
List of intercorrelated metrics
NOEC = number of external classes; NoC = number of classes; NoF = number of fan-outs; REC = reference to external classes; RI = referenced includes.
In order to ensure that no intercorrelated metrics are in the models, we created a list of possible variables for the models by choosing all combinations of metrics. We started with the highest correlation to MAR and MAP and then added metrics that were not correlated with any variables already in the model.
4.3 MAR Model
For the MAR model, a number of variable options were analyzed using a stepwise regression approach. Montgomery et al. (Reference Montgomery, Peck and Vining2006) defines a stepwise regression is a way of evaluating a number of regression models automatically by evaluating their partial F statistics at each step in order to find the best linear regression model. The stepwise regression was done with the Statistical and Process Management Software for Six Sigma and Quality Improvement–Minitab (2010) statistical software package and used a threshold of 0.15 to enter and remove. Based on the results of this stepwise regression, the variables selected were Proximity, NOEC, leafClasses, Completeness, and RI. The model selected was:
 $$\matrix{ \widehat{{MAR}}\, = \,{\rm{ - }}0.0616\, + \,0.709\,\times \,Proximity\, + \,0.0748\,\times \,NOEC\, \cr\ \quad\quad\quad\quad+ \,0.00250\,\times \,leafClasses\, + \,0.0650\,\times \,Completeness \\ \end{}$$
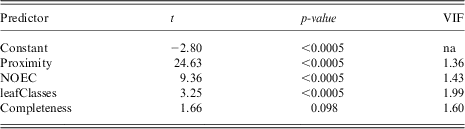
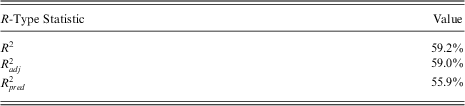
The results of the t-test on the predictors are shown in Table 8. A threshold of 0.10 was chosen. The p-values are all <0.005 with the exception of Completeness (p = 0.098), but they all fall within our chosen threshold. All of the Variance Inflation Factors (VIF) are <2, so intercorrelation does not appear to be a problem. The R 2 values are given in Table 9. These were the highest values of all the variable combinations examined. These values give us a high confidence in future predictions. ANOVA analysis (Montgomery et al. Reference Montgomery, Peck and Vining2006) shown in Table 10, demonstrates that there is definitely a relationship between the metrics and MAR.
T-test results whether there is a relationship between the metrics and MAR
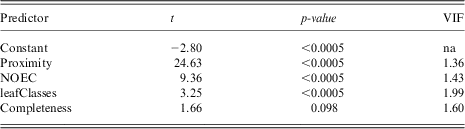
NOEC = number of external classes; MAR = mean average recall.
R 2 statistics for MAR model
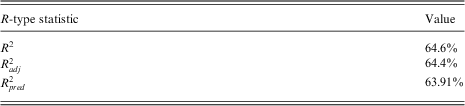
MAR = mean average recall.
ANOVA of MAR linear regression
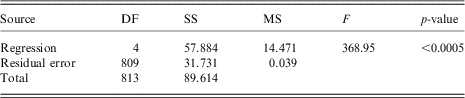
MAR = mean average recall.
In order to be more confident in our model, we conducted further analysis on the residuals. The standard residual plots are given in Figure 1. The first assumption, normality of the residual data, is checked through the normality plot in the upper left of Figure 1. While there appears to be some non-normal behavior at 0 in the residuals, they do follow the line fairly well and we accept it. This can also be seen in the histogram plot of the residuals, showing a bell shape of the residuals. The second assumption, randomness, is check through the versus fit plot given in the upper right of in Figure 1. The errors seem to be fairly random and no obvious pattern is seen by the authors. The third assumption, that residuals are independent of order, is shown in the versus order plot in the lower right of Figure 1. The residuals seem to be fairly block shaped and there appears to be no order dependence.
Standard residual plots for MAR. MAR = mean average recall
So given this analysis, we initially conclude that the model is a good predictor of MAR, and therefore predicts the quality of the reduced ontology relative to retaining information on the COI.
4.4 MAP model
For the MAP model, a number of variable options were analyzed using a stepwise regression approach. The stepwise regression was done with the Minitab statistical software package and used a threshold of 0.15 to enter and remove. Based on the results of this stepwise regression, the variables selected were Proximity, NOEC, leafClasses, Completeness, and RI. The model selected was:
 $$ \matrix{\widehat{{MAP}}\, = \,1458\,{\rm{ - }}\,331\,\times\,RI\,{\rm{ - }}\,108\,\times\,Completeness\,{\rm{ - }}\,15.3\,\times\,NOEC\, \\ + \,0.831\,\times\,leafClasses \\ \end{} $$
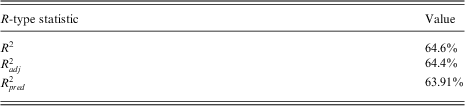
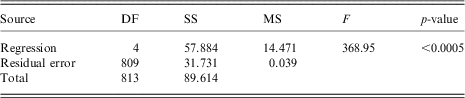
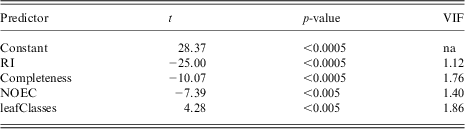
The results of the t-test on the predictors are shown in Table 11. An threshold of 0.10 was chosen. The p values are all <0.005 with the exception of Completeness (p = 0.098), but they all fall within our chosen threshold. All of the Variance Inflation Factors (VIF) are <2, so intercorrelation does not appear to be a problem. The R 2 values are given in Table 12. These were the highest values of all the variable combinations examined. These values give us a high confidence in future predictions. ANOVA analysis shown in Table 13, demonstrates that there is definitely a relationship between the metrics and MAR.
T-test results whether there is a relationship between the metrics and MAP
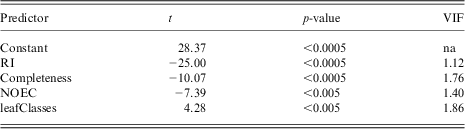
MAP = mean average performance; VIF = Variance Inflation Factors; RI = referenced includes; NOEC = number of external classes.
R 2 statistics for MAP model
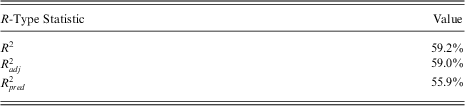
MAP = mean average performance.
ANOVA of MAP linear regression

MAP = mean average performance.
In order to be more confident in our model, we conducted further analysis on the residuals. The standard residual plots are given in Figure 2. The first assumption, normality of the residual data, is checked through the normality plot in the upper left of Figure 1. There appears to be non-normal behavior for large residuals. However, for lower values of residuals a normal distribution is reasonable. This can also be seen in the histogram plot of the residuals, where the bell shape is skewed to the right. The second assumption, randomness, is checked through the versus fit plot given in the upper right of Figure 1. Again it seems that large residuals make the plot look nonrandom. The third assumption, that residuals are independent of order, is shown in the versus order plot in the lower right of Figure 1. Again very large residuals appear to be outliers, but otherwise the data seems independent of order.
Standard residual plots for MAP. MAP = mean average performance
Given this analysis, it is possible that this model is either non-linear, or there is some variable inherent in the model that is not being measured. As this is our first attempt at an MAP model, we are confident that the model can be adjusted, with either a higher order term or a new metric currently not being measured.
5 Conclusions
Creating a true Semantic Web requires handling all types of clients that may use available services. As the size of the Web grows, the size of Web service ontologies will grow as well, out pacing mobile devices’ ability to use them. In this research, we have created a workable model to reduce the size of ontologies a mobile device must process while maintaining the core of the information the client needs to perform his task.
Given the results in Section 4, we believe we can now quickly compute informational quality in the form of MAR using a combination of structural ontology metrics. The MAP is not as convincing and requires additional research. That being said, we are now confident an algorithm can be developed to generate high-quality reduced ontologies dynamically.
The next step in this research is to validate these models against ontologies not used in the constructing the models. This will provide more confidence in the models to move forward. As this research continues, the model created will be used to dynamically create reduced ontologies at the time of the user requests. This would allow a Web service ontology to be tailored to a specific task a software agent is engaged in.
Acknowledgment
The authors would like to thank Sampson Gholston for his statistical expertise and Anthony Orme for his out of the box thinking.