I. INTRODUCTION
Since the beginning of the nuclear age, the question about material degradation in a nuclear environment being influenced by the radiation has always been a key issue. Wigner was one of the first who brought attention to this issue. Reference Wigner1,Reference Dienes2 The question on reliability of materials in nuclear environments is still prominent, in civil as well as defense related applications.
Today, for all nuclear reactor concepts proposed or in service, it is the material issues that pose the greatest challenge. If no material is available or qualified to be used in a nuclear environment, it is impossible to realize future concepts with greater demands on the material performance.
The material challenges not only in fission but also in fusion applications are subject of many publications, and well summarized in recent reviews. Reference Zinkle3–Reference Barabash, Fabritsiev, Kalinin, Zinkle, Rowcliffe, Rensman, Tavassoli, Marmy, Karditsas, Gillemot and Akiba8 While the material reliability for up to 80 years is the main issue to consider for light water reactor applications and their lifetime extension, advanced reactor concepts ask for new materials and alloys to be tested in rather harsh environments. For the light water reactor (LWR) case, Reference Allen, Busby, Meyer and Petti9 material issues for reactor pressure vessels (RPV) come from aging structures and localized issues such as welds and joints in combination with old materials from the time the structure was fabricated. Since the RPV is one of the most critical safety related items in a LWR plant, and is maybe the only component besides the building which cannot be replaced over the plant lifetime, this component might be considered the most important one. Also, in some nuclear applications, it is of value to assess the mechanical properties, microstructural changes, and the status of materials at specific locations in a component such as end cap welds, fuel/clad interfaces, or rather small parts such as the spacer grits manufactured out of various materials including the nickel based X-750 in CANDU (CANada Deuterium Uranium) reactors. Reference Zhang, Yao, Morin and Griffiths10
Advanced reactors and related fuel types anticipate high dose irradiation to allow cladding to be run to doses of 400 dpa and above. Reference Hamase, Saito, Sagara and Han11 Unfortunately, achieving these high doses requires extremely long irradiation times in reactors and naturally there are only very few materials irradiated to such high doses. In fact, few materials have been irradiated to doses above 100dpa at selected temperatures. Reference Bailey, Sterger, Toloczko and Hosemann12–Reference Gelles16
It is stated that accelerated material testing is important to achieve high doses rather quickly, to enhance the knowledge on new material concepts under radiation, and to lead the way toward their qualification and deployment, most accelerated material testing approaches for high dose application involve ion-beam irradiation Reference Hosemann17–Reference Kulcinski, Brimhall and Kissinger20 or high dose neutron irradiation typically in fast reactors. While ion-beam irradiation has a rather limited penetration depth and therefore drastically limits the amount of material available to be investigated, it has been deployed for a range of fundamental radiation damage studies as a surrogate for neutron irradiation since the beginning of nuclear material studies. Reference Corbett, Denny, Fiske and Walker21,Reference Corbett, Smith and Walker22 Even multibeam irradiations were subject of study to investigate synergistic effects of various ion species. Reference Tanaka, Oka, Ohnuki, Yamashita, Suda, Watanabe and Wakai23–Reference Yamamoto, Wu, Odette, Yabuuchi, Kondo and Kimura25 The limited penetration depth of the ions, which is one of the drawbacks of utilizing ion-beam irradiations, makes small scale material investigations necessary, and is one of the main driving forces to enhance and deploy techniques such as nanoindentation.
Reactor irradiation campaigns, on the other hand, deal with radioactive samples and therefore specimen handling is of concern in a time when the hot cell capabilities are reduced to 42 facilities worldwide. 26 Small samples are again desirable since they can be handled outside of hot cells, and also lead to cost savings. In addition, oftentimes the amount of available testing material is limited due to reactor space limitations. Statistical certainty of the data is another issue leading to the fact that smaller sample volume in small scale mechanical testing is advantageous to obtain more data points on a given volume of material. In the past, oftentimes only very few samples of a specific material at a specific dose and irradiation temperature were available to the scientists due to limited space in a test reactor. Therefore, the scientists were asked to either test the few samples at different temperatures or use them to decrease the data uncertainty by repeating a test at a single temperature. This dilemma forced the nuclear material scientists to weight statistics versus testing condition. The availability of small scale material testing now allows mitigating this issue by filling in the “blank spots” in a dose versus property and temperature graph using these new techniques.
All irradiation approaches benefit from smaller material testing techniques regardless if using reactor neutron or being ion-beam source. Furthermore, the need to link these techniques with bulk properties is an acute problem in the field to extract bulk engineering data. Therefore, the development of small scale mechanical testing in combination with microstructural investigation is of great interest to the nuclear material community for both, material development and monitoring applications, respectively. Table I summarizes the benefits of small scale mechanical testing for ion beam as well as neutron irradiated specimen.
Benefits of small scale mechanical testing on neutron and ion beam irradiated materials for nuclear applications.

Of course no new development comes without drawbacks and investment, and small scale mechanical testing as discussed here does still have significant difficulties to overcome. Extrinsic and intrinsic size effect issues make the analysis of the test data difficult, and have to be addressed to compare the obtained data to actual large scale mechanical data. Small scale mechanical testing at the scales discussed here is a rather new approach, requiring additional research before it can be deployed and incorporated into engineering standards. However, it can already deliver urgently needed basic scientific information about material degradation in nuclear environments to inform and bench mark modeling efforts.
II. OVERVIEW OF MICROMECHANICAL TESTS DEPLOYED ON IRRADIATED MATERIALS
For the purpose of the subsequent discussion, the term “small scale materials' testing” relates to mechanical test specimens with dimensions that require conventional (light microscopy or scanning electron microscopy) and/or advanced microscopy (transmission electron microscopy) to be utilized for handling, manufacturing, and testing of the specimens. Typically, the size scale is in the order of tens of nanometers to tens of micrometers, therefore covering the lower end of the mesoscale spectrum. Larger samples are of course possible, but are not the subject of this review.
A. Indentation-based techniques
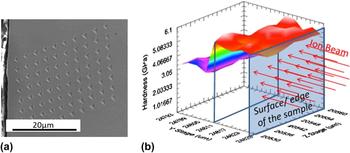
Indentation techniques have a long tradition of characterizing mechanical property changes due to exposure in a nuclear environment. While microhardness testing has first been deployed, nanoindentation has become more common to characterize the changes in irradiated materials. Especially the development and acceptance of the Oliver–Pharr method Reference Oliver and Pharr27 allows access to more data from an instrumented indentation test. Reference Fischer-Cripps28 While of course hardness is measured, also the elastic modus can be evaluated from the unloading part of an indentation load–displacement curve, as described in Ref. Reference Oliver and Pharr27. The use of nanoindentation has gotten particular interesting on ion beam irradiated materials. A comprehensive review of the application of indentation in cross-section to assess the ion-beam irradiation related property changes has been given recently in Refs. Reference Kiener, Minor, Maloy and Hosemann18,Reference Hosemann, Kiener, Wang and Maloy29. Two experimental arrangements are suggested to assess the mechanical property changes on ion beam irradiated material: surface indentation as conducted in Refs. Reference Dayal, Bhattacharyya, Mook, Fu, Wang, Carr, Anderoglu, Mara, Misra, Harrison and Edwards30–Reference Yang, Kang, Zhang and Jang35 and cross section indentation as conducted in Refs. Reference Rice and Stoller36–Reference Hosemann, Swadener, Kiener, Was, Maloy and Li38. While surface indentation is simpler to apply and does not require further sample preparation after irradiation, it has the disadvantage of overlaying several artifacts, making a dose versus hardness plot difficult to interpret without complementary analysis. Cross section indentation, however, requires higher beam energies and post irradiation sample preparation, but enables a more precise way of assessing hardness versus dose. Moreover, the limited penetration depth of the beam allows to sample the irradiated as well as the unirradiated area within the same field of indents, and therefore allows a direct comparison between an unirradiated and irradiated material. Cross-section hardness measurements were first deployed by Stoller and Rice Reference Rice and Stoller36 and applied to metals and ceramics. Reference Snead, ZinkIe and Steiner39 A 3D plot of hardness shown in Fig. 1 represents saturated hardness versus irradiation-depth data of 304SS irradiated to 10 dpa at 360 °C, which are reproduced from the data published in Ref. Reference Reichardt, Lupinacci, Kacher, Jiao, Chou, Abad, Minor and Hosemann40.
(a) SEM image of a field of indents on an ion beam irradiated sample in cross section. (b) 3D plot of hardness data measured versus irradiation depth on 304SS irradiated to 10 dpa at 360 °C. Reference Reichardt, Lupinacci, Kacher, Jiao, Chou, Abad, Minor and Hosemann40

Recently continuous stiffness mode indentation, where a low amplitude oscillation (typically <2 nm at 50 Hz) is overlaid on the load curve, Reference Xiaodong and Bharat41–Reference Shin, Jin and Kim43 is increasingly used due to the fact that very shallow ion-beam irradiation and more complex material properties such as strain rate sensitivity and creep properties can be measured. Reference Kasada, Takayama, Yabuuchi and Kimura44–Reference Maier, Durst, Mueller, Backes, Höppel and Göken46 Of course, the difficulty is to deconvolute all the various phenomena that take place and contribute to the hardness value. The indentation size effect, the dose profile, the ion implantation peak, and potential surface contamination is all integrated over the measured hardness using this method, and deconvolution of the measured data requires further data treatment. Also the question persists if a continuous loading and unloading cycle in the same indentation position can lead to additional artifacts. However, it is undeniable that this method is rather powerful and is widely used.
Berkovich indenters are utilized in most indentation measurements. However, spherical tips can deliver further insight, as they allow to measure yield stress directly from the load–unload curve. Reference Huber, Tyulyukovskiy, Schneider, Rolli and Weick47–Reference Sacksteder and Schneider49 This approach is not as widely utilized in ion beam irradiated materials, but has large potentials among other indenter geometries.
Another important need is to evaluate the mechanical properties of irradiated materials at reactor operating temperature and environment, which lead to the development of high temperature indentation tests. This capability is initially driven by other industries such as hard film coatings and tool applications, but starts to become more interesting for nuclear materials as well. These tests are particularly difficult to conduct due the thermal drift between indenter and sample, if the temperature of both is not precisely matched and independently controlled. Reference Everitt, Davies and Smith50–Reference Beaker and Smith53 Also matching the correct indenter material Reference Wheeler and Michler54–Reference Beake, Bell, Goodes, Pickford and Smith56 to the sample can be challenging. Diamond as a common indenter material can oftentimes not be used at higher temperatures due to a rapid degradation of the diamond in air and in contact with the sample. Cubic boron nitride (CBN) is a good material of choice but has the problem of being difficult to synthesize in larger crystals, leading to difficulties of how the indenter tip is mounted to the holder. Of course, also the sample degradation has to be taken into account during these measurements. Especially oxidation of most structural materials at elevated temperature can lead to issues. A protective gas atmosphere or even vacuum environment needs to be applied to ensure reliable measurements, as shown in Ref. Reference Korte, Stearn, Wheeler and Clegg57. While room temperature nanoindentation is established since 30 years, a lot of work is still required to develop high temperature nanoindentation to the same degree of accuracy and reproducibility.
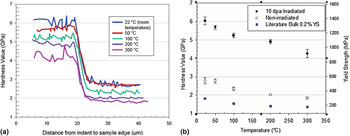
Nonetheless, if conducted properly, one can perform nanoindentation at elevated temperature in cross section on ion beam irradiated materials and obtain data as shown in Fig. 2, where cross-sectional nanoindentation is conducted at different temperatures on an ion beam irradiated 304SS sample (2 MeV protons to 10 dpa at 360 °C). Reference Reichardt, Lupinacci, Kacher, Jiao, Chou, Abad, Minor and Hosemann40 The hardness versus temperature data is compared to yield stress data on the same material (not irradiated) from the literature and rather similar trends can be seen. It is noted that the hardness scale and yield stress scale are matched in such a matter that the nanohardness is converted to yield stress using the approach mentioned in Refs. Reference Busby, Hash and Was58 and Reference Lupinacci, Chen, Li, Kunz, Jiao, Was, Abad, Minor and Hosemann59 where a size effect curve is used to extrapolate from nanohardness to macrohardness and the factor 3.03 is used to convert hardness value to yield stress. Of course, several other equations to relate hardness to yield stress exist and are utilized today, as explained in Refs. Reference Busby, Hash and Was58 and Reference Lupinacci, Chen, Li, Kunz, Jiao, Was, Abad, Minor and Hosemann59. We do want to mention that despite the fact that hardness is often used to assess large scale mechanical properties, most equations used in the literature are empirical in nature and both, ultimate tensile stress as well as yield stress, are used in comparison to hardness numbers. This leads to misunderstandings of what can be assessed based on hardness measurements. On nonirradiated material yield stress and ultimate tensile stress are vastly different values and therefore the distinction is clear. On irradiated materials with little to no work hardening where both values are close together, the distinction between yield stress and flow stress is often not as clear in the literature.
Hardness profile on ion beam irradiated 304SS as a function of temperature. (a) The transition from irradiated to nonirradiated material is clearly visible. (b) Hardness and calculated yield strength on irradiated and nonirradiated 304SS over temperature. The data are compared to bulk reference data on the same material over temperature.

Part of the indentation community focuses on pushing the temperature limit above 1000 °C to evaluate the properties of fuel forms in addition to the structural materials, recent efforts are also made to also push the temperature limit to cold regimes and assess the performance of materials at cryogenic temperatures. Reference Lupinacci, Hosemann, Minor and Shapiro60–Reference Lee, Meza and Greer62 These efforts are rather new and still have to be applied to irradiated materials with the aim to find a parameter on a small scale that correlates with a ductile to brittle transition (DBT) temperature.
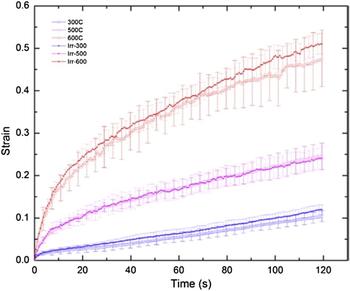
While many indentation based techniques exist, we also want to highlight indentation creep Reference Maier, Merle, Göken and Durst63 due to the fact that creep testing is of particular importance for materials under radiation. Indentation based creep testing has been utilized on low melting metals Reference Geranmayeh, Mahmudi, Khalatbari, Kashi and Nayyeri64,Reference El-Bediwi, Lashin, Mossa and Kamal65 since years, and now also becomes available to structural materials due to the availability of the indentation testing at elevated temperature. Notably, the indentation is performed ex situ (i.e., after irradiation) and true indentation creep testing requires putting the indenter in the irradiation facility with all its difficulties. However, it still can be interesting to evaluate post irradiation creep performance of materials, since the defects induced by radiation remain after the irradiation is completed. Figure 3 shows an example of several indentation creep curves obtained on an ODS material (PM2000) at various temperatures with and without irradiation. Reference Huang, Harris, Maloy and Hosemann66 Typically, the indenter is held at a specific load over an extended period of time and the displacement change as a function of time is used to analyze the data. For evaluation, the standard creep equations are modified to be applicable for indentation measurements as demonstrated in Refs. Reference Huang, Harris, Maloy and Hosemann66–Reference Syed Asif and Pethica69. Notably, this creep experiment is subject to thermal drift between sample and tip, which is why rather short “relaxation” times are typically applied. However, using recently developed CSM techniques, this can be extended to several hours creep time without drift influence, as demonstrated by Maier et al. Reference Maier, Merle, Göken and Durst63
Indentation creep curves on PM 2000 obtained from a constant load applied over a dwell period of 120 s at different temperatures (reproduced from Ref. Reference Huang, Harris, Maloy and Hosemann66).

Overall it is noted that indentation is widely used today to probe the radiation-induced mechanical property changes due to its easy use and high degree of automation, allowing to obtain a large amount of information from a small volume. This review here intends to give a brief overview of techniques which are widely deployed in the nuclear materials community, but does not attempt to cover the entire bandwidth of indentation based techniques.
B. Microcompression testing on irradiated materials
While small-scale testing has been widely available since the commercialization of nanoindenters in the 1980s, it was only after Uchic introduced microcompression testing in 2004 (Ref. Reference Uchic, Dimiduk, Florando and Nix70) which made uniaxial compression testing widely available. This is based on focused ion beam (FIB) sample manufacturing which allows well-defined geometries and smaller samples to be fabricated from essentially any material. Such samples could be investigated in a quantitative and systematic manner, leading to further nano- and micromechanical studies. The common approach of manufacturing this type of specimen is by FIB processing (top down) while other techniques of sample manufacturing encompassing lithography Reference Shin, Jin, Kim and Park71,Reference Shin, Jin, Sung, Kim, Choi and Oh72 the growth of specimen in the right geometry via electroplating or directional solidified (bottom up), Reference Burek and Greer73–Reference Bei, Shim, Pharr and George75 are applied on selected materials. However, the top down approach is usually conducted for nuclear and engineering applications, since it is representative of the “in service” material. Recent approaches of sample manufacturing utilizes a combination of different techniques to accelerate the sample manufacturing process, as discussed further in this paper.
For all top down approaches, a bulk material is used in as-fabricated condition and micrometer-sized pillar structures are manufactured into the material surface by ion beam milling. Of course any type of FIB processing induces also near-surface damage, leading to additional issues as discussed in Refs. Reference Kiener, Zhang, Šturm, Cazottes, Imrich, Kirchlechner and Dehm76–Reference Knipling, Rowenhorst, Fonda and Spanos78. Some reactor materials are particularly sensitive to FIB damage, for example 304SS which can easily transform into martensite due to FIB processing, as shown in Ref. Reference Knipling, Rowenhorst, Fonda and Spanos78.
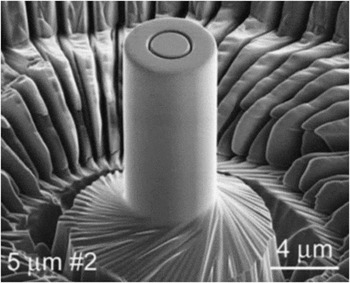
Several approaches of how to manufacture microsized mechanical test specimens exist today, and the development of more gentle low energy FIB processing techniques allows to minimize these described preparation effects. Also, several techniques are developed to accelerate microcompression samples are made and accelerated. While Uchic developed software to manufacture pillars by “lath milling” (Fig. 4), which requires specific FIB instruments with a piezo stage, most studies are made by top down milling due to the fact that it is a more universal approach and can be performed on most instruments. This top down milling, however, introduces a sample taper that leads to a stress gradient over the sample height [Fig. 5(a)] and consequently a strain localization. Reference Kiener, Motz and Dehm81,Reference Kiener and Minor82 Since FIB sample processing can be a time consuming and therefore costly task, scientists evaluate combinatorial approaches where rough cutting is carried out with electrical discharge machining (EDM), micromilling, etching or lasers, and fine cutting is done using FIB processing. Reference Schuster, Wei, Zhang and Ramesh83–Reference Kraft, Gruber, Moenig and Weygand87 However, due to the large equipment investment into the other techniques, most scientists machine the full structures by FIB.
Microcompression test specimen as manufactured by Uchic et al. (reproduced from Ref. Reference Uchic, Dimiduk, Florando and Nix70).

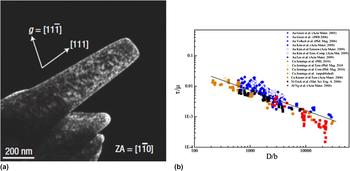
(a) TEM image of a FIB prepared Ni(111) single crystal after Shan et al. Reference Shan, Mishra, Syed Asif, Warren and Minor79 FIB induced defects and sample taper from top down milling are clearly visible. (b) Scaling behavior for a variety of fcc materials as a function of sample size. Reference Greer and De Hosson80

Nano- and micromechanical testing has revealed a number of fundamental aspects of plastic deformation Reference Greer and De Hosson80,Reference Dehm88,Reference Uchic, Shade and Dimiduk89 when studying basic materials such as single crystal copper or similar. A prime example is the effect of size on the mechanical properties of small samples. Plasticity size effects have been studied in whiskers, Reference Brenner90 thin films, Reference Nix91 small structures such as Si wedges, Reference Minor, Lilleodden, Jin, Stach, Chrzan and Morris92,Reference Ge, Minor, Stach and Morris93 and most recently in micropillars Reference Dimiduk, Woodward, LeSar and Uchic94–Reference Frick, Clark, Orso, Schneider and Arzt97 and nanowires. Reference Gianola and Eberl98 Typically, one observes that the yield strength of a structure increases with decreasing characteristic length (for a nanopillar, the diameter, d), which is frequently described by a simple power law without physical meaning:
 $${\sigma _{\rm{y}}} \sim {d^{ - n}}\quad {\rm{,}}$$
with n around 0.6 for fcc metals and d being size of the specimen. Through a particularly clean and elegant set of experiments, this behavior has been attributed in part to the relative size of microstructural features versus the diameter of the nanopillars. Reference Volkert and Lilleodden96–Reference Gianola and Eberl98 This behavior on extremely small samples can be explained by the fact that to make a deformation possible, dislocations need to be present and move through the material. Extremely small samples on average do not contain a sufficient number of movable dislocations, and therefore dislocations need to be nucleated, requiring applied stresses near the theoretical strength to accommodate the prescribed deformation. In the case that one or more dislocation sources are present within the crystal, typically in the form of single pinned spiral sources for small single crystals, the Orowan stress to operate these source scales inversely with the source size, which in turn naturally scales with the sample size. Thus, this geometrical truncation leads to increasing yield strength numbers for reduced sample sizes. Figure 5(b) illustrates this behavior on single crystal fcc materials. Reference Bei, Shim, Pharr and George75,Reference Greer and De Hosson80,Reference Shim, Bei, George and Pharr99–Reference Greer, Oliver and Nix101
However, when moving to larger scales (mesoscale), thus typically leaving the single crystal sample and rather probing samples with a few to several grains across the diameter, the opposite trend can be observed. A polycrystalline material becomes softer than the microcompression sample once size is reduced, as shown in Refs. Reference Jang and Greer102–Reference Shin, Lim, Jin, Hosemann and Kwon104. It appears that the reason for this softening (smaller is weaker) phenomena is governed by the fact that fewer grain boundaries exist within the pillar itself, ultimately ending in the behavior of a single crystal material. Grain boundaries would introduce dislocation pile-ups causing back stresses on the operating dislocation sources leading to hardening, while their reduction generates increasing free travel distances for dislocations within the sample.
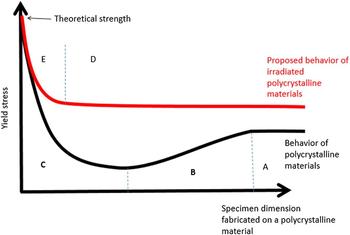
Combining those two limiting scenarios schematically leads to the black graph in Fig. 6 for polycrystalline materials with a low defect density, while the red graph depicts the situation for a high defect density material, for example after irradiation. The labels A through E mark different regions of physical behavior. Region A is the classical behavior of a polycrystalline material containing a sufficient number of grains so that the microstructures sampled, even during microtesting, are representative of the bulk behavior. Of course, in this simplistic view we do not regard extrinsic effects as sometimes observed by different sizes tensile samples where again smaller is stronger due to smaller flaw sizes in the specimen. Region B corresponds to the transition region from the polycrystalline behavior to a single crystalline behavior considering the relationships found in Refs. Reference Hosemann, Swadener, Kiener, Was, Maloy and Li38,Reference Yang, Motz, Rester and Dehm105–Reference Kiener, Hosemann, Maloy and Minor107. Region C marks the quasi single crystal regime where the dislocation source size is dominant and the strength increases inversely with size, possibly all the way up to the theoretical strength once no dislocation is present or can be created. Reference Lowry, Kiener, Le Blanc, Chisholm, Florando, Morris and Minor108 Obviously, the exact shape of this curve could strongly be affected by different microstructural features and grain sizes. For example, small samples with high dislocation density, Reference Schneider, Kiener, Yakacki, Maier, Gruber, Tamura, Kunz, Minor and Frick109 small grained materials, or precipitate strengthened materials Reference Girault, Schneider, Frick and Arzt110 might not show a pronounced region B. Notably, a similar consideration based on dislocation density and strength evolution in thin films was introduced a few years ago by Lilleodden and Nix. Reference Lilleodden and Nix111
Proposed size scaling behavior of polycrystalline materials with (red) and without (black) irradiation damage.

Expanding those thoughts to irradiated materials leads to a different behavior. It is known that irradiation damage increases the strength of a polycrystalline material due to the presence of small but strong and densely spaced radiation defects (Region D), creating a new small internal material length scale. Reference Arzt112 However, once the sample size is getting small compared to the length scales represented by grain structure or radiation damage, they are no longer the limiting factors but rather the stress to create or propagate a dislocation takes over, returning the material behavior back to the unirradiated (quasi single crystal) material as indicated in Region E. An experiment conducted in 2010 by Kiener et al. Reference Kiener, Hosemann, Maloy and Minor107 tested this hypothesis by investigating the difference between irradiated and nonirradiated Cu pillars of different sizes. They arrived at the conclusion that once the stress to operate the dislocation sources drops below that to cut the irradiation defects, bulk strength is obtained, consistent with the picture in Fig. 6.
Since the introduction of microcompression testing, a number of studies examining ion beam and neutron irradiated samples have been conducted. In this publication we cannot discuss all experiments performed in the past, but want to mention that most studies were carried out on engineering alloys, Reference Pouchon, Chen, Ghisleni, Michler and Hoffelener113–Reference Grieveson, Armstrong, Xu and Roberts116 while a limited number of studies were carried out on grown pillars Reference Landau, Guo, Hosemann, Wang and Greer117,Reference Guo, Landau, Hosemann, Wang and Greer118 or single crystal pure materials. Reference Soler, Molina-Aldareguia, Segurado, Llorca, Merino and Orera119
The main focus in the reported studies was to evaluate yield stresses, since the more interesting parameters such as total or uniform elongation, and work hardening rate are more difficult to capture. It has to be noted that irradiation does cause a noticeable difference in failure mode, as shown in Ref. Reference Kiener, Hosemann, Maloy and Minor107, where sudden localized failure of the micropillars was observed. However, to assess the actual failure other tests such as microtensile testing need to be conducted as discussed in subsequent chapters.
Comparable to developments in indentation, recent efforts were made to expand the technique of microcompression testing to different temperatures. Recently, Lupinacci et al. developed the cryostatic capability of microcompression testing, Reference Lupinacci, Kacher, Eilenberg, Shapiro, Hosemann and Minor61 while others pursue testing at elevated temperatures. Reference Korte, Stearn, Wheeler and Clegg57,Reference Korte and Clegg120–Reference Wheeler, Niederberger, Tessarek, Christiansen and Michler122 The issues are similar to those in indentation, which include indenter degradation, thermal drift, and sample oxidation. Since most high temperature setups are ex situ (not inside the SEM or TEM), the sample (micropillar) alignment with respect to the tip is difficult, as no SEM for positioning is available. The most difficult part is to ensure that the sample is parallel to the indenter tip. Several approaches are proposed to detect and correct misalignment in an ex situ device. Uchic Reference Uchic and Dimiduk84 introduced the use of a goniometer and evaluates the imprint of the flat punch indenter on the sample. Others measure the location (depth) of the sample at different areas and tilt the sample until it is straight. Whatever the used approach is mostly governed by the device used. Again, similar to indentation inert gas is frequently used to protect the sample from oxidation. However, it has to be noted here that even the cleanest forming gas (Ar–H gas mixture) still does contain some amount of oxygen, leading to oxidation at high temperatures. Korte and Clegg pioneered the field of high temperature microcompression and provide a recent review on common challenges. Reference Korte and Clegg120,Reference Korte, Barnard, Stearn and Clegg121
In recent time, also creep testing is of interest especially in respect of irradiation creep. Ozerinc and co-authors Reference Ozerinc, Averback and King123 recently published a method of testing microcompression specimens in an accelerator under constant load utilizing a custom designed spring loaded device. This rather elegant method and the resulting data show clear indication of the effect of radiation induced creep on a material and allow evaluating the effect of simultaneous loading and radiation, i.e., in situ experiment giving insight about the defects created during irradiation and their role into material degradation during radiation.
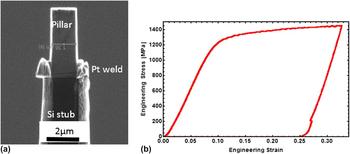
Typically, small scale testing is performed while the pillar is still attached to the bulk, and therefore the entire specimen needs to be handled. To take full advantage of small scale mechanical testing on neutron activated materials and reducing the total dose, one has to consider removing the specimen from the actual bulk material and thereby reducing the total amount of radioactivity of the specimen. Bailey et al. Reference Frazer, Bailey and Hosemann124 developed an approach where small scale compression test specimens are removed from a larger TEM foil and mounted on a hard and stiff substrate. This allows only handling the compression test specimen by itself. Initial tests were performed on an oxide dispersion strengthened (ODS) alloy (MA957) mounted on a silicon stub as can be seen in Fig. 7. The microcompression test data delivers a comparable yield stress to what is found at bulk specimens and specimens still attached to the bulk. Of course, the compliance of the underlying stub needs to be considered and the bottom of the lift-out pillar needs to be flat and parallel to the silicon substrate. This approach allows testing highly irradiated materials lifted out from high dose rate samples in instruments which typically would not be used with active samples, since no residual activity can be measured from the lifted-out materials. The additional advantage of this method is that it appears to be more FIB time efficient than trenching around entire pillar structures due to the fact that one can obtain several such pillars from one TEM foil lift out.
(a) MA957 microcompression specimen mounted on a lift out stub. (b) Resulting data from the tested pillar. Reference Frazer, Bailey and Hosemann124

C. Microtensile testing on irradiated materials
Microtensile testing of materials is less common due to the more complicated geometry. Kiener et al. Reference Kiener, Grossinger, Dehm and Pippan125 developed a method to “grab” dog-bone type geometry with a micro ripper, allowing to perform tension tests. This method has been proven in situ in the SEM Reference Kiener, Grossinger, Dehm and Pippan125 and TEM Reference Kiener, Kaufmann and Minor126,Reference Kiener and Minor127 and was recently applied to tensile testing of electroplated specimens, and on ion beam irradiated materials. Reference Kim, Jang and Greer128,Reference Landau, Guo, Hattar and Greer129 Other techniques for microtensile testing, based on micromanipulators or lithographic counterparts to pull on FIB produced or electroplated specimens are used today. Reference Fujii and Fukuya130 However, a detailed review on miniaturized tensile testing is beyond the view of this manuscript, rather the reader is referred to Ref. Reference Gianola and Eberl98.
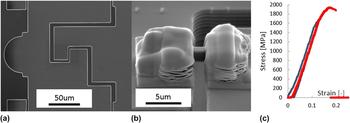
As an example for MEMS based testing, commercially available push-to-pull devices exist today which allow a standard nanoindenter to be used to perform tensile testing without the need to design custom stages and grippers. Reference Haque and Saif131–Reference Chisholm, Bei, Lowry, Oh, Syed Asif, Warren, Shan, George and Minor134 Typically, these devices are utilized to perform tension tests on nanowires and whiskers in TEM, Reference Haque, Espinosa and Lee132 and of course can also be used to perform tension testing on irradiated structural materials. Notably, the mounting and manufacturing procedure is more difficult than on whiskers. Figure 8 shows such a push-to-pull (PTP) device, the mounted sample, and the related stress strain curve obtained on 10 dpa-irradiated 304SS. Reference Hosemann, Frazer and Lupinacci135 Of course one has to account for the fact that the PTP has a spring constant as well. In Fig 8 the sample was first loaded along the blue curve and unloaded. The red curve presents the second load cycle which took the sample to failure. It can be seen that the specimen fails after very little plastic deformation and shows a yield stress of 1544 MPa, which is comparable to the irradiated pillar data of 1500 MPa reported in Ref. Reference Lupinacci, Chen, Li, Kunz, Jiao, Was, Abad, Minor and Hosemann59. The fact that the sample can be taken to failure and the uniform and total elongation can be evaluated increases the usefulness of these tests compared to indentation or compression. Obviously, due to the elaborate FIB work needed to fabricate the specimen, less data points can be measured using this method in a given time.
(a) SEM image of a PTP device. (b) 10 dpa irradiated 304SS mounted on the PTP. (c) Stress strain curve from the specimen shown in (b). The blue line is the first loading with yield at 1544 MPa while the red curve is the second loading to failure. Reference Hosemann, Frazer and Lupinacci135

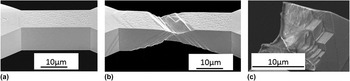
Slightly larger scale tension testing on irradiated materials can be carried out with a device designed by Wheeler and applied by Bhattacharyya. Reference Reichardt and Bhattacharyya136 There the tension samples are on the order of tens of micrometers and the load is applied with a hook type design. Typically, this device requires a thin pre-prepared foil for the material of interest, which is further irradiated and tested. Initial studies on single crystal Ni were carried out allowing to assess the stress strain behavior and fracture surface of the material as shown in Fig. 9.
(a)Tensile sample manufactured for in situ tensile testing on unirradiated single crystal Ni. (b) Post testing image where multiple slip is visible. (c) Fracture surface of the irradiated tensile specimen. Reference Reichardt and Bhattacharyya136

D. Microbend testing
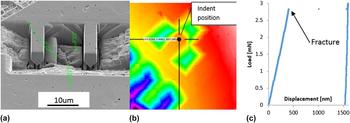
Microbend bar testing has been developed due to the fact that most indenters operate in compression mode and tensile testing is therefore difficult to conduct, as well as the difficulty of pillar alignment and the need to evaluate more properties than what is accessible by indentation. A lot of work on micro bend bar testing in the cantilever geometry was performed by Roberts and Armstrong, Reference Di Maio and Roberts137–Reference Gong and Wilkinson139 who developed a rather simple but effective FIB procedure to cut microcantilevers in a material surface, which can also be applied to thin film specimens. Reference Matoy, Schönherr, Detzel, Schöberl, Pippan, Motz and Dehm140 This technique has been also applied to SiC-based fuel forms in the past, Reference Frazer, Abad, Back, Deck, Hosemann, Sano, Srivatsan and Paretti141–Reference Hosemann, Martos, Frazer, Vasudevamurthy, Byun, Hunn, Jolly, Terrani and Okuniewski143 and Fig. 10 shows an example manufactured in UO2. Reference Frazer, Hosemann and Peralta144 The fact that the cantilevers are cut into the surface allows scanning probe microscopy scans with the indenter tip to locate the cantilever precisely, even with an ex situ device, to ensure that the loading is conducted at the desired location as shown in Fig. 10(b).
(a) Microcantilevers manufactured on UO2 fuel using FIB processing. (b) AFM image of the microcantilever produced scanned with the indentation tip, (c) resulting load versus displacement curve. Reference Frazer, Hosemann and Peralta144

Of course the fact that the samples are loaded in bending rather than tension or compression does make it more difficult to analyze the data. On brittle materials which are taken to failure, data analysis is relatively easy and can be done using simple analytical calculations. If plastic deformation occurs, this is a more difficult task and finite element modeling is required to evaluate the material properties accurately. Roberts and co-authors calibrated the cantilever method against the elastic modulus of copper Reference Armstrong, Wilkinson and Roberts138 at different grain orientations and were able to match the values found using this method with known literature E-modulus values.
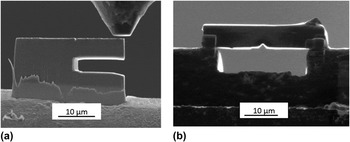
In situ bend bar testing allows to observe the material deformation directly, but makes it necessary to manufacture the specimens at a sample corner, edge, or a foil since one needs to have a straight line of sight in the SEM. Therefore, the cantilevers cannot be cut in the sample surface as shown above, limiting the sampling areas. However, the in situ recording of the deformation in the SEM or TEM allows later digital image processing (DIC) to be conducted, which serves as an input for FEM modeling. Reference Eberl, Gianola and Hemker145–Reference Sharpe147 Also, similar to the lift out pillars, lift out bend bars are desirable due to the fact that the amount of radioactive sample material can be reduced. Figure 11 shows a lift out cantilever and a lift out three point bend test as manufactured on irradiated 304SS and alloy X-750 from nuclear power reactors.
(a) SEM image of a lift out cantilever specimen from 304SS. (b) 3 point bend test specimen on alloy X-750 irradiated in a power reactor. Reference Hosemann148

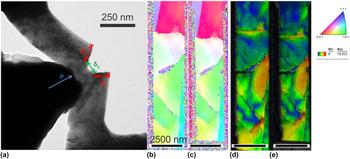
As can be seen from Fig. 11, there is no challenge in fabricating small scale fracture samples, as was demonstrated in several previous works. Reference Iqbal, Ast, Göken and Durst149,Reference Wurster, Motz, Jenko and Pippan150 The challenge is more related to the further data analysis. As the size of the plastic zone, even for a semi-brittle material such as tungsten, is in the range of several micrometers, Reference Wurster, Motz and Pippan151 classical fracture mechanics approaches cannot be applied. Rather, energy-based concepts need to be used. These, however, require knowledge of the exact crack geometry, crack length, or crack opening displacement in conjunction with the load–displacement data. While such information can hardly be acquired from ex situ experiments, use of the continuous stiffness data can be used to track stiffness changes caused by crack elongation, or the whole experiment can be performed in situ in a scanning or transmission electron microscope to have a constant visualization of the crack geometry. Reference Hintsala, Jackson, Kiener and Gerberich152 Exemplary, in Fig. 12, an in situ TEM image of a fracture sample, indicating the crack dimensions to be determined from such in situ videos, is shown in (a) along with the EBSD misorientation data of an ultrafine grained notched micro bending sample. Reference Hintsala, Jackson, Kiener and Gerberich152,Reference Hintsala, Kiener and Gerberich153
(a) TEM image showing the typical crack geometry accessible during in situ TEM fracture testing of a 250 nm thick single side notched beam. (b, c) EBSD data of a 2500 nm wide notched ultrafine grained austenite bending sample that was loaded in situ in the SEM (before and after loading) and (d, e) the corresponding kernel misorientation maps. Reference Hintsala, Jackson, Kiener and Gerberich152

III. SUMMARY
We discussed the different small scale mechanical testing techniques available today to assess the mechanical property degradation of materials under radiation. We outline indentation-based techniques and their limitations and approaches deployed today as well as further geometries such as microcompression, microbend bar, and microtensile testing. We do not claim that this review covers all aspects and limitations encountered, but we do emphasize the fact that these approaches will be developed further in the future to increase the data available to understand material degradation under radiation. We do include a number of recent preliminary results that demonstrate the width at which these techniques can be deployed, with a special focus on reducing the dose a single sample emits, which is of high value to the nuclear material community due to the special focus of this field of research. We also want to emphasize the fact that despite the rather recent introduction of many of these techniques to the nuclear material community, a significant amount of research is still needed to fully understand and appreciate the depth to which they can be deployed and deliver meaningful data.
ACKNOWLEDGMENTS
Funding was provided by the DOE-NEUP Project No. 13-5161 as well as the I-NERI program and the National Academy Keck Futures Initiative (NAKFI). We particularly appreciate D. Bhattacharyya, D. Frazer, S. Parker, A. Lupinacci, A. Reichardt, N. Bailey, Hi Tin Vo, Z. Huang for providing images and data not published previously to help illustrate the techniques available today. The corresponding author also want to thank Marie Anne Hosemann for quiet support as well as Nicole, Karl, and Ana Hosemann for backup support.