

1. Introduction
In parliamentary systems, legislative parties are the building blocks for executives. Under the design of parliamentary democracy, legislative parties install new governments, either implicitly or via explicit investiture votes. Leading figures in legislative parties fill all or most of the ministerial posts in cabinets. Legislative parties approve or block bills introduced by executives. And legislative parties sustain or cut short government duration.
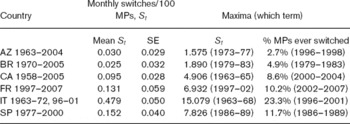
A standard assumption in the large literature on parliamentary government is that legislative parties constitute fixed units from one election to the next. In some circumstances, this assumption fails. For instance, 9% of legislators in the Canadian lower house changed party affiliation at least once from 2000 to 2004 (Canada, 2007). More spectacularly, 23% of Italian deputies switched parties between 1996 and 2001 (Heller and Mershon, Reference Heller and Mershon2005).
How is legislative party switching linked to the politics of coalition? Answers to this question are not yet clear, despite the achievements of recent studies of party switching (e.g., Desposato, Reference Desposato2006; Heller and Mershon, Reference Heller and Mershon2003, Reference Heller, Mershon, Heller and Mershon2009a, Reference Heller, Mershon, Heller and Mershon2009b, Reference Heller and Mershon2009d; Laver and Benoit, Reference Laver and Benoit2003; Mershon and Shvetsova, Reference Mershon and Shvetsova2008a, Reference Mershon and Shvetsova2008b, Reference Mershon, Shvetsova, Heller and Mershon2009; Reed and Scheiner, Reference Reed and Ethan2003). This paper takes up this multifaceted question.
Since the question is multifaceted, any inquiry into the connections between party switching and coalition government must specify which of the multiple aspects of coalition politics might be affected by – or affect – switching behavior. The classic dependent variables in analyses of coalition are three:
• the composition of coalitions, understood as size (e.g., minimal winning), or party make-up (e.g., Laver and Schofield, Reference Laver and Schofield1990; Laver and Shepsle, Reference Laver and Shepsle1996; Riker, Reference Riker1962; Warwick, Reference Warwick2000);
• duration (e.g., Diermeier, Reference Diermeier, Weingast and Wittman2006; Diermeier and Stevenson, Reference Diermeier and Stevenson1999; King et al., Reference King, Alt, Burns and Laver1990; Warwick, Reference Warwick1992); and
• portfolio allocation (e.g., Browne and Frendreis, Reference Browne and Frendreis1980; Druckman and Warwick, Reference Druckman and Warwick2001; Mershon, Reference Mershon2001, Reference Mershon2002; Schofield and Laver, Reference Schofield and Laver1985).
Recent contributions to the literature investigate the government's ability to manage and secure approval of its legislative initiatives as a fourth area (e.g., Martin and Vanberg, Reference Martin and Vanberg2004, Reference Martin and Vanberg2005).
This paper treats government composition as an independent variable, examining its effect on the direction of legislative party switching. I also probe portfolio allocation as a dependent variable responsive to patterns in party switching. The key assumptions I make are that multiple motives drive members of parliament (MPs), and that MPs weigh the choice of party affiliation as a strategic decision recurring throughout the legislative term. I assume as well that cabinet members, leading MPs, and the legislative rank-and-file recognize the fundamental parliamentary principle of the government's dependence on the legislative balance of power. I argue that MPs switch parties in response to different inducements brought to the forefront at distinct stages of the parliamentary cycle (cf. Mershon and Shvetsova, Reference Mershon and Shvetsova2005, Reference Mershon and Shvetsova2008a, Reference Mershon, Shvetsova, Heller and Mershon2009). Other things equal, switches out of governing parties should be relatively rare, and switches should affect the redistribution of ministerial offices over the course of the legislative term.
The second section of the paper recasts recent research on coalitions and lays the basis for hypotheses about the links between legislative party switching and coalition politics. In the third section, I address elements of research design. Fourth, I appraise hypotheses against data from Australia, Britain, Canada, France, Italy, and Spain. The fifth part draws out the implications of the study.
2. Links between legislative party switching and executive coalitions
Inducements to switching as a function of the parliamentary cycle
In this approach, the parliamentary cycle includes legislative stages and also the electoral stage that occurs before or during the official campaign for the next legislature and that, assuming backwards induction, affects behavior in the term. The different stages of the parliamentary cycle hold out different mixes of incentives to legislators, make some incentives more prominent at some times than others, and thus highlight different motivations for legislators (Mershon and Shvetsova, Reference Mershon and Shvetsova2008a, Reference Mershon, Shvetsova, Heller and Mershon2009). Hence I treat legislative parties as endogenous coalitions (Mershon and Shvetsova, Reference Mershon and Shvetsova2005; cf. Laver, Reference Laver, Weingast and Wittman2006). Further, MPs themselves derive advantage from treating their legislative party affiliation as endogenous, choosing whatever party has more to offer them at any given time. Elsewhere I show that MPs act in ways consistent with this notion; and yet MPs' switching behavior is also deterred by the electoral costs they expect to be attached to the switch (Mershon and Shvetsova, Reference Mershon and Shvetsova2008a, Reference Mershon and Shvetsova2008b, Reference Mershon, Shvetsova, Heller and Mershon2009).
The second step in elaborating the approach is to specify why legislators might exit one party and enter another. A distinguished tradition holds that parties and politicians are motivated by office, policy, and votes (e.g., Strøm, Reference Strøm1990; Müller and Strøm, Reference Müller and Strøm1999). In line with this wisdom, I assume that MPs may hop parties so as to obtain parliamentary offices and privileges, achieve preferred policy outcomes, or position for re-election (cf. Desposato, Reference Desposato2006; Heller and Mershon, Reference Heller and Mershon2005, Reference Heller, Mershon, Heller and Mershon2009a; Laver and Benoit, Reference Laver and Benoit2003; Mejía Acosta, Reference Mejía Acosta2004; Mershon and Shvetsova, Reference Mershon and Shvetsova2005, Reference Mershon and Shvetsova2008a; Reed and Scheiner, Reference Reed and Ethan2003; Shvetsova, Reference Shvetsova2004). All of these motives may prove relevant to some degree (cf. Strøm, Reference Strøm1990) in each decision to change party, and thus none should be ignored. I add that their relative salience differs across specific periods, depending on what dominates the legislative agenda and hence which payoffs are most prominent, immediate, and available.
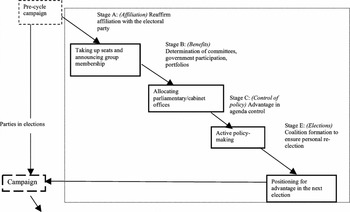
Figure 1 identifies stages in the parliamentary cycle where I expect switching to be motivated by distinct aims. I assume that the period of greatest salience of each motivation inducing switching can be identified at the outset, based on legislative records, institutional constraints, and events dominating decision making. Thus, by associating changes of partisanship with the periods when they occur, and by differentiating periods according to the set of payoffs being decided, I assess the relative impact of the goals of securing the benefits of office (including legislative perks), policy, and (re-)election.
Switching inducements during the parliamentary cycle

Stage A (for Affiliation) in the parliamentary cycle marks the transition from the popular vote to the taking up of legislative seats in the first session. Here MPs have the opportunity to alter the label on which they won election − when they announce group affiliation for the legislative session. I posit that MPs are motivated primarily by perks in stage A, for they respond to the availability of goods tied to membership in one parliamentary group or another, as shaped by internal legislative rules. Granted, policy aims are not absent, for office serves to mold policy.
Stage B (for Benefits) is when committee seats, committee chairs, and other legislative posts − and, in parliamentary systems, executive portfolios − are allocated. This division of positions of power should heighten office-seeking goals for MPs. Again, policy does not disappear as a concern, for office permits the pursuit of policy. But when offices are up for grabs, MPs' choices to switch or stay with their original party are driven chiefly by interest in office.
During stage C (for Policy Control), the legislative agenda focuses most heavily on policy domains relevant to a broad range of issues, and so should bring to a peak the salience of policy aims for MPs. I isolate the phases of greatest legislative activity in finance and constitutional matters, domains that, scholars concur, carry special weight and integrate choices on multiple dimensions (e.g., Laver and Shepsle, Reference Laver and Shepsle1996; Lijphart, Reference Lijphart1984). Given MPs' heightened focus on policy, switching in C should occur so as to affect policy and secure agenda control.
Stage E (for Election) closes the cycle in Figure 1. In this stage, electoral motivations should come to the fore and switching should chiefly aim at pre-electoral positioning. Figure 1 simplifies reality, and, in some institutional contexts, non-parliamentary elections may fall during the term and the stages linked to them enter into E. MPs' seats are not at stake, but MPs learn from opinion polls, which proliferate before elections, and from voting returns, which reveal stances and affiliations that promise or pay electoral benefits. Electoral aims should thus bring MPs to switch in proximity to non-parliamentary elections.
One stage, D (Dormant), does not appear in Figure 1. Stage D is all periods other than A, B, C, and E – a residual set of intervals between active stages. No distinctive switching by politicians driven by office, policy, or re-election – i.e., no switching – should occur in D, for it is more advantageous to switch in the active stages.
To recap: I propose that a legislator's choice of party is a strategic decision recurring throughout the legislative term. Absent constraints, MPs are open to switching parties as they pursue goals specific to the stage in the parliamentary cycle. I turn now to implications for coalition politics, and next to hypotheses.
Legislative switching and implications for the executive
An important segment of recent research on coalitions suggests that changes in parties’ expectations about their future legislative seat shares (shares to be decided at the next parliamentary election) should influence executive politics during the legislative term, before the next election is held. This work speaks to and builds on the essence of parliamentary design: the executive depends on the legislative balance of power. A few examples illustrate the logic in this body of inquiry. Changes in parties’ expectations about their future electoral fates – as informed by trends in public opinion polls – might lead a pivotal party to force a renegotiation of the policy agreement underpinning a coalition government. Or such changes might trigger the fall of a cabinet, as a party maneuvers for a greater share of ministerial payoffs, given its anticipation of a greater seat share. These insights about the impact of public opinion shocks are developed in theoretical work (Lupia and Strøm, Reference Lupia and Strøm1995; Grofman and von Roozendal, 1994; Laver and Shepsle, Reference Laver and Shepsle1996, Reference Laver and Shepsle1998) and assessed in theoretically guided empirical research (Martin, Reference Martin2007; on parties’ pre-electoral forecasts of seats, executive office, and policy, cf. Schofield and Sened, Reference Schofield and Sened2006).
In this paper the unit of analysis is the individual MP whose choices of party affiliation constitute and reconstitute the legislative party system. I not only assume that MPs are able to estimate future changes in parties’ legislative seat shares in light of public opinion polls. MPs are also able to act so as to effect immediate and concrete change in parties’ seat shares during the legislative term. For instance, MPs can switch in response to new information on citizen preferences disclosed in a stage E, or to heightened opportunities for agenda control that come in stage C. MPs thus redefine the balance of legislative power, via switching, during the term.Footnote 1
As MPs reconfigure the legislative party system during the term, consequences for coalition politics should unfold. This is the implication of recent research on public opinion shocks to coalitions; but the lesson is indirect, given the neglect of MP switching behavior. The direct inferences about the links between MP switching and executive politics can be drawn from the logic about inducements to switching during the parliamentary cycle.
Hypotheses
• Hypothesis 1: The rate of switching should vary over the course of the parliamentary cycle. Switching should be relatively frequent in the active stages, A, B, C, and E. Switching should be rare in stage D.
The reasoning about variation in switching behavior over the course of the parliamentary cycle transforms the indirect lesson of recent research on coalitions. The executive's dependence on the legislative balance of power in parliamentary systems is a two-way street. On the one hand, the composition of the executive should affect which way MPs switch. On the other, how switching is timed and which way MPs switch should affect patterns in portfolio (re-)allocation.
• Hypothesis 2: Rates of switching should vary by direction of switching. Switching out of parties in the executive coalition should be relatively unlikely. Switching among opposition parties or within the governing coalition should be relatively likely.
• Hypothesis 3: The higher the rate of switching at any point in the legislative term, the more likely a reallocation in ministerial portfolios. Since switches are very likely to alter the legislative balance of power, they should prompt changes in the balance of power in the executive, as reflected in cabinet office. The greater the legislative switching rate, other things equal, the greater the stimulus to shifts in portfolios should be.
• Hypothesis 0: Null. Switching rates should evince little or no variation between stage D and the active stages, and little or no variation by direction. Variation in switching rates should not trigger change in portfolio distribution.
3. Research design and methods
Switching and rates of switching
Like others in this field, I define a switch as ‘any recorded change in party affiliation on the part of a politician holding or competing for elective office’ (Heller and Mershon, Reference Heller, Mershon, Heller and Mershon2009b). I am interested not only in raw numbers of switches but also, and above all, in rates of switching. I use the number of switches per 100 MPs in month t of the legislative term, St, as the standardized measure of the frequency of switching. In the terms of event history analysis, this standardized measure is the rate of occurrence of the event of switching. The stages I isolate constitute risk periods in the logic of event history models (e.g., Box-Steffensmeier and Jones, Reference Box-Steffensmeier and Jones2004).
Case selection: countries
I choose country cases so as to maximize variation in institutions and party systems. The reasoning is that the greater the variation captured in institutional and partisan settings, the more robust the evaluation of hypotheses will be.
The country selected for in-depth study evinces substantial variation over time in institutions and in the shape of the party system. Italy used open-list proportional representation (PR) for lower house elections before 1993. From 1993 to 2005, in contrast, hybrid laws combining PR, a 4% threshold for PR, and plurality in single-member districts (SMDs) regulated Chamber races (cf. Katz, Reference Katz, Soberg and Wattenberg2001). Before the 1970s, the regional level of governance stipulated in the Constitution was not established nationwide; starting in 1975, elections for all 20 regions emerged as important contests in their own right and as bellwethers for trends in non-concurrent parliamentary elections. The Christian Democrats (DC) qualified as the largest party in every national election from 1946 to 1992, and ruled Italy continuously from 1944 until early 1994, when the party split. The DC's dominance of the party system and its long-standing control of national executive office set Italy apart as an ‘uncommon democracy’, in a class with Japan (e.g., Pempel, Reference Pempel1990; cf. Kato and Mershon, Reference Kato, Mershon and Kawata2006; Scheiner, Reference Scheiner2006). Italy's 1994 election registered very high volatility and ushered in a new party system that lacks a single anchoring centrist party akin to the DC. Two electoral alliances, center-right and center-left, have instead evolved and have alternated in government.
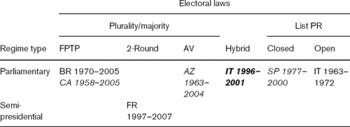
Whereas intensive scrutiny of one country allows the analyst to observe posited causal processes close at hand, evidence from a broader range of countries permits appraisal of the generalizability of an argument. Thus, balancing depth and breadth, I extend the study to Australia, Britain, Canada, France, and Spain. As Table 1 illustrates, the full complement of these country cases affords relatively great institutional variation. In particular, variation in electoral laws contributes to differentiation in party systems (e.g., Cox, Reference Cox1997; Ordeshoook and Shvetsova, 1994), which in turn affects the likelihood of multi-party government (Laver and Schofield, Reference Laver and Schofield1990, among many others). Variation in territorial governance implies variation in the occurrence and import of sub-national elections; and legislative switching prompted by a stage E should in turn feed into pressure for portfolio reallocation. The inclusion of Fifth Republic France pushes the field of observation beyond parliamentary democracies. Even in this semi-presidential system, the partisan affiliations of the prime minister and cabinet reflect the partisan balance of power in the legislature.Footnote 2 By comparing this country case with others, all the same, I probe the extent to which the unusual strength of the executive vis-à-vis the legislature in the Fifth Republic loosens the link between legislative switching and the composition of the executive; given the time frame studied, I can also compare the effects of switching under cohabitation and unified government.
Case selection: countries and legislative terms

Note: Federal and regionalized systems appear in italics. Primary case (where all hypotheses are examined) appears in boldface. For subsidiary cases, only hypotheses relating to the direction of switching and the impact of switching on portfolio allocation are assessed.
Case selection: legislative terms
In my primary country case, I select for the most intensive study the particular legislative term that qualifies as that with the highest number of switches for any term to date. Specifically, during the 1996–2001 term, the total number of switches carried out in the 630-member Italian Chamber stood at 277. Critics might argue that this criterion is problematic because it directs attention to a legislature when MPs were still adapting to a new institutional and partisan environment, especially since the share of neophytes in the 1996–2001 Chamber was relatively high (Verzichelli, Reference Verzichelli1996: 391–413; Zucchini, Reference Zucchini, Capano and Giuliani2001: 172). Yet I see this possibility as a source of strength in the design: if I find that, even during the relatively uncertain 1996–2001 Chamber, switching varies according to type of incentive dominant in distinct stages, then I am likely to find elsewhere that switching varies by stage in the parliamentary cycle.
I compare the Italian Chamber's exceptional 1996–2001 term with two terms during the period of DC dominance, 1963–68 and 1968–72, both of which saw reorganization and disruption on the left, which even involved, to an extent, the Communist Party. I thus capture within-nation differences in institutional and partisan settings and also differences in rates and patterns of switching. Before 1994, switching tended to entail MP moves en bloc, as parties split or merged. Solo hops became much more common after 1994 (Heller and Mershon, Reference Heller and Mershon2005, Reference Heller and Mershon2008).
Whereas practical concerns lead me to restrict assessment of the first hypothesis to one country and one strategically chosen term,Footnote 3 I appraise the second and third hypotheses for a total of 51 country-terms. As indicated in Appendix B, the country-terms studied furnish ample variation in switching behavior and over 2,000 monthly observations.
Operationalizing hypotheses
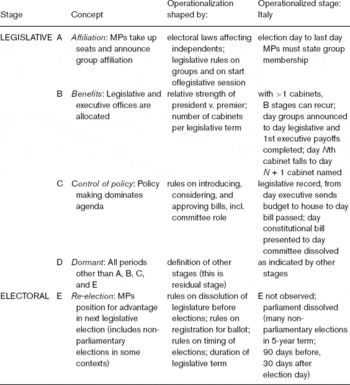
Operationalizing the first hypothesis hinges on operationalizing the risk periods envisioned. Central to the approach to demarcating the boundaries of stages in the parliamentary cycle is the proposition, again, that the time of the relative salience of each motivation that induces switching can be readily identified according to the parliamentary record, institutional prescriptions, and events that force decision making on a key policy dimension. Table 2 illustrates how I move from the general principle to specific definitions of stages for the 1996–2001 Italian Chamber. I identify stage A (Affiliation) as the interval between election day and the last day that MPs have to announce parliamentary group membership. I locate stage B (Benefits) from the last day of announcement of group membership to the day that the distribution of all legislative offices and executive portfolios is completed. For stage C (Control of policy), I set exogenous criteria for locating the periods of most intense policy bargaining on financial and constitutional dimensions, attending to such steps as the executive's transmittal of the annual budget bill to the legislature. Operationalization is simple for stage D (Dormant), since it is the residual set of intervals between active stages. Approaches to measuring stage E (Elections) can be several; as Table 2 indicates I designate a stage E specific to practices in Italy.
On operationalizing stages of the parliamentary cycle

Note: All stages save D can overlap or coincide. For details on operationalized stages, see Appendix A.
One obvious element in operationalizing Hypotheses 2 and 3 has already been identified: switches per 100 MPs in month t of the term, St. Beyond that, I track the direction of switching by partitioning the switching rate into four components: St from opposition to governing parties, and vice versa; and St within the circle of governing parties and among opposition parties as well. I identify portfolio allocations as occurring on two types of occasions: a change of government, marked by each change in party composition, change of premier, accepted cabinet resignation, and parliamentary election (cf. Mershon, Reference Mershon2002, among others); and a cabinet reshuffle, defined as ‘any change in ministerial personnel or responsibilities that affects more than two officeholders and at least two portfolios’ and that does not qualify as a change of government (Kam and Indriđason, Reference Kam and Indriđason2005: 329).
4. Empirical analysis: switching and coalitions
I am now equipped to evaluate my hypotheses. I turn first to the 1996–2001 Italian Chamber of Deputies, for which I probe the first hypothesis on variations in switching by stage in the parliamentary cycle. I then investigate evidence on the direction of switching and the consequences of switching across all country cases.
Switching by stage in Italy, 1996–2001
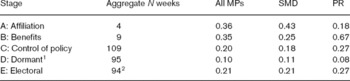
Table 3 compares the distribution of Italian legislators’ switches by aggregated stage in the parliamentary cycle. The top row reports mean weekly switches per 100 MPs at the opening of the term, when newly elected deputies must choose parliamentary group affiliation (stage A).Footnote 4 Although the Italian ballot structure inhibited independents from entering the Chamber, in stage A substantially more switching occurred among SMD deputies than among PR ones. In particular, all mobile SMD MPs in stage A opted for the motley Mixed Group, and all were center-leftists who in the 1996 race mounted broad appeals (Di Virgilio, Reference Di Virgilio, D'Alimonte and Bartolini1997, Reference Di Virgilio, D'Alimonte and Bartolini2002). When office benefits were allocated (stage B, second row), the pattern was flipped: switching in stage B was almost three times higher among PR deputies than among SMD ones. The rate of switching in proximity to sub-national elections (the aggregated stage E) nearly matched that registered in the policy stage (C). Mean weekly switches per 100 MPs dropped to their lowest rate in the aggregated stage D (dormant), after initial affiliations were announced, when neither benefits were allocated nor major questions of policy control dominated the agenda nor elections loomed. For both SMD and PR deputies, switching in D died down. By these data, the null hypothesis fails. Overall, Table 3 documents statistically significant differences in switching rates. The basic notion that switching behavior varies by stage (Hypothesis 1) finds support.Footnote 5
Mean weekly switches per 100 MPs by type of stage and by MPs' mode of election, 1996–2001 Italian Chamber

Note: Tukey test for differences of means (all MPs) across dormant and active stages (given overlapping of active stages): p < 0.10.
Sources: For switches Italy, Camera dei Deputati (2003); for boundaries of stages, see Appendix A.
1Stage D is all periods other than A, B, C, and E.
2The only observable electoral stages in Italy pertain to non-parliamentary elections.
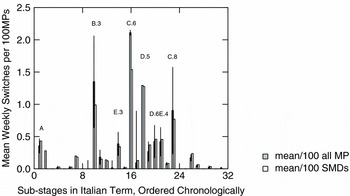
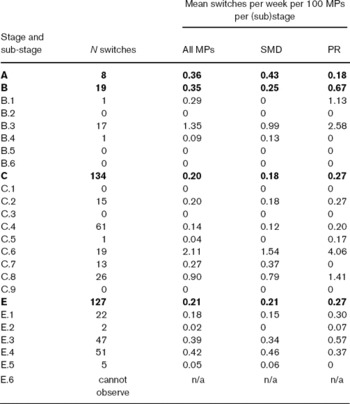
Further inspection of the first hypothesis calls for scrutiny of sub-stages. Figure 2 portrays mean weekly switching rates for all MPs and SMD MPs in each of the sub-stages, ordered chronologically, in the 1996–2001 Chamber; the behavior of PR MPs, as the remaining category, can be imputed. The error bars in the figure show standard errors, and sub-stages with relatively high rates are tagged.
Mean weekly switches per 100 MPs (all and SMD), by sequential sub-stage in term, 1996–2001 Italian Chamber (SEs in error bars).

As Figure 2 exhibits, the rate of occurrence of Italian switching is highest in a policy stage near the midterm. In October 1998, during what is coded as stage C.6, the Prodi government made a vote on the 1999 budget a matter of confidence, lost, and resigned. Communist Refounding (RC), not in the executive but until then routinely in its legislative majority, split on the confidence vote. Two long-standing RC leaders rallied their followers in opposing ranks. The pro-government majority of the RC created a distinct parliamentary group with a new name and, within two weeks, joined the executive. The dissidents entered the Mixed Group, unable to form a separate legislative party due to rules on minimum size. This evidence thus comports with the first hypothesis and hints at support for the second and third.
As Figure 2B also reveals, a benefits stage witnessed the second-highest peak in Italian switching. In stage B.3, legislative offices − seats and leadership posts on the large Bicameral Committee on Constitutional Reform (la Bicamerale) − were distributed. The Prodi government made constitutional reform one of its top priorities. Since the choice of rules carried profound consequences for policy outcomes (e.g., Riker, Reference Riker1982), appointments to la Bicamerale were intrinsically linked to high-stakes policy. The bulk of switches in B.3 involved MPs from the Christian Democratic Center-United Democratic Christians (CCD-CDU), the leftmost group in the center-right bloc. The moves were made en masse, as the CDU portion of what began as the unified CCD-CDU group split off and entered the Mixed Group. The day after the CDU bolted, its leader was named to la Bicamerale, with a seat on two of its four sub-committees.Footnote 6 Events in stage B.3 march with the first hypothesis.
The figure flags a number of other Italian sub-stages distinguished by relatively high rates of switching. To contest the May 1998 sub-national elections (coded as stage E.3 here), Senator and former President Cossiga founded a centrist party (the UDR, Union of Democrats for the Republic), which attracted MPs from the former CDU and CCD, as well as some with center-left origins. Not only did Cossiga pursue tightly linked electoral and policy aims (cf. Mershon and Shvetsova, Reference Mershon and Shvetsova2008a), but also the switches he spurred support the first hypothesis.
Next observe the string of stages after the peak in policy stage C.6. The single week classified as D.5 occurred in October 1998, between decisions on benefits in the D'Alema I cabinet (which replaced the ill-fated Prodi I), and the resumption of committee handling of the 1999 budget; all but one of the switchers in D.5 moved from the UDR to the Mixed Group. Stage D.6 preceded the electoral cycle defined by the June 1999 sub-national and European Parliament elections (E.4). In phase D.6, preparing for the 1999 elections, MP and former Premier Prodi launched the center-left Democrats-Olive Tree (Dem-U). Additional moves in stage E.4 enlarged the Dem-U. Other switches in the wake of the 1999 elections, still in E.4, created the Democratic Union for Europe (UDEur) as an organized component of the Mixed Group and as the successor to the UDR, also led by Cossiga. Chamber membership in the UDEur swelled sufficiently during policy stage C.8 to qualify it as a legislative group, and stage C.8 witnessed debates on finance so fierce that two days after the 2000 budget bill won approval, the government resigned. Together, these episodes feature moves responding to the initiatives of leaders in legislative – and executive – politics; and the moves coincided with policy controversy and electoral campaigns. Switchers did not always heed leaders: the UDR's shrinkage in stage D.5 followed policy conflicts that overturned one executive and ushered in another. Given the timing of D.5 and D.6 relative to benefit, policy control, and electoral phases, switching in these two sub-stages of the generally calm D does not upset the first hypothesis and even buttresses it.
For non-legislative electoral stages in Italy, I uncover evidence on vote-driven switching that aligns with the reasoning here. I cannot observe a parliamentary re-election stage in Italy, since the President dissolved the Parliament before the date of the 2001 election had been set and before the mandated day could be identified for depositing candidate names and party lists. I can apply the 90-day rule of thumb used for non-parliamentary elections, however, and count back from the earliest date of those in question. Not a single MP moved during the pre-electoral sub-stage so defined; one moved a few days before this sub-stage started. Thus, in Italy, jockeying for electoral advantage occurred in conjunction with sub-national and supranational elections (cf. Heller and Mershon, Reference Heller and Mershon2005). And since Italian MPs synchronized vote-seeking switching to non-legislative elections, they had tested the performance of their new electoral vehicles by the time the next parliamentary elections were held.Footnote 7
In the 1996–2001 Italian Chamber, significant differences in switching rates emerge across stages of the parliamentary cycle, and MPs engage in heightened switching for perks, office, policy advantage, and pre-electoral jockeying at distinctive stages. The first hypothesis finds ample support.
To judge from this evidence, MPs change party affiliation in response to different inducements highlighted at distinct temporal stages during the legislative term. How are variations in switching patterns linked to executive power? The institutional design of parliamentary democracy should suppress the rate of switching out of governing parties, since rank-and-file MPs should recognize the particular benefits of remaining loyal to a party controlling the executive, and leaders of governing parties should have especially strong incentives to maintain their legislative followings. To this I now turn.
Switching by direction
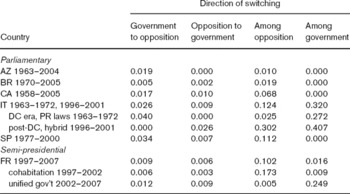
Table 4 compares, across all country cases studied here, mean monthly switches per 100 MPs (St) by direction of switching. The differences in means by direction are statistically significant, as the table records. In all parliamentary systems but one, switching from government to opposition is relatively uncommon, as held in the second hypothesis, and the highest switching rates are found either among opposition parties or among government parties.Footnote 8 Only in Australia are mean monthly switches per 100 MPs highest for exits from ruling parties.
Mean monthly switches per 100 MPs, by country and direction of switching

Note: p < 0.001 (Wilks' Lambda test, multivariate analysis of variance, with switching among government as omitted category).
Sources: Australia (2007); Butler and Butler (Reference Butler and Butler1986, Reference Butler and Butler2006); Canada (2007); France (2008); Italy (2003, 2008); Tomás Mallén (Reference Tomás Mallén2002).
What underlies the Australian exception? Over the four decades studied here, 85% of the Australian MPs who left governing parties (11 of 13) became independents; when St is recomputed focusing only on moves from governing parties to parties outside the executive, the switching rate for this direction drops to a mere 0.003. Moreover, 85% of Australian switchers overall (17 of 20) abandoned a party for independent status. This willingness to wear the independent label is comprehensible in light of the relatively strong incentives to nurture a personal reputation under the alternative vote (AV) system used to elect the Australian House. Indeed, according to a well-known ranking, such incentives are stronger under the AV system than under any other of the types of electoral systems studied here (Carey and Shugart, Reference Carey and Shugart1995).
In a sense, switching patterns in semi-presidential France align with those characteristic of the parliamentary systems here: moves from the government to the opposition are less frequent than are moves within the circles of opposition – and governing – parties. After all, in the Fifth Republic the President has been constrained to appoint a prime minister from the partisan bloc commanding a legislative majority; and cabinet appointments have also depended on the balance of power among legislative parties (e.g., Skach, Reference Skach2007). At the same time, though, the imprint of presidential power is clear. Under cohabitation between Chirac and Jospin, switching was greatest within the circles of the opposition center-right. It would thus seem that battle lines were relatively sharply drawn between supporters of the Gaullist President and those of the Socialist Prime Minister. Observe, too, that once the 2002 elections ushered in unified government under the center-right, switching within the ranks of the government rose substantially. Hence, under cohabitation and also − and even more so − under unified government, MPs of the President's bloc changed party affiliations while retaining bloc loyalty.
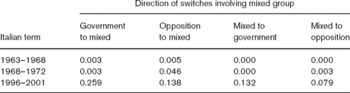
Table 4 illustrates sharp distinctions across Italian terms. Switching from government to opposition, absent in 1996–2001, traced to a party split in 1964, when left-wing Socialist MPs founded the Socialist Party of Proletarian Unity (PSIUP) parliamentary group. Switching among governing parties between 1963 and 1972 reflected the short-lived merger of the Socialists and Social Democrats, accomplished in 1966 and ended in 1969. Only in 1996–2001 was any switching from opposition to government registered. Yet the datum in Table 4 understates such flows, for it captures only direct moves, and the 1996–2001 Chamber is remarkable for the frequency with which mobile MPs used the Mixed Group as a temporary way-station en route to a new party home (cf. Heller and Mershon, Reference Heller and Mershon2005). Table 5 focuses on switching to and from the Mixed Group, documenting for the 1996–2001 term relatively frequent transits in all directions but one: from the Mixed Group to the opposition center-right bloc. To appreciate the implications of the data arrayed in Table 5, consider that in 1996–2001 only 3.7% of MPs moved directly from one bloc to another, whereas 7.3% crossed blocs at some point.Footnote 9 Most traveled from the opposition center-right to the governing center-left after sojourns in the Mixed Group.
Mean monthly switches to and from mixed group per 100 MPs, three Italian terms

Note: p < 0.005 (Wilks’ Lambda test, multivariate analysis of variance, with mixed to opposition as omitted category).
What governments look like shapes which way MPs switch: defections from ruling parties to the opposition are rare, as the second hypothesis holds. The next step is to investigate whether peaks in legislative switching spur reallocations of executive office.
Switching and the timing of portfolio reallocation
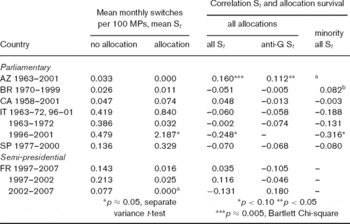
I conduct two preliminary, very simple plausibility probes of the hitherto unexamined notion that changes in the legislative balance of power, as effected by party switching, have an impact on the balance of power within the executive, as expressed in the distribution of offices.Footnote 10 First, I compare differences in mean switching rates, country by country, between months in which the assignment of executive offices remained the same and months in which reallocations occurred. According to the third hypothesis, months with reallocations should have higher mean switching rates than do those without reallocations. As the left side of Table 6 displays, this expectation is borne out only for Canada, Italy, and Spain; the difference in means approaches statistical significance only in 1996–2001 for Italy. To recast this result, the third hypothesis finds support only in the parliamentary systems with relatively high overall switching rates. Corroboration is firmest where the switching rate is highest of all. By the light of these data, it is only in parliamentary systems and only above a certain threshold that re-equilibrations of the partisan balance in the legislature influence the distribution of executive offices.
Mean switching rates across months without and with portfolio allocations, and Pearson correlations between switching rates and observed survival time of portfolio allocation, by country

Notes: anti-G: switching from government to opposition.
aInsufficient data for test of significance.
bFewer than ten observations.
Dashes indicate no observations of such switching or such portfolio allocations.
Sources: On switching, see Table 4; on changes of government and cabinet reshuffles, Canada (2008); Kam and Indriđason (Reference Kam and Indriđason2005); France (2008), Istituto Cattaneo (2008) and the European Journal of Political Research (various issues).
Next, country by country, I compute Pearson correlations between, on the one hand, monthly switches per 100 MPs (and one component of the overall switching rate, St from government to opposition) and, on the other hand, the number of months until the next occurrence of either a change in government or a cabinet reshuffle, that is, the observed survival time of a particular portfolio allocation, in the terms of event history analysis. I also compute the correlation between the overall switching rate and the survival time of portfolio allocations in minority governments alone, in light of the established finding that minority cabinets are relatively short-lived (e.g., Diermeier, Reference Diermeier, Weingast and Wittman2006; Kam and Indriđason, Reference Kam and Indriđason2005). The third hypothesis implies negative correlations, since the higher the switching rate, the shorter the observed portfolio allocation should be. As the right side of Table 6 exhibits, negative correlations prevail but positive relationships also appear. Only in Italy and Australia do the correlations between legislative switching and executive survival approach or attain statistical significance. The clearest support for the third hypothesis once more emerges in 1996–2001 Italy. In contrast, the Australian data disconfirm the reasoning here: as legislative switching increases, the observed duration of a particular distribution of executive offices increases as well. This pattern holds even for switching out of Australian governing parties. Recall, however, that most Australian switching entails the adoption of independent status, not the strengthening (or weakening) of opposition parties. Australian switching rates are also low relative to those registered in Canada, Italy, Spain, and France (as shown in Table 6 and Appendix B). In this context, the occasional MP's decision to opt for independent status − a likely response to the incentives offered by the AV electoral rules − has not disturbed but has instead entrenched the configuration of partisan appointments to executive office.
On the whole, this body of preliminary evidence suggests that legislative switching prompts a shift in the balance of power in the executive only in parliamentary systems where party switching is relatively frequent. This finding speaks to the essence of parliamentary design − executive dependence on the legislature − and highlights the importance of the distinction between parliamentary and semi-presidential design.
5. Conclusions
Legislative party switching is a strategic phenomenon. Legislators choose, change, and retain partisan affiliation in response to incentives in their environment. In 1996–2001 Italy, significant differences in switching rates appear across stages of the parliamentary cycle, and legislators engage in heightened switching for perks, office, policy advantage, and pre-electoral jockeying at distinctive stages. Phases of relative calm in the legislative agenda induce relatively low rates of switching. The salience of distinct activities on the legislative calendar thus does affect switching behavior.
Analysis of all country cases here is premised on the notion that legislators in parliamentary democracies, as strategic actors, recognize the powers of the legislative party (or coalition of legislative parties) controlling the executive and recognize too the executive's dependence on the balance among legislative parties. Across the 51 terms and six countries studied, MPs relatively rarely switch from government to opposition parties. Evidence of a threshold effect emerges with regard to the link between legislative switching and the timing of reallocation of executive office. Where the incidence of switching is greatest (1996–2001 Italy), peaks in switching most clearly spur the redistribution of executive office. A similar though less pronounced tendency appears in Canada and Spain, the two parliamentary democracies in this set with the highest switching rates after Italy. In Australia, where switching is relatively uncommon, executives become more long-lived, not less so, as upticks in switching occur. This finding indicates the possibility that the few switches observed in Australia − most of which entail the adoption of independent status − induce the leaders and the legislative rank and file of the governing party to work to postpone elections until the legislature nears the end of its mandated term. The existence of one-party majority governments and the relatively small number of parties in the Australian House may have facilitated this strategy. This point leads to the next.
The broad comparisons I draw permit an additional tentative inference. Systems with some variant of plurality or majoritarian electoral rules tend to have lower switching rates, both because fewer parties existFootnote 11 and because switching tends to be less advantageous. In a two-party system resulting from SMD rules, switches necessarily occur between the minority and the majority. Switching is polarizing and visible, and yet unlikely to be effective − to allow switchers to redirect the policy agenda or win votes. Conversely, PR tends to provide more parties among which to switch and, indirectly, creates more opportunities to switch in parliamentary and semi-presidential systems, since it makes coalition governments more likely and coalitions do not last as long as single-party majorities (see, among many others, Laver and Schofield, Reference Laver and Schofield1990). This inference, though provisional, is confirmed in a large-N analysis extending to nine countries and over 3,000 observations, using more advanced methods than those here, and controlling for multiple institutional effects (Mershon and Shvetsova, Reference Mershon and Shvetsova2008b).
As legislators switch parties in pursuit of the benefits of perks, office, policy, and electoral advantage at distinct stages of the parliamentary cycle, they re-equilibrate the balance of power among legislative parties. These strategic redefinitions are linked to executive politics in multiple ways. MPs recognize the prerogatives of ruling parties, and so relatively rarely defect from them. By the light of the evidence here, where and when switching is highest, it stimulates reallocations of executive office. Thus, on the whole, findings on the six countries and 51 terms here march with the argument presented in this paper. The results carry added weight given the range and diversity of settings investigated.
Distribution of MPs' switches, by active legislative stage and sub-stage and by MPs' mode of election, 1996–2001 Italian Chamber, with detailed key to stages

Key to stages, Italy, 1996–2001:
Stage A = Election day (21-IV-96) to last day that MPs must announce membership in parliamentary groups (14-V-06, two weekdays after first session of legislature on 9/10-V-96)
Stage B = In a legislative term featuring one executive, day groups announced to day all legislative and executive payoffs completed; since multiple executives govern during the 1996–2001 term, stage B is not continuous and is defined as the sum of sub-stages B.1 through B.6.
B.1 = Day groups announced (14-V-06) to day payoffs in first cabinet announced (18-V-96)
B.2 = Day executive payoffs allocated to day allocations of all legislative payoffs are completed (Chamber leadership elected 9-V-96, 15-V-96; committee assignments completed and committee chairs elected (5-VI-96)
B.3 = Day la Bicamerale gains 2/3 approval in lower house (22-I-97) to day committee elects chair (includes days that committee appointments are made) (5-II-97)
B.4 = Day government falls (9-X-98) to day new cabinet offices announced (21-X-98)
B.5 = Day government resigns (18-XII-99) to day new cabinet payoffs named (21-XII-99)
B.6 = Day government resigns (17-IV-00) in light of preceding day's losses in regional elections, to day new executive payoffs announced (25-IV-00)
Stage C is defined for decision-making on the national budget and on constitutional reform. Sub-stages are listed chronologically by start date, though some sub-stages overlap.
C.1 = Day Senate transmits to lower house constitutional bill for establishment of Bicameral Committee on Constitutional Reform (30-VII-96), to day lower house grants first approval of committee, known as la Bicamerale (2-VIII-96)
C.2 = Day executive presents 1997 budget bill (legge finanziaria) for first reading in Chamber (30-IX-96) to day 1997 budget gains final approval in both houses (22-XII-96)
C.3 = Day Senate grants second (2/3) approval of la Bicamerale and transmits revised bill to Chamber (16-I-97) to day la Bicamerale gains required 2/3 approval in Chamber (22-I-97)
C.4 = Day la Bicamerale chair begins to direct work of committee (5-II-97) to day Chamber President removes unified text of constitutional reforms from agenda due to interparty discord (9-VI-98); la Bicamerale dissolved same day. Some individual articles of Constitution are amended after 9-VI-98, but effort to frame integrated package of reforms is abandoned.
C.5 = Day Senate transmits 1998 budget bill for first reading in lower house (22-XI-97) to day 1998 budget gains final approval from both houses (18-XII-97) (wholly subsumed within C.4)
C.6 = Day executive presents 1999 budget bill for first reading in lower house (30-IX-98) to day conflicts over budget (and to some degree foreign policy) lead to fall of government on confidence vote (9-X-98)
C.7 = Day committee work relevant to 1999 budget bill resumes in lower house (28-X-98) to day 1999 budget gains final approval from both houses (20-XII-98)
C.8 = Day Senate transmits 2000 budget bill for first reading in lower house (15-XI-99) to day 2000 budget gains final approval from both houses (16-XII-99)
C.9 = Day government presents 2001 budget bill for first reading in lower house (30-IX-00) to day 2001 budget gains final approval from both houses (22-XII-00)
Stage E is defined for major sub-national elections and for European Parliament elections. ‘Major’ sub-national elections are isolated as those involving numerous, populous, and prominent areas of the national territory.
E.1 Ninetieth day before first round of elections (27-I-97) to thirtieth day after second round (10-VI-97)
E.2 90th day before first round (18-VIII-97) to 30th day after second (30-XII-97)
E.3 90th day before first round (23-II-98) to 30th day after second (7-VII-98)
E.4 90th day before first round (15-III-99) to 30th day after second (27-VII-99)
E.5 90th day before elections (17-I-00) to 30th day after (16-V-00)
E.6 Electoral stage leading up to 2001 parliamentary elections cannot be observed, since on day President dissolves Parliament (9-III-01), choice of election day (either 6-V or 13-V) is narrowed down but not yet decided.
Sources: Annual chronologies available at www.istcattaneo.org/archivi;
Ministry of Interior information at http://cedweb.mininterno.it;
http://www.mininterno.it/sezioni/attivita/Le%20elezioni/s_000000056.htm,
http://www.mininterno.it/sezioni/attivita/Le%20elezioni/s_000000056.htm;
Pasquino 1999; and documentation at the Chamber of Deputies website: http://www.camera.it/chiosco_parlamento.asp?content=/parlam/leggi/home.htm,
http://www.camera.it/chioschetto.asp?content=/_dati/leg13/lavori/stenografici/jvhomefr.htm, http://www.camera.it/parlam/bicam/rifcost/,
http://www.camera.it/chioschetto.asp?content=/_dati/leg13/lavori/stencomm/tabaud.htm,
http://www.camera.it/chioschetto.asp?content=/_dati/leg13/lavori/stencomm/tabpdl.htm?,
http://www.camera.it/chioschetto.asp?content=/_dati/leg13/lavori/stencomm/tabindag.htm,
http://www.camera.it/chioschetto.asp?content=/_dati/leg13/lavori/bollet/00r.htm, and
The incidence of switching, by country

Note: Across the six countries, the study covers a total of 51 terms and over 2,000 monthly observations.