I. INTRODUCTION
In recent years, efficient use of energy has attracted a great deal of attention from leading economies due to the looming shortage of fossil fuels and concerns about climate change. The direct conversion of waste heat released by industrial processes and automobile engines into electrical energy has led to increasing research interest in thermoelectricity.Reference Bell1 The development of thermoelectric (TE) generators operating at intermediate temperatures, i.e., up to 400–500 °C at the hot junction, is crucial because large amounts of waste heat from existing technical processes and energy machinery are available within this temperature range. For this purpose, PbTe-based complex chalcogenides and silicidesReference Hachiuma and Fukuda2 are among the most promising TE converter materials. To develop TE materials with high performance, i.e., with a large dimensionless figure of merit ZT = (S 2σ/κ)T (T is the absolute temperature), one needs to tune electronic and phononic properties to combine a high electrical conductivity, σ, and high thermopower (Seebeck coefficient), S, with a low thermal conductivity, κ.
The recently developed quaternary AgPbmSbTe2+m (m = 18, lead–antimony–silver–tellurium, LAST-18) compound has gained much attention due to its high reported ZT values,Reference Zhou, Li and Kita3–Reference Quarez, Hsu, Pcionek, Frangis, Polychroniadis and Kanatzidis5 and is thus considered as a highly promising intermediate temperature TE material. The enhancement of ZT in LAST-18 compounds was attributed to the remarkable decrease in lattice thermal conductivity, which ascribed to the scattering of heat-carrying phonons by coherent nanostructures rich in Ag and Sb embedded in the matrix.Reference Hsu, Loo, Guo, Chen, Dyck, Uher, Hogan, Polychroniadis and Kanatzidis4–Reference Vineis, Shakouri, Majumdar and Kanatzidis8 The coherent interfaces between the nanostructures and the matrix will decouple the beneficial phonon scattering effects from the adverse carrier scattering phenomena leading to a low lattice thermal conductivity without any deleterious impact on the electrical conductivity.Reference Cook, Kramer, Harringa, Han, Chung and Kanatzidis6 This is a promising mechanism by means of which one can tailor the bulk material properties by formation of thermodynamically stable nanostructures. This tailoring can be achieved by the selection of appropriate melt synthesis routes and subsequent heat treatments or by matrix encapsulation techniques.Reference Hsu, Loo, Guo, Chen, Dyck, Uher, Hogan, Polychroniadis and Kanatzidis4–Reference Sootsman, Pcionek, Kong, Uher and Kanatzidis13 Nanostructured bulk materials of that type present advantages in comparison to their artificially nanostructured thin film counterparts, e.g., grown from either chemical vapor deposition or by molecular beam epitaxy because (i) they are relatively inexpensive to fabricate, (ii) they can withstand high temperature gradients, and (iii) they are required in large quantities in the vast majority of applications. The reduction in thermal conductivity in LAST compounds was also attributed to compositional fluctuations in the matrix,Reference Zhou, Li and Kita3, Reference Hsu, Loo, Guo, Chen, Dyck, Uher, Hogan, Polychroniadis and Kanatzidis4 which can be linked to ordered arrangements of Ag and Sb atoms in the unit cell.Reference Bilc, Mahanti and Kanatzidis14, Reference Hazama, Mizutani and Asahi15 There were controversial reports about the TE properties of the LAST compounds in subsequent studies,Reference Kosuga, Uno, Kurosaki and Yamanaka9 which were later explained by different degree of macroscopic heterogeneities in the material due to different fabrication procedures.Reference Chen, Gascoin, Snyder, Mueller, Karpinski and Stiewe10
The main focus of this study is to understand conditions that favor the formation of nanostructures to improve the TE performance of LAST-18 compounds. It seems evident from literatureReference Hsu, Loo, Guo, Chen, Dyck, Uher, Hogan, Polychroniadis and Kanatzidis4–Reference Sootsman, Pcionek, Kong, Uher and Kanatzidis12 that to optimize the microstructure with nanoparticles and thereby to obtain superior TE properties, a huge number of trials involving different annealing temperatures and periods would be required, a procedure which is both cost and time demanding. Thus, in an attempt to shorten these efforts a variety of annealing temperature conditions was established simultaneously employing a combinatorial approach using a gradient annealing method in this study. Long-term annealing resulted in the formation of nanocomposites within the LAST matrix with varying volume fractions of Ag2Te and Sb-rich precipitates depending on the annealing temperature. High ZT values of about 1.05 at 425 °C were obtained for the sample disc annealed at 505 °C for 1 week. These results will also aid for the future development of reproducible fabrication methods of highly effective LAST compounds.
II. MATERIAL AND EXPERIMENTAL TECHNIQUES
Polycrystalline ingots of AgPbmSbTe2+m (m = 18) (lead–antimony–silver–tellurium, LAST-18) compounds were produced by heating up evacuated and sealed quartz ampoules containing high purity (99.999%) Ag, PbTe, Te, and Sb to 1020 °C within 5 h and keeping the melt for 2 h in a rocking furnace. The ampoule was then quenched in cold water. For TE characterization, sintered pellets were needed because of their better mechanical stability as compared to the quenched ingots. Thus, the ingots were ground into powder with an agate mortar and pestle. The resulting powders were subsequently charged into a graphite die of 15 mm in diameter and short-term sintered for 10 min under technical vacuum (10−2 mbar) in a direct current (DC) sintering press at 400 °C and 56 MPa to obtain pellets or cylindrical discs of the desired thickness.
Metallographic examination was performed by scanning electron microscopy (SEM) using a Carl Zeiss Ultra 55 microscope (Carl Zeiss, Bremen, Germany) equipped with energy dispersive x-ray spectroscopy (EDS). Comparability evaluation of the EDS spectra was conducted using standardless atomic number (Z), absorption (A), and fluorescence (F) correction and a batch routine for the subtraction of bremsstrahlung background. The measurement error was estimated to be ±2%. Transmission electron microscopy (TEM) was used to observe nanostructures in preselected parts of the LAST material. TEM lamellae were prepared using focused ion beam (FIB) method (Carl Zeiss Auriga equipped with a Cobra column and a gas injection system) with a Ga+-beam operating at 30 kV for machining. The lamellae were analyzed in a Hitachi H-8100 (Hitachi, Krefeld, Germany) with scanning transmission electron microscope unit (beam diameter of ∼5 nm) and EDS. High resolution transmission electron microscopy (HRTEM) imaging was realized in a JEOL JEM 4010 (JEOL Eching, Germany) with a point-to-point resolution of 0.155 nm operating at 400 kV. To avoid surface artifacts introduced by Ga+ ions, final thinning was done by ion milling using Ar+ with 7° incident angle at 2.5 keV.
Powder x-ray diffraction (XRD) was used to identify the structure of LAST samples produced by different routes. The atomic structure was refined by Rietveld full profile analysis using “FullProf 2000.”Reference Rodriguez-Carvajal16 The diffraction patterns were recorded using a Hueber G670 diffractometer (Hueber, Rimsting, Germany), with 2θ between 10 and 100°, at a step size of 0.005°. Both CuKα and MoKα radiations were used because CuKα presents a better resolution while MoKα leads to higher penetration depth. The data are presented as a function of the scattering vector Q = 4π/λ Sin θ. The background was refined using a sixth order polynomial approximation, and the peak profile was described by a pseudo-Voigt function.
To verify the mechanical properties, the elastic moduli of LAST-18 compounds were obtained at room temperature using resonant ultrasound spectroscopy (RUS).Reference Migliori, Sarrao, Visscher, Bell, Lei, Fisk and Leisure17 A parallelepiped sample was polished and placed between two acoustic LiNbO3 transducers, and the response of the sample to sinusoidal stress was recorded as a function of frequency to identify the vibrational eigenfrequencies. The elastic moduli are obtained by least squares fitting of these frequencies.Reference Migliori, Sarrao, Visscher, Bell, Lei, Fisk and Leisure17 By evaluating a large number of resonant frequencies, it was feasible to obtain the bulk and shear moduli, Poisson’s ratio, and sound velocity.
The local distribution of the Seebeck coefficient S(x,y) on the sample surfaces was measured at room temperature using an in-house developed potential and Seebeck microprobe (PSM). Electrical conductivity measurements were performed by the standard four-probe DC method in vacuum. The potential difference ΔV and temperature difference ΔT between the hot and cold side of the sample were measured in vacuum with an in-house-built setup between room temperature and 500 °C to obtain the Seebeck coefficient S.
The thermal conductivity, κ, was calculated by κ = Dc pρ, where ρ is the sample density that was determined using the Archimedes method, D and c p are thermal diffusivity and specific heat, respectively, which were measured using a Netzsch LFA 427 (Netzsch, Selb, Germany) and Netzsch DSC 404, respectively. The error bar for the measurements was estimated to be ≤5% for σ and S, and 8% for κ.
III. EXPERIMENTAL RESULTS AND DISCUSSION
A. Gradient annealing method, PSM, and microhardness scans
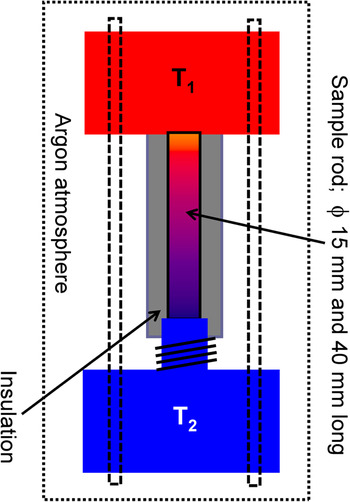
In this study, a gradient annealing method was developed to find out about the optimal annealing temperature in an economic manner and thereby to study the evolution of the microstructure and identify routes toward its stability. The practical target of this study was to achieve reproducible temperature-dependent TE properties. Figure 1 shows the schematic of the experimental setup for annealing in a temperature gradient. A cylindrical bar of 40 mm in height and 15 mm in diameter was produced via short-term sintering. A constant gradient of 10 K/mm was maintained for 1 week in argon atmosphere by keeping the two ends of the bar at 200 and 600 °C, respectively (see Fig. 1). The sample was positioned in a way that the heat could transfer to the cold side only along the sample axis. The forming internal temperature profile along the rod was estimated from temperature-dependent thermal conductivity data of the as-sintered sample and by solving the steady state heat transfer equation using the ANSYS simulation software18 providing boundary conditions of the experimental setup.
Schematic of the experimental setup for long-term annealing treatment in a temperature gradient. T 1 = 600 °C and T 2 = 200 °C.

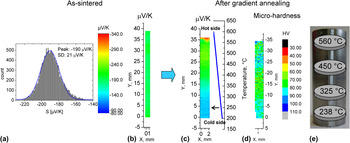
First, Seebeck scans using PSM were performed at room temperature to obtain an overview of the initial homogeneity (or content of inhomogeneity) of the material.Reference Chen, Gascoin, Snyder, Mueller, Karpinski and Stiewe10 The PSM scan on the as-sintered bar, see Fig. 2(b), resulted in a Gaussian distribution of the Seebeck values with an average of −190 μV/K and a standard deviation of only 21 μV/K [Fig. 2(a)], indicating a rather good chemical homogeneity of the sintered bar. The subsequent Seebeck scan on the same surface after annealing in a temperature gradient reveals a gradient in the Seebeck coefficient distribution ranging from −285 to −130 μV/K from the hot to cold side, respectively [see Fig. 2(c)]. The functional properties are thus in good approximation, i.e., one-dimensionally graded along the temperature gradient, and the properties distribution is radially symmetric, which indicates that an essentially homogeneous temperature field has been established along the axis during annealing, as intended. Moreover, the gradient in microhardness values along the bar, see Fig. 2(d), is also an indication that the functional gradient in the bar could be a result of the development of different microstructures.
Seebeck scans at room temperature taken at the surface of a cylindrical bar undergoing gradient annealing; left: before (as-sintered) and right: post annealing treatment. (a) Histogram [abundance distribution of Seebeck values occurring in the scan (b)]. (b) Area scans of the Seebeck coefficient obtained in the as-sintered condition. (c) Surface scans of the Seebeck coefficient and (d) microhardness values of the bar along its axis after annealing in a temperature gradient between 200 and 600 °C. According to the given temperature profile [blue line in (c)] that was maintained in the bar over 1 week, the temperature of annealing at the respective positions is indicated by an arrow in (c). (e) The schematic shows the disc samples and corresponding annealing temperatures that were used for material characterization as a function of annealing temperature.

B. Microscopy, XRD, and RUS
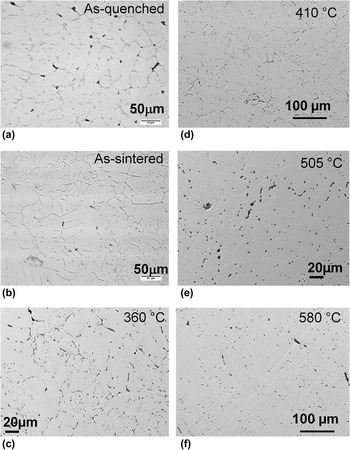
To study the microstructural and TE properties of LAST-18 compounds as a function of the annealing temperature, disk samples were sliced out at different positions of the bar as illustrated in Fig. 2(e). Thus, the position on the bar along its axis represents a particular annealing temperature according to the temperature profile shown in Fig. 2(c). The optical micrographs in Figs. 3(a) and 3(b) reveal the formation of secondary phases at grain boundaries in as-quenched and as-sintered samples, respectively. The sintered pellets and as-quenched ingots show similar microstructures indicating no significant influence of DC short-time sintering on the microstructure or on the nominal composition. Figures 3(c)–3(f) show Bstandard error (backscattered electron) images of samples annealed at different temperatures and reveal the presence of a tiny fraction of secondary phases without the formation of any kind of networks as seen in Figs. 3(a) and 3(b). There is also evidence from these micrographs that the volume fraction of these secondary phases decreases with increasing annealing temperature, which indicates homogenization of the material at higher annealing temperatures.
Micrographs of (a) as-quenched and (b) as-sintered samples and samples annealed at (c) 360 °C (d) 410 °C (e) 505 °C, and (f) 580 °C. It should be noted that annealing temperatures were chosen depending upon the location of cross-sectional discs carved out from the cylindrical bar annealed in a temperature gradient [cf. Fig. 2(e)].

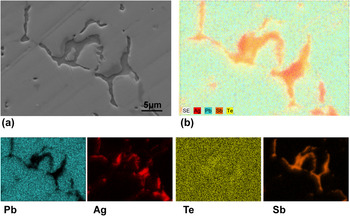
To understand the phase segregation and its chemical distribution, an in-depth EDS analysis was performed. Figures 4(a) and 4(b) show the Bstandard error image and cumulative EDS qualitative maps of Ag, Sb, Pb, and Te elements for the sample annealed at 238 °C for 1 week. The EDS maps of elements in Fig. 4 demonstrate that the Ag and Sb precipitates coexist adjacent to each other in the matrix, which would be very difficult to interpret only from the Bstandard error image shown in Fig. 3, despite the presence of strong material contrast. The separation of Ag and Sb precipitates from the matrix and from each other indicates their low solubility limits in the LAST matrix as well as within each other, which can be expected from the published equilibrium phase diagrams and other previous reports.Reference Gierlotka, £apsa and Fitzner19–Reference Dow, Oh, Kim, Park, Min, Lee and Wee23
(a) A backscattered electron image and (b) energy dispersive spectroscopy (EDS) qualitative mapping of Ag, Sb, Pb, and Te in a microstructure recorded at a sample annealed at 238 °C for 1 week.

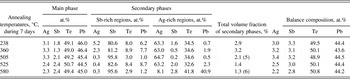
The chemical composition information obtained from the EDS analysis of various samples in different conditions are summarized in Tables I and II. Table I shows the compositional details of the main phase and secondary phases of the as-quenched sample. The main phase chemical composition is in good agreement with the nominal composition of LAST-18 compounds, whereas the secondary phases are rich in Ag, Sb, and Te and comprise less than 5% of total volume. Although more than 18 of such phases have been recorded through EDS, only the most frequently occurring phase compositions are shown here. From the Ag2Te–PbTe–Sb2Te3 quasiternary phase diagram, which can be partly deduced from respective quasibinaries such as Ag2Te–PbTe,Reference Blachnik and Gather24 Ag2Te–Sb2Te3,Reference Sugar and Medlin25 and PbTe–Sb2Te3,Reference Ikeda, Ravi and Snyder26 one realizes that these secondary phases are the resultants of eutectic reactions at the PbTe-poor side of the quasiternary system, of solid state precipitation processes, and of segregation due to the liquidus/solidus surfaces. As the sample solidifies between the liquidus and solidus, the melt is depleted in PbTe with decreasing temperature according to the phase diagram.Reference Maier27 Although this phase segregation behavior was not recorded in the published phase diagrams, it is consistent with the recent calculations of the phase diagram from Ref. Reference Barabash, Ozolins and Wolverton28.
Energy dispersive spectroscopy analysis of as-quenched sample.

EDS analyses carried out on secondary phases/precipitates, for examples those shown in Figs. 3(c)–3(f), found in samples annealed under different conditions confirm compositions close to Ag2Te and pure Sb. The compositional details for some of the annealed samples are shown in Table II. It is obvious from Tables I and II that long-term annealing has led to better homogeneity than found in the as-quenched/sintered material by reducing the total number of phases. Annealing above 500 °C brought about even better homogeneity by reducing the total secondary phase volume fraction. Based on the composition and their morphology (Fig. 4), the secondary phases were categorized into Sb- and Ag-rich regions, see Table II. More specifically, the Sb-rich regions can be described as Sb1-x-y(PbTe)x(Ag2Te)y, where x ≤ 0.06 and y ≤ 0.03, whereas the Ag-rich phases can be described as (Ag2Te)1-z(Pb1-nSbnTe)z, where n ≤ 0.2 and z ≤ 0.06. Here, z is above 0.9 for higher annealing temperatures, above 525 °C, which demonstrates the shrinkage of the Ag2Te precipitates as they dissolve in the matrix due to their increased solubility at higher annealing temperatures. At temperatures above 525 °C, the decrease in the total secondary phase volume fraction down to 1.4% is a clear indication of the increased solubility of Sb and Ag in the LAST matrix, which is also reflected as the near nominal chemical composition of the main phase (Table II). Nonetheless, the supersaturated Sb is at any temperature expelled from the lattice as a minor phase despite the long-term high temperature annealing conditions. This could be the governing factor for the phase segregation in LAST-18 compounds.
Energy dispersive spectroscopy analysis of annealed samples.

Balance compositions were determined by using volume fraction of secondary phases as weighted coefficients.
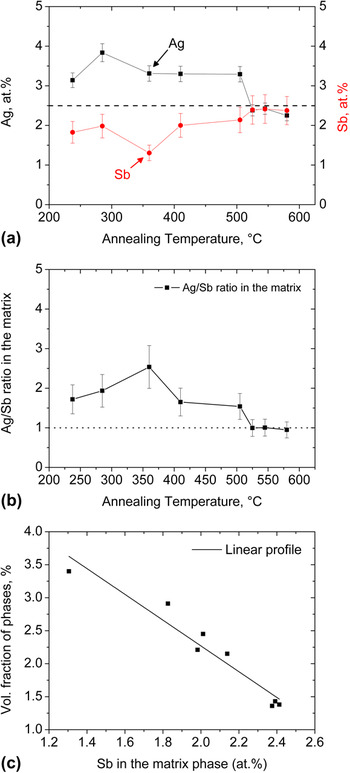
As the variation of the Pb and Te amounts with annealing temperature in the matrix is negligible, see Table II, the quantities of Ag and Sb in at.% recorded from the main phase can be plotted as a function of annealing temperature, see Fig. 5(a). In general, Fig. 5(a) reveals that the amounts of Sb and Ag reach their nominal initial composition of 2.5 at.% with increasing annealing temperatures. Thus, one can expect the Ag/Sb concentration ratio to be unity at higher annealing temperatures, as seen from Fig. 5(b). This indicates that the solubility of Ag and Sb in LAST compounds, i.e., in the PbTe matrix, increases at annealing temperatures above 505 °C, which hence turns out to be a homogenization temperature needed for producing a homogeneous material in terms of minimum phase separation and even distribution of secondary phases when compared to a microscopically segregated quenched ingot and sintered pellet [see Figs. 3(a) and 3(b)].
The variation of (a) chemical composition of Ag and Sb in the matrix phase and the (b) Ag/Sb concentration ratio as a function of annealing temperatures. The horizontal line in (a) refers to the nominal composition of Ag and Sb in LAST-18 compound. (c) Volume fraction of secondary phases in the main phase against Sb content in the matrix for a given annealing condition.

From the variation in the Ag and Sb content with annealing temperatures, see Fig. 5(a), i.e., along the rod, one might expect preferential diffusion of elements from the hot to the cold side along the temperature gradient (Sorét effect, see Ref. Reference Wada, Suzuki, Sato and Kikuchi29). If this was the case, one would have recorded axial compositional gradients of Ag, Sb, Pb, and Te along the sample rod. To verify this question, balance calculations were made while considering the volume fraction of the phases as weight factors. In effect, the overall balance of the nominal composition remained unchanged as seen from Table II. This is in accordance with the decreasing volume fraction of secondary phases with increasing Sb content in the matrix, i.e., with increasing annealing temperatures, see Fig. 5(c). For this graph, Sb was considered because it is the dominant phase among all observed secondary phases in the annealed samples as can be seen in Figs. 3 and 4. A nearly perfect fit of the data in Fig. 5(c) to a linear profile suggests that the variation of chemical composition in the matrix phase originates mainly from the separation of supersaturated Ag and Sb into Ag2Te and pure Sb precipitates, respectively. The minor deviations from the original nominal composition may originate from error in the estimation of individual volume fractions of secondary phases due to the limited sampling volume available for SEM investigations relative to the bulk specimen and from the uncertainty of EDS measurements.
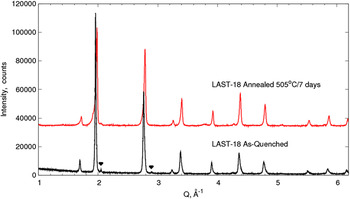
According to the powder XRD patterns of an as-quenched ingot and of a sample annealed at 505 °C for 1 week, see Fig. 6, both materials crystallize in a cubic phase with unit cell parameters 6.441 and 6.446 Å for the as-quenched and annealed samples, respectively. The larger lattice parameter of the annealed sample is attributed to the increased dissolved concentration of Ag and Sb in the matrix that distorts the cell. This is consistent with the EDS data obtained for the annealed samples. The marked intensities in the as-quenched case, see Fig. 6, were best fitted as AgSbTe2, which were in fact formerly identified as PbTe-poor secondary phase peaks elsewhere.Reference Yan, Tang, Liu, Yin and Zhang11, Reference Sootsman, Pcionek, Kong, Uher and Kanatzidis12 It should be noted that all the observed secondary phase compositions from EDS analysis (Tables I and II) cannot be identified and distinguished independently by means of XRD (Fig. 6). This is probably due to their similar crystal structures and their very low volume fraction, for which the intensities cannot be resolved. The small shoulder at 2.1 Å-1 and the bump at 3.8 Å-1 in Fig. 6 are instrumental artifacts and are not due to secondary phases.
Comparison of the powder x-ray diffraction patterns of an as-quenched sample and a sample annealed at 505 °C for 7 days.

To gain further insight into the microstructure morphology, which is necessary to develop an understanding for the variation of the thermal conductivity, TEM was performed on various samples. The bright-field image of a TEM lamella that was vertically machined out using FIB from the precipitated regions as seen from the SEM image in Fig. 4(a) is shown in Fig. 7(a). The EDS analysis identifies these regions as Ag2Te and Sb precipitates as marked in the image, with clear interface boundaries and strong material contrast. These large size precipitates possess short dimensions of 400–500 nm and long dimensions as large as 1 μm at least. In addition, a small fraction of spherical inclusions, indicated by the white arrow in Fig. 7(a), was identified as Ag2Te precipitates with a diameter of 150–250 nm. The twin-like domain structures of the Ag2Te precipitate, see Fig. 7(b), demonstrate the transformation of high temperature cubic (face-centered cubic structure) β-Ag2Te into a monoclinic α-Ag2Te at 150 °C.Reference Blachnik and Gather24, Reference Sugar and Medlin25, Reference Manolikas30 The lattice mismatch between Ag2Te and the PbTe matrix is around 2%, which suggests that these precipitates could be semicoherent.Reference Lensch-Falk, Sugar, Hekmaty and Medlin31 To accommodate this coherent strain and thereby to reduce the total strain energy of the system, the transformations takes place by forming twin-like structures as seen in Fig. 7(b). The twinning mechanism is commonly prevalent in those alloy systems where reversible phase transformations occur, the onset of which can be detected by electrical resistivity measurements.Reference Das and Karunakaran32, Reference Aliev33 This is the usual approach to determine the transformation temperatures as the resistivity of a material is very sensitive to solid–solid phase transformations. This transition should be reflected in the electrical conductivity data, as will be discussed later. Moreover, the lattice strains around these precipitates might reduce the total thermal conductivity by scattering the heat-carrying phonons. For this to happen, the size of the precipitates and the corresponding strain fields should be in the length scale range of the phonon mean free path.
(a) Bright-field image of an annealed sample at 238 °C for 7 days showing large Ag2Te and Sb precipitates as well as smaller Ag2Te precipitates as marked by the white arrow. (b) The domain structures resembling twins in an Ag2Te precipitate in the LAST matrix. (c) A bright-field image of a sample annealed at 505 °C for 1 week displaying nano Ag2Te precipitates in a scale of 20–80 nm. (d) A transmission electron microscope image of a sample that was annealed at 580 °C for 1 week showing a homogeneous matrix. The inset in (d) is a selected area electron diffraction pattern obtained after tilting the foil to the [111] zone axis confirming the cubic structure of the material. (e) A high resolution transmission electron microscopy image obtained from the sample in (d) showing nanostructural features in the matrix.

Figure 7(c) shows a TEM image of a sample that was annealed at 505 °C for 1 week. The bright-field image displays the presence of precipitates on the order of 20–80 nm. The tiny inclusions in this sample are the potential sites for phonon scattering, and thus one could expect very low thermal conductivity for this annealed sample (Fig. 9). A bright-field TEM image in Fig. 7(d) displays the general microstructure of the sample that was annealed at 580 °C for 1 week, which exhibits a homogeneous matrix without any precipitates as seen for the other annealed samples below 580 °C [Figs. 7(a) and 7(c)]. This indicates that most of the precipitates are absorbed into the matrix via dissolution treatment at higher temperatures. Nevertheless, HRTEM investigations revealed nanoscale inclusions in the sample. Figure 7(e) presents a HRTEM image that shows a rod-shaped Ag2Te precipitate surrounded by nanodots (indicated by arrows in the figure), where the former has its longer dimension on the order of 30 nm while the latter have their sizes in the range of 2–6 nm. The HRTEM investigations also revealed an even distribution of nanodots (2–6 nm), while the Ag2Te precipitates are sparsely dispersed in the matrix; thus, they were difficult to be detected by conventional TEM [cf. Fig. 7(d)].
One piece of the disc-shaped sample from the first layer in the gradient annealed ingot, at the annealing temperature of 580 °C, was separated for RUS measurements to assess the overall mechanical quality. The piece was cut into rectangular shape and properly prepared to obtain clean edges and parallel surfaces by grinding and polishing. The measurement was performed at room temperature. A good fit of 25 resonance frequencies with a root mean square (rms) deviation of 0.45% was obtained, and the quality factor, defined as the ratio between the resonance frequency and its full width at half maximum, was between 500 and 1000 indicating low acoustic attenuation and thus a low density of cracks inside the sample. The obtained values for Young’s modulus, shear modulus, and Poisson’s ratio were 59.9 (1) GPa, 23.1 (1) GPa, and 0.24, respectively, and the corresponding speed of sound of 1930 (30) m/s. These values are somewhat different from those of PbTe for which we found Young’s modulus, shear modulus, Poisson’s ratio, and speed of sound of 56.7 (1) GPa, 22.35 GPa, 0.27, and 1830 (30) m/s and in good agreement with other measurements from LAST compounds elsewhere.Reference Ren, Case, Ni, Timm, Lara-Curzio, Trejo, Lin and Kanatzidis34
C. Electronic and thermal transport properties
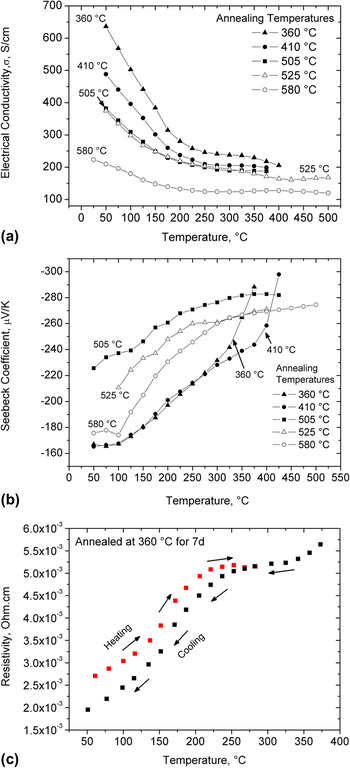
Figures 8(a) and 8(b) show the variation of electrical conductivity and Seebeck coefficient with temperatures and annealing temperature, respectively. For a given annealing condition, the decrease and increase of σ and S, respectively, with rising temperature are consistent with a degenerate semiconductor that has been reported for LAST compounds.Reference Zhou, Li and Kita3–Reference Kosuga, Uno, Kurosaki and Yamanaka9 Least squares fitting of the σ data, see Fig. 8(a), in the 25–150 °C temperature range to the standard temperature dependence ρ = 1/σ = A Tn, where ρ is electrical resistivity and A is a temperature-independent coefficient, yields n in the range of 1.55−1.87 for different annealed samples, which is consistent with a combination of acoustic and optical phonon scattering of charge carriers.Reference Allgaier and Scanlon35 To clarify the σ behavior at higher temperature, resistivity measurements for the sample annealed at 360 °C during heating and cooling cycles were carried out, see Fig. 8(c). A deviation from the initial linear behavior in the resistivity data around 150 °C during heating indicates the α → β, monoclinic to cubic, phase transition of Ag2Te,Reference Das and Karunakaran32, Reference Aliev33 which is consistent with our TEM observations, see Fig. 7(b). As expected, this transition results in a hysteresis for the resistivity measurements upon heating up and cooling down, see Fig. 8(c). Furthermore, resistivity peaks corresponding to phase transformation were also reported in the (PbTe)1-x(Ag2Te)x nanocomposites,Reference Pei, Lensch-Falk, Toberer, Medlin and Snyder36 in which resistivity peak enhancement with increasing Ag2Te mol.% and weak effects of the phase transition on the Seebeck coefficient and thermal conductivity have also been reported. The latter applies indeed also for our Seebeck measurements, see Fig. 8(b), and thermal conductivity data, see Fig. 9. For conservative estimates of ZT, the cooling data were used. The small hysteresis width according to very similar behavior during the heating and cooling cycles is due to the very low concentration of Ag2Te precipitates in the material in this study.
Temperature- and annealing temperature-dependent (a) electrical conductivity, (b) Seebeck coefficient, (c) electrical resistivity recorded during heating and cooling cycles for the sample annealed at 360 °C for 7 days, and (d) power factor. The resistivity data are shown here in (c) to highlight the phase transformation behavior in Ag2Te precipitates.

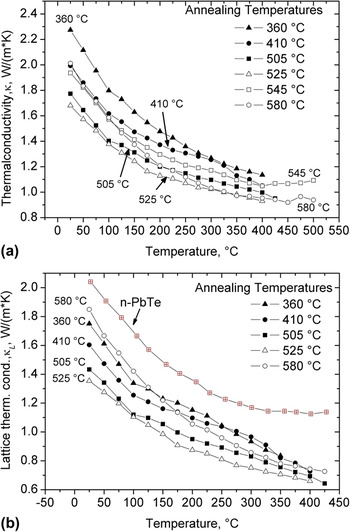
Temperature-dependent (a) total thermal conductivity and (b) lattice thermal conductivity for several annealed samples.

Figures 8(a) and 8(b) demonstrate that except for the samples that were annealed above 505 °C, the samples with higher electrical conductivity exhibit a lower Seebeck coefficient, where one would expect increase in the Seebeck coefficient with annealing temperatures as σ decrease with increasing annealing temperatures. Different annealing conditions led to the formation of several quaternary LAST compounds (see main phase compositions in Table II) via development of complex micro- and nanostructures. Consequently, one can expect different electronic structure near the Fermi level depending on the annealing conditions that govern the electronic transport properties. Thus, the discrepancy is noticed in the case of samples that were annealed above 505 °C for which low electrical conductivities in concomitant with low Seebeck coefficients were recorded. Given the nanostructuring and phase segregation in LAST compounds in the present study, they cannot be regarded as solid solutions between AgSbTe2 and PbTe but as nanocomposite systems, which has also been reported by several authors.Reference Quarez, Hsu, Pcionek, Frangis, Polychroniadis and Kanatzidis5–Reference Kanatzidis7, Reference Bilc, Mahanti and Kanatzidis14, Reference Hazama, Mizutani and Asahi15 The random dispersion of Ag+ and Sb+3 ions over large separation between them would create charge imbalances in their vicinity as they were intended to isoelectronically substitute Pb+2 sublattice in LAST compounds. Thus, Ag+ and Sb+3 ions are inclined to form Ag+–Sb+3 pairs to keep charge balance in the compound creating some ordering patterns in the lattice, which substantially affect the TE properties of the material according to theoretical calculations.Reference Bilc, Mahanti and Kanatzidis14, Reference Hazama, Mizutani and Asahi15 These microstructural arrangements of Ag–Sb are in fact extremely sensitive to the synthesis conditions changing the TE properties substantially as evident from the current results.
It may not be correct to view the Ag and Sb atoms as dopants because they are present in large stoichiometric proportions,Reference Bilc, Mahanti and Kanatzidis14 but their doping effect cannot be entirely ignored in understanding the TE properties of LAST compounds. It has been well established that the charge carrier density and semiconductor behavior (n-/p-type) depends on the position of Ag and Sb atoms in the PbTe matrix.Reference Dow, Oh, Kim, Park, Min, Lee and Wee23, Reference Strauss37 For instance, Sb substitution of Te sites in the PbTe lattice leads to p-type behavior (Sb as acceptor), whereas that on Pb sites results in n-type behavior (Sb as donor).Reference Strauss37 On the other hand, Ag substitution of Te sites in the PbTe lattice gives way to an n-type semiconductor (Ag as donor), whereas that on Pb sites brings about p-type behavior (Ag as acceptor).Reference Dow, Oh, Kim, Park, Min, Lee and Wee23, Reference Strauss37 Moreover, the carrier concentration in the LAST material (Te rich) is controlled via nonstoichiometry on the Ag, Pb, or Sb fractions in the form of Ag1-xPbm +ySb1+zTem +2,Reference Kanatzidis7, Reference Vineis, Shakouri, Majumdar and Kanatzidis8 which will derive Ag-deficient LAST compounds. The results shown in Table II and Fig. 8(a) demonstrate that higher the Ag content in the matrix, higher the electrical conductivity and is consistent with the lower Seebeck coefficients for the samples that were annealed below 505 °C. Thus, it is speculated that excess of Ag (more than its nominal composition of 2.5 at.%) in the samples that were annealed at ≤505 °C has more tendency to occupy Te sites as Te is deficient when compared to its nominal composition of 50 at.% (see Table II). This in combination with Sb as donor and the presence of n-type α-Ag2Te precipitates in the matrix would increase the electron concentration raising the electrical conductivity. This is more pronounced in the sample that was annealed at 360 °C as expected due to its high volume fraction of Ag2Te precipitates and high amount of Ag in the matrix (Table II). This mechanism ceases with increasing annealing temperatures as more and more Ag2Te and Sb-rich secondary phases dissolve into the matrix reaching its nominal composition AgPb18SbTe20. Facilitated by high diffusion rates of atoms due to high annealing temperature conditions, one would expect formation of Ag–Sb pairs adopting some long-range ordering in the lattice, which is consistent with the previous observations under longer periods of annealing.Reference Zhou, Li and Kita3 Moreover, the Ag–Sb pairs in nearest neighborhood configuration are preferred due to their lowest formation energy as predicted by theoretical calculations elsewhere.Reference Hazama, Mizutani and Asahi15 This will increase the Ag–Sb interactions that affect the electronic structure near the gap, which will in turn govern the TE properties.Reference Bilc, Mahanti and Kanatzidis14, Reference Hazama, Mizutani and Asahi15 It has been found that the contribution of Ag and Sb doping in LAST compounds to their TE properties is not a simple superposition of individual effects from Ag and Sb, but their interaction plays a major role in determining TE properties.Reference Dow, Oh, Kim, Park, Min, Lee and Wee23 The latter depends on the microstructural arrangements of Ag–Sb pairs in the lattice, which are of course a strong function of annealing conditions and cooling rates.Reference Zhou, Li and Kita3, Reference Cook, Kramer, Harringa, Han, Chung and Kanatzidis6 Therefore, more detailed studies of lattice dynamics, charge carrier density, and carrier mobility as a function of annealing temperature are required to correlate the relationships between the electronic transport properties and annealing temperature. Investigations along these lines are underway.
The temperature dependence of the power factor (S 2σ) for differently annealed samples is presented in Fig. 8(d). The maximum values of the power factors are achieved in a sample that was annealed at 505 °C, and these values decrease with temperature. Thus, one would expect maximum ZT value for this annealing case provided equivalent thermal conductivities.
The consistency between the raise in the Seebeck coefficients with decreasing σ beyond 325 and 390 °C in the case of samples annealed at 360 and 410 °C, respectively, is an indication of microstructural instability of the material, see Figs. 8(a) and 8(b), that results in a change of the TE properties over time. Nevertheless, the material that was annealed above 450 °C for 1 week did not exhibit any significant degradation under thermal cycling during TE property measurements. These experiments have provided the feedback that annealing temperatures between 450 and 550 °C bring about a thermodynamically rather stable material. A stable microstructure is paramount for the successful industrial incorporation of LAST compounds and their devices have been under the development for operation in the intermediate temperature range of 400–500 °C.
The temperature dependence of the thermal conductivity, κ, for a given annealing condition is shown in Fig. 9, where κ falls as the operating temperature rises. Moreover, the conductivity decreases with increasing annealing temperatures from 360 to 525 °C and reaches as low as between 1.7 and 0.8 W/mK in the 25–400 °C temperature range for the sample annealed at 525 °C. Although the κ curve for the 580 °C annealed sample displays higher thermal conductivity below 200 °C, the sample exhibits low thermal conductivities comparable to those observed for the 505 °C annealing case at elevated temperatures (>200 °C) as seen from Fig. 9(a). These variations in thermal conductivities are attributed to the size and distribution of nanoparticles in different annealed samples (Fig. 7). To relate the nature of nanostructures/microstructures with thermal conductivity values, the lattice thermal conductivity data are shown in Fig. 9(b) for several annealed samples in comparison with that of PbTe. The lattice part of thermal conductivity can be evaluated from the equation, κ l = κ − κ e, where κ l is the lattice thermal conductivity, κ is the measured total thermal conductivity, and κ e is the electronic contribution to κ. The κ e is usually calculated by using Wiedemann–Franz law, κ e = σL 0T, where σ is the electrical conductivity, T is the absolute temperature, and L 0 is the Lorentz number whose value is dependent on the scattering mechanism, the concentration of electrons and holes, and so on.Reference Pei, Lensch-Falk, Toberer, Medlin and Snyder36 In the present case L 0 = 2.45 × 10⁻⁸ V2/K2 is applied for the estimation of κ e. It can be readily seen that the lattice thermal conductivities of the samples that were annealed at 505 and 580 °C are 66 and 90% that of PbTe at room temperature, whereas they are of 58 and 65% that of PbTe at 400 °C, respectively. It has been a common perception that a smaller particle size (<20 nm) and a more uniform distribution thereof leads to a more efficient scattering of phonons and a significant reduction of the thermal conductivity. This is because of the traditional room temperature estimate of the phonon mean free path of only 3 nm in bulk PbTe.Reference Rowe38 Nevertheless, a more detailed analysisReference Rowe38 shows that at room temperature, 10, 50, and 90% of the heat in bulk PbTe is transported by the phonons having mean free paths up to 6, 42, and 860 nm, respectively. These cut off mean free paths decrease with increasing the temperature in bulk PbTe: for example, at 400 °C, 10 and 50% of the heat is carried by the phonons with mean free paths up to 3 and 25 nm only, respectively.Reference Rowe38 Indeed, a 40% reduction in κ l is expected in the entire measured temperature range for the 505 °C annealed sample having particles size in 20–80 nm range as seen from Figs. 7(c) and 9(b). The same is valid in the sample annealed at 580 °C for which only a 10% drop in the κ l at room temperature is recorded because of nanoparticles of size 6–10 nm [Fig. 7(e)]. But at 400 °C, a 35% reduction in the κ l can be linked to reduced mean free paths of phonons that carry most of the heat as analyzed for bulk PbTe in Ref.Reference Rowe38. The experimental results clearly demonstrate that the lattice thermal conductivity can be effectively reduced in the LAST compounds by adjusting a well-controlled precipitate distribution with precipitate size in the wide nanometer range.
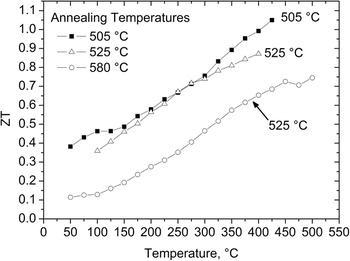
The TE figure of merit, ZT, for these annealed samples is shown in Fig. 10. The maximum ZT value of about 1.05 is achieved at 425 °C for the samples annealed at 505 °C for 1 week. This peak ZT temperature is below the annealing temperature of 505 °C such that the nanoparticle phase is thermodynamically stable and will not dissolve in the matrix. Nanoparticles formed from long-term annealing at high temperatures are likely to be more stable at elevated operating temperatures than those precipitated at lower temperatures. This can be inferred from Fig. 8(b) for the low-temperature (below 450 °C) annealed samples. The high ZT for the 505 °C annealed material is mainly due to its larger Seebeck coefficient, see Fig. 8(b), and low thermal conductivity, see Fig. 9(a). It may be possible to obtain larger electrical and lower thermal conductivity by altering the chemical composition through varying the Ag/Sb ratio and the processing. Currently, our goal is to establish a more comprehensive map of the correlations in the parameter field of annealing temperature–microstructure–ZT. This information along with the thermal stability of material and nanoparticle phases are paramount for the development of efficient LAST compounds and their use in TE generators.
Dimensionless thermoelectric figure of merit (ZT) as function of annealing temperatures.

IV. CONCLUSIONS
In the present study, LAST-18 (AgPb18SbTe20) compounds were prepared by means of a conventional melting method using a rocking furnace. To study the influence of the annealing temperature and thereby to obtain a large ZT, a gradient annealing method was used. The results reveal that microstructural development and the consequent change in chemical composition of LAST-18 matrix phase is the determining factor in the evolution of the TE characteristics in AgPb18SbTe20 alloys. The main findings of the present work can be summarized as follows:
1. The adopted long-term annealing in a temperature gradient between 200 and 600 °C results in the formation of Sb precipitates on micrometer length scales with at least 1-μm-long and 500-nm-short dimensions, whereas Ag2Te precipitates were formed in both the nanoscale, from 30 to 250 nm, and microscale at least 1 μm in length. This precipitation formation has changed the chemical composition of the remaining main phase of LAST-18 compounds in dependence on the volume fraction of the secondary phases. The volume fraction of the secondary phases decreases with increasing annealing temperature due to the increased dissolution of Sb and Ag2Te in the matrix.
2. The limited solubility of Sb in LAST compound is the likely driving force for the phase separation. In-depth microscopy did not reveal any formation of AgSbTe2 precipitates in the matrix. Stable Ag2Te nanoparticles formed/precipitated during long-time annealing at elevated temperatures are responsible for the remarkable reduction in the thermal conductivity for all annealing conditions.
3. Phases formed at annealing temperatures below 450 °C are relatively unstable when heated above annealing temperature, as seen by the sharp rise in the electrical properties, both the Seebeck coefficient and the electrical conductivity, when the operating temperatures exceeds the annealing temperatures.
4. The large Seebeck coefficient and low thermal conductivity values are responsible for a large ZT of 1.05 at 425 °C for the material annealed at 505 °C.
5. For the present material system, annealing temperatures in the range of 450–550 °C are found to be appropriate to achieve rather stable microstructures. The approach of annealing in a temperature gradient to find the optimum annealing temperatures should be broadly applicable to other TE material systems.
ACKNOWLEDGMENTS
The authors thank the Federal Ministry for Education and Research (BMBF), Germany “Werkstofftechnologien von morgen—Wissenschaftliche Vorprojekte in Werkstoff—und Nanotechnologien,” for funding this research study (03X3540A). Raphael Hermann acknowledges the Helmholtz-Gemeinschaft Deutscher Forschungszentren for funding of the Young Investigator Group “Lattice dynamics in emerging functional materials.” The authors also thank Dr. Peter Werner for his valuable contribution in HRTEM investigations performed at Max Planck Institute, Halle, Germany.