


Introduction
Microcracks are recognized as playing an important role in the deformation of polycrystalline ice over a large range of conditions. Surprisingly, the literature provides few experimental results on crack nucleation, and the physical processes for the formation of cracks are still poorly understood.
It is of general agreement that mode 1 is the main opening mode of microcracks, even under compression: this is supported by the preferential orientation of microcracks about the most compressive stress axis (Cole, Reference Cole1986; Kalifa and others, Reference Kalifa, Ricard., Sinha, Sodhi and Chung1989). The controversy resides in the physical mechanism for local stress concentration, required to break atomic bonds and create the free surfaces of the microcracks. Models for brittle materials like rocks usually assume that crack initiation is due to local tensile stress fields at the vicinity of pre-existing holes or impurities (Costin, Reference Costin1985; Kemeny and Cook, Reference Kemeny and Cook1987). Since undeformed ice does not contain such defects, other mechanisms must be considered.
At low strain rates (or low stresses), crack initiation was understood in terms of either dislocation pile-up (Gold, Reference Gold1972; Cole, Reference Cole1986; Schulson, Reference Schulson1987; Kalifa and others, Reference Kalifa, Ricard., Sinha, Sodhi and Chung1989) or grain boundary sliding (Sinha, Reference Sinha1984). Although authors disagreed on the physical origin of visco-elasticity, they showed that it plays an essential role in the nucleation process. However, these mechanisms are time-dependent and may not be predominant at high strain rates. Cole (Reference Cole1988) calculated that dislocation pile-up is too slow to be a relevant mechanism when the amount of time for crack initiation is typically smaller than 20 s. However, he based his calculations on dislocation velocity measurements done by Fukuda and Higashi (Reference Fukuda and Higashi.1973) at very low stresses (of the order of 0.1 MPa), and extrapolated linearly to higher stresses. The behaviour of dislocations at high stresses (typically 2–3 MPa) is poorly known, and this assumption has no experimental support yet. Cole (Reference Cole1987) and Kalifa and others (Reference Kalifa, Ricard., Sinha, Sodhi and Chung1989) observed that an increase in strain rate (typically between 5 × 10⁻⁵ s−1 and 10−3s−1) resulted in a change in crack location, from equally distributed at grain boundaries and within the grains, to mostly at grain boundaries.
In conditions where ice exhibits an essentially brittle behaviour, models are based on the hypothesis that the elastic anistropy of the ice lattice is at the origin of the stress concentrations required for crack nucleation. Cole (Reference Cole1988) proposed a simple model by assuming that the surface energy of the crack was provided by the gradient of elastic energy between adjacent grains. This model predicts that the nucleation stress increases with decreasing grain-size. However, it does not account for the difference in nucleation stress between tension and compression, and does not address the effect of temperature on the critical stress.
Recently, Sunder and Wu (Reference Sunder and Wu1990) used the Eshelby procedure (Eshelby, Reference Eshelby1957) to give a detailed analysis of the internal stress fields due to the mismatch in the elastic properties of the grains. They assumed that the formation of a microcrack is controlled by the growth of a precursor (or crack nucleus) under the action of combined local and remote stress fields. They made the assumption that the precursors are generated at triple points or at grain boundary ledges, due to stress singularities. The precursor growth criterion is similar to the one of Ashby and Hallam (Reference Ashby and Hallam1986); growth occurs when the local mode 1 stress intensity factor, at the tip of the precursor, reaches a critical value K1c related to the solid-vapour surface energy of the ice. The difference in initiation stress between tension and compression is accounted for by assuming that a Coulomb friction exists between the faces of the precursor.
The present work focuses on the physical mechanisms that control the formation of microcracks in polycrystal-line ice, close to the ductile-brittle transition. Uniaxial compression tests were performed on fresh-water, isotropic granular ice, at a constant strain rate of about 6 × 10⁻⁴ s−1. We investigated the effect of temperature and grain-size on the critical stress and strain for crack nucleation. Video monitoring of the tests enabled a careful investigation of crack nucleation. Direct measurements of strain on the specimens, associated with the study of both loading and unloading, allowed us to estimate the amount of anelastic strain involved in the nucleation process.
Experimental Procedure
The specimens
Tests were performed on polycrystalline, isotropic, equiaxed ice, made at the laboratory. We used a procedure similar to the one described in Stone and others (Reference Stone, Jordaan, McKenna, Axelsson and Fransson1989). Four specimens were taken from every fabricated ice block. The grain-size of the blocks was controlled by the size of the grids used in the sieving process. Each set of sieves defined a grain-size group, within which the average specimen grain-size slightly fluctuated. The grain-size (dg) was estimated on two thin sections at the extremities of every specimen. Between 80 and 200 grains (generally around 120) were counted on each section. dg was calculated using the formula (Dieter, Reference Dieter1976)

where NA is the number of grains per unit area.
Each specimen was manufactured on a milling machine in order to obtain cuboids of dimensions 60 × 60 × 120 mm3. The specimens were then stored in the testing room for about 15 h to equilibrate in temperature.
Apparatus and measurements
Tests were performed with a 1 MN testing frame equipped with a servo-controlled hydraulic actuator. The end-caps were flat polished stainless steel platens. The bottom one was provided with a cooling system in order to prevent heat transfer from the oil in the actuator. The top end-cap was able to swivel in case of a small non-parallelism of the specimen extremities.
The axial load F was measured by a strain gauge load cell placed between the frame and the upper end-cap. The axial stress σ was approximated by the ratio σ = F/A, where A is the nominal cross-section area.
The axial strain was measured directly on the central part of the specimens, using LVDTs. The grips holding, respectively, the body and the core of the transducer, were fixed into the ice by a very slight melting-freezing process. The part of the grip in contact with ice consisted of a 15 mm wide and 0.5 mm thick blade, and penetrated about 1 mm into the specimen. During installation of the transducers, a plate holding the grips together ensured parallelism and consistent spacing h. The latter was h = 60 mm, each grip being 30 mm away from the closest end of the specimen. The axial strain, ॉ, was approximated to ॉ = d/h, where d is the relative displacement of the grips.
Analogue outputs of the tranducers were recorded on a strip chart recorder and stored as digitized data. Signals were sampled at 200 Hz during the first 15 s (including loading and unloading of the specimen) and at 20 Hz for the next 300 s.
Video monitoring
Video monitoring and recording of the specimens during the tests were done with a regular speed (30 frames−1) high resolution video camera. Microcracks were rendered visible by the reflection of a light source on their faces. Two halogen lamps facing each other were placed at 90° from the camera. Such a set-up allowed the observation of cracks with any orientation. Synchronization of the video recording was achieved by digitizing the video signal along with other outputs. Prior to the test, the camera was blinded with a black panel. The fast removal of the panel resulted in an abrupt change in the video signal; as well, it was easily determined on the video monitor as it occurred between two frames. This procedure, associated with a frame-by-frame play-back of the recording, allowed us to correlate visible events to mechanical measurements with an accuracy of 1/30s.
The central event of this work is the formation of the first crack (called “crack initiation” in this paper). In order to avoid any interface effects, we considered only the cracks nucleated in the 60 mm central part of the specimen.
Testing procedure
Two series of tests were carried out at the same strain rate. In the first one, the effect of temperature was investigated on specimens with a grain-size of about 4.5 mm (group 4). Temperature was varied between −2°C and −39°C, with an accuracy of 0.5°C. In the second one, grain-size effect was studied at −10°C on six groups of specimens, covering the range 1 mm −8 mm. Four tests were performed for each sample condition of temperature and grain-size.
In order to ensure a better ice/end-cap interface, specimens were subjected to a small pre-load (typically 0.3 MPa at −2°C, 0.7 MPa at −39°C) for 10 min, followed by a relaxation period of 30 min or more. After this period, the LVDTs no longer exhibited a change and the amount of permanent deformation was negligible.
Tests were stopped shortly after the nucleation of the first cracks (at an axial stress of 4 MPa at −10°C, 7 MPa at −39°C). Depending on the experiment, between 5 and 50 cracks were nucleated (no detailed analysis was done). At this point, the piston moved back to its initial position at a very high velocity. As a result, the load was relaxed in about 0.03 s. The elastic modulus Ε was then calculated according to
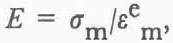
where σm is the maximum stress applied to the specimen and ε e m is the instantaneous relaxation strain measured by the LVDTs. Since very few microcracks were nucleated, the measured elastic modulus can be considered as the one for virgin ice. This approximation is supported by recent work which showed that a fairly high density of microcracks is necessary to alter the elastic modulus of ice (Stone and others, Reference Stone, Jordaan, McKenna, Axelsson and Fransson1989; Kalifa and others, Reference Kalifa, Ricard., Sinha, Sodhi and Chung1989). The elastic strain at the first crack was then merely deduced from the critical stress at this event (σi)
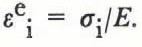
This calculation procedure was applied independently on both LVDTs, and on most specimens.
Results and Analysis
General comments
Experimental conditions and results are summarized in Tables 1 and 2. Tests are gathered by temperature and grain-size groups. The letter in the specimen number refers to the block from which the specimen was taken. The two values given in the grain-size column correspond to the two thin sections made for each specimen. The results involving strain measurements (that is strain rate, critical strain at the first crack, and Young’s modulus) are given for both LVDTs. Also, two values appear in the columns for stress and strain: they are associated with the two video frames between which the event occurred. Note that the uncertainty is ≈ 0.15 MPa in stress, and ≈ 2 × 10⁻⁵ in strain. This gives an inherent accuracy of better than 10% in both cases.
Although a constant strain rate was exhibited during the loading, it varied slightly from test to test. However, the LVDTs did not measure exactly the same strain rate on each side of the specimens, showing a slightly uneven deformation. The difference in measurements was generally very small. The overall average strain rate is (6.0 ± 0.9) × 10−4 s1.
The duration of the loading part of the tests was of the order of 1.5 s, and the first cracks formed after about 0.7−1.0 s. The Young’s modulus also exhibited small variations from test to test, as well as between transducers. The average value of Young’s modulus for all tests is Ε = 8.9 ± 1.1 GPa. This is close to the theoretical value of 9.5 GPa and demonstrates the good quality of the ice.
Results for specimens tested at different temperatures and constant grain-size (dg ≈ 4.5mm)

Since the non-recoverable strain at unloading was not measurable, the strain at initial crack nucleation was expressed as
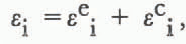
where the complementary component, εc i, is essentially the delayed elastic component.
Structural observations
The frame-by-frame play-back of the video recordings is a very powerful tool for determining the time of the nucleation of the first crack and for studying the evolution of the cracks, once nucleated. Two noteworthy observations were made:
• A nucleated crack appeared first as a slightly lighter area, which kept enlarging and brightening for 2 to 4 frames. It seemed, therefore, that the crack kept growing and/or opening during this 0.07–0.14 s time period, corresponding to a stress increment of 0.3 to 0.5 MPa.
• When applied stress was released, a large proportion of cracks closed within 2 or 3 frames (0.07–0.1 s). The closure process of the remaining cracks was slower. However, less than 10% of all cracks were visible after 5 min. This phenomenon occurred in all specimens, in spite of the fact that the maximum stress was up to 1.7 times the initiation stress. Although no systematic study was done, it appeared that the first cracks to close were not necessarily the last to nucleate. Another important parameter is certainly the orientation of cracks with respect to the compression axis: axial cracks are more stable than angled cracks. This assertion was difficult to confirm on the video records, due to the size of the cracks. However, it was supported by the observation of thin sections from specimens that underwent a higher load (about 60% of the peak stress): a smaller proportion of cracks closed at unloading, and axial cracks were more open (blacker) than angled cracks.
These observations demonstrate that the application of a stress much higher than the initiation stress is required for cracks to stay open at unloading. As a result, cracks may not act as an efficient factor to modify the local stress fields, and, hence, the bulk mechanical properties of the specimen, until the stress reaches this level. This stage is probably reached close to the peak (or failure) stress. This behaviour is consistent with observations made by Cole (1990). At a strain rate of 10−3s−1, he observed that the stress for failure was significantly higher than the one corresponding to the end of cracking activity.
Results for specimens tested at −10± 0.5°C, and various grain-sizes. Results for size group number 4 are presented in Table 1

Initiation stress versus temperature, for a grain of about 4.5 mm (size group number 4). The points and the error bars are, respectively, the average and the standard deviation of the 4 tests carried out at every temperature.

Temperature effect
On 1 and 3, the data points represent the average of the four tests carried out at each temperature. The error bars correspond to the standard deviation across the four tests, and include the error inherent in the method of observation.
On Figure 1 the initiation stress, σi, is plotted as a function of temperature. Tests exhibited a very good repeatability: the standard deviation varied between 0.18 and 0.31 MPa. The striking feature of this figure is the very important increase in the initiation stress with decreasing temperature. On average, σi increases from 1.67 MPa at −2°C to 6.10 MPa at −39°C. Unfortunately, the effect of temperature has not been investigated previously in this strain-rate range in uniaxial tension. The only previous investigation was performed at a strain rate of 10−6 s−1, more than two orders of magnitude smaller than that studied here (Schulson and others, Reference Schulson, Lim and Lee1984). Schulson and others observed that for a grain-size of 4.5 mm, σi ≈ 1.2 MPa and did not change with temperature between −5°C and −20°C.
The temperature dependence of σi can be described with an Arrhenius law

where T is the absolute temperature, R is the gas constant and σ0 is a constant. On Figure 2, log(σ) is plotted as a function of 1/T. The slope of the linear regression through the data points gives an apparent activation energy Q ≈19 k J mol−1.
Initiation stress versus the inverse of temperature on a linear-log scale. Each data point represents the average of 4 tests, and the line is a linear regression through the points.

On Figure 3, the initiation strain ॉi is plotted versus temperature. Although strain data present more scatter than stress data, they exhibit essentially the same temperature dependence. On average, ॉi increases from 2.3 × 10⁻⁴ at −2°C to 6.8 × 10⁻⁴ at −39°C. The linear elastic component, εe i, is reported in Tables 1 and 2; it forms the major part of the total strain (between 75% and 95%), whereas the complementary component, εc i, reaches an average level of the order of 5 × 10⁻⁵ (Table 3). However, there are large standard deviations associated with εc i both from test to test and between LVDTs. A small inaccuracy in the Young’s modulus measurement, due to either uneven loading or the method of strain measurement, leads to a large inaccuracy in εc i. Thus, it is not surprising that εc i exhibits a large scatter between LVDTs. No temperature effect on εc i is observed.
Grain-size effect
The initiation stress, σi is plotted versus d g −1/2 Figure 4.
Fig..3. Initiation strain versus temperature for a grain of about 4.5mm (size group number 4). The points and the error bars are, respectively, the average and the standard deviation of the 4 tests carried out at every temperature.

Initiation stress versus grain size, at Τ = −10°C. Also drawn is a linear regression through the data points and a theoretical curve derived from the model of Sunder and Wu (Reference Sunder and Wu1990).

Estimated non-elastic (or complementary) strain at the first crack, εc i, as a function of temperature.

The coordinates of each data point are the average of the two values given in Table 2, for σi and dg , respectively. Superimposed is a linear regression through the data points (solid line), as well as a theoretical curve which will be discussed later. In spite of the scatter in the data points, the initiation stress exhibits a linear increase with d g −1/2 on average, σi decreases from 3.7 to 2 MPa as dg increases from 1 mm to 8 mm.
These values are similar to the value of 2.5 MPa obtained by Kalifa and others (Reference Kalifa, Ricard., Sinha, Sodhi and Chung1989) under the same conditions. However, they are significantly smaller than the critical stress of 3.5 MPa obtained by Cole (1990) at 10−3 s−1 on the same type of ice. The same trends are observed for the grain-size dependency of the initiation strain. Again, the major part of the strain is linear elastic (between 79 and 91% of ॉi), and εc i reaches an average value of the order of 5 × 10⁻⁵ (Table 4). The large standard deviations do not allow us to distinguish any grain-size effect on εc i.
Estimated non-elastic (or complementary) strain at the first crack, εc i, as a function of grain-size. Result for size group number 4 appears in Table 3.

Discussion
The most striking result of our experiments is the very strong increase in the initiation stress with decreasing temperature. Temperature may affect the nucleation criterion and/or the physical mechanism necessary to achieve it. The nucleation criterion can be expressed as the fracture toughness, K1c , related to the vapour-solid surface energy of the ice (Lawn and Wilshaw, Reference Lawn and Wilshaw1975). Surface energy measurements seem to show that it is independent of temperature (Hobbs, Reference Hobbs1974). This is supported by uniaxial tension tests at 10−6 s−1, mentioned previously (Schulson and others, Reference Schulson, Lim and Lee1984), which showed that temperature had no effect on σi between −5 and −20°C. Therefore, the temperature dependency of the initiation stress would seem to be due to the physical mechanism necessary to reach the criterion.
Following Sunder and Wu (Reference Sunder and Wu1990), the effect of temperature on σi is addressed by introducing Coulomb friction between the faces of the precursor. The only investigation in ice—ice friction available in the literature was performed recently by Jones (Reference Cole, Jones, McKenna, Tillotson and Jordaan1989) and partly reported by Schulson (1990). It was shown that the temperature dependency of the dynamic friction coefficient, μ, was a function of sliding velocity. In our experiments , it is difficult to determine the relationship between the bulk strain rate and the sliding velocity ( V) of the precursor faces. In a first step, we assume that V = ε̇ × 2a where 2a is the length of the precursor. Taking 2a/dg = 0.1(Sunder and Wu, Reference Sunder and Wu1990), with ε̇ = 6 × 10⁻⁴s−1 and = 4.5 mm, we obtain V = 2.7 × 10⁻⁷m s−1. This value is probably a lower bound and the actual velocity may be much higher. In this range, Jones (Reference Cole, Jones, McKenna, Tillotson and Jordaan1989) showed that μ is essentially independent of temperature. Furthermore, he estimated that the largest variation in μ achieved at a velocity of 10−4 m s−1, was only between 0.25 and 0.77 when the temperature decreased from −3°C to −40°C. On the other hand, Sunder and Wu predicted that, for 2a/dg = 0.1 and dg = 4.5 mm, an increase in σi from 2 MPa to 3 MPa required a variation in the coefficient of friction between the faces of the precursor from 0.2 to 1.0. One may argue that the physical conditions in the friction tests are not the same as in our crack nucleation tests: for example, different sizes of the surfaces in contact, surfaces exposed to atmosphere as opposed to vacuum or water vapour. Despite these differences, it is clear that the strong temperature dependency of the initiation stress (between 1.67 MPa at −2°C and 6.1 MPa at −39°C) would require a much larger change in friction coefficient than has been observed. Another discrepancy appears on Figure 4, showing the effect of grain-size on σi: the slope of the theoretical curve derived from Sunder and Wu, for μ 0.6 and 2a/dg = 0.1, is larger than that obtained from the linear regression through the data points.
Therefore, in the conditions studied, it is clear that crack nucleation is not controlled by the growth of a precursor. However, the generation of the precursor itself may be the controlling mechanism. It would then be more suitable to call it a “crack nucleus”. It is probable that when the local criterion for the formation of the crack nucleus is achieved, the latter grows catastrophically into a microcrack of visible size, using the energy available in the neighbouring grains.
The physical mechanisms at the origin of the stress concentration for the formation of the crack nucleus are now to be addressed. The level of the complementary strain seems too low for trans-granular dislocation pile-up to be considered as an efficient stress concentrator. However, as pointed out by Raj and Ashby (Reference Raj and Ashby1971), a very small grain boundary sliding (corresponding, for polycrystalline ice, to a delayed elastic strain typically less than 10−4) is required to build up stresses at grain boundary ledges or triple points. It is clear that the elastic anisotropy of the ice lattice generates high stresses on the grain boundaries, which enable them to slide. However, this sliding is controlled by the mechanical properties of the boundaries themselves. The latter may be characterized by a viscosity or an internal friction, which would increase with decreasing temperature. Such an hypothesis needs to be supported by more experiments concerning, in particular, the structure of the grain boundaries. However, it seems to be a reasonable explanation for the large increase in the nucleation stress with decreasing temperature. Consistent with this, the initiation stress in uniaxial tension should also increase with decreasing temperature.
At temperatures above −10°C, pressure melting may occur at the grain boundary ledges or triple points (Hobbs, Reference Hobbs1974), and must be considered as a possible stress relieving mechanism.
Conclusions
Uniaxial compression tests were carried out on isotropic granular ice, at a strain rate of about 6 × 10⁻⁴s−1. We investigated the effect of temperature and grain-size on the critical stress and strain at the formation of the first crack and estimated the elastic and non-elastic components of strain at this event. Video monitoring of the specimens during the tests allowed us to study the behaviour of the microcracks during both loading and unloading. It appeared that many microcracks closed soon after unloading, although the maximum stress undergone by the specimens was up to 1.7 times the initiation stress.
The initiation stress exhibited a strong increase with decreasing temperature. Furthermore, the initiation stress appeared to increase linearly with d g −1/2, where d>g is the average grain-size of the specimens. Moreover, it was shown that the major part of the initiation strain was linear elastic, and that the delayed elastic component reached about 5 × 10⁻⁵, with a large scatter.
It was demonstrated that these results cannot be explained by a purely brittle model based only on the elastic anistropy of the ice lattice, and that non-elastic mechanisms must be considered. It is proposed that, in the conditions studied, crack nucleation is controlled by the formation of a crack nucleus, which grows into a visible microcrack. The formation of the crack nucleus at triple points or grain boundary ledges is probably driven by the high local stresses due to the elastic anisotropy of the ice lattice. However, it may be controlled by the internal friction of the grain boundaries themselves.
Acknowledgements
We thank B.L. Parsons and F.M. Williams for helpful comments.



