1. Introduction
In population genetics, the allele frequency spectrum (AFS) records the numbers of types of alleles represented a designated number of times in a sample of genes. Its distribution was derived under an infinite alleles model of mutation by Ewens [Reference Ewens10]. An intimate connection of this distribution, now known as the Ewens sampling formula (ESF), with Kingman’s Poisson–Dirichlet distribution [Reference Kingman31], was subsequently exploited in a large range of important applications. The AFS plays an important role for example in the formulation of Kingman’s coalescent [Reference Kingman32]; for background, see Berestycki et al. [Reference Berestycki, Berestycki and Schweinsberg4] and Basdevant and Goldschmidt [Reference Basdevant and Goldschmidt3].
Kingman [Reference Kingman31] constructed the Poisson–Dirichlet distribution
 $\mathrm{\mathbf{PD}}(\theta)$
, for
 $\theta>0$
, as a random distribution on the infinite unit simplex
 $\nabla_{\infty}\,:\!=\, \{x_i\ge 0, i=1,2,\ldots, \sum_{i\ge 1}x_i=1\}$
, by ranking and renormalising the jumps of a driftless gamma subordinator up to a specified time. Another of Kingman’s distributions arises when a driftless
 $\alpha$
-stable subordinator with parameter
 $\alpha\in(0,1)$
is used instead of the gamma subordinator. Later again, an encompassing two-parameter Poisson–Dirichlet distribution
 $\mathrm{\mathbf{PD}} (\alpha, \theta)$
was constructed by Pitman and Yor [Reference Pitman and Yor43]. This specialises to
 $\mathrm{\mathbf{PD}} (\theta)$
when
 $\alpha\downarrow 0$
and to the second of Kingman’s examples, denoted herein as
 $\mathrm{\mathbf{PD}} (\alpha,0)$
, when
 $\theta=0$
.
These distributions and the methodologies associated with them have subsequently had a huge impact in many applications areas, especially in population genetics, but also in the excursion theory of stochastic processes, the theory of random partitions, random graphs and networks, probabilistic number theory, machine learning, Bayesian statistics, and others. They have also given rise to a number of generalisations and a large literature analysing the various versions. Among these, generalising
 $\mathrm{\mathbf{PD}} (\alpha,0)$
, is the
 $\mathrm{\mathbf{PD}} _\alpha^{(r)}$
class of Ipsen and Maller [Reference Ipsen and Maller23], defined for
 $\alpha\in(0,1)$
and
 $r>0$
.
In this paper we derive large-sample (
 $n\to\infty$
) and other limiting distributions of the AFS, joint with the number of alleles, for each of these classes. The AFS in a sample of size
 $n\in \Bbb{N}\,:\!=\, \{1,2,\ldots\}$
is the vector
 $\mathbf{M}_n= (M_{1n}, M_{2n}, \ldots, M_{nn})$
, where
 $M_{jn}$
is the number of allele types represented j times, and
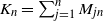 $K_n =\sum_{j=1}^n M_{jn}$
is the total number of alleles in the sample. (Vectors and matrices are denoted in boldface, with a superscript ‘
 $\top$
’ for transpose.)
 $K_n$
is a deterministic function of
 $\mathbf{M}_n$
, but analysing
 $\mathbf{M}_n$
and
 $K_n$
jointly, as we do, leads to important new insights and useful practical results.
2. Notation, models analysed, and overview
Here we set out some notation to be used throughout. Recall that the sample size is
 $n\in \Bbb{N}$
. The sample AFS is the vector
 $\mathbf{M}_n$
with its dependence on parameters
 $\alpha$
,
 $\theta$
, or r specified as required, with components
 $(M_{1n}, M_{2n}, \ldots, M_{nn})$
indicated correspondingly. Each
 $\mathbf{M}_n$
takes values in the set
 \begin{equation}A_{kn}\,:\!=\, \Biggl\{\mathbf{m}= (m_1,\ldots,m_n)\colon m_j\ge 0, \, \sum_{j=1}^njm_j=n,\, \sum_{j=1}^nm_j=k\Biggr\},\end{equation}
and each
 $K_n$
takes values
 $k\in \Bbb{N}_n\,:\!=\, \{1,2,\ldots,n\}$
,
 $n\in\Bbb{N}$
.
Specialising our general notation, when the model under consideration depends on parameters
 $\alpha$
,
 $\theta$
, or r, these are distinguished in the particular
 $\mathbf{M}_n$
and
 $K_n$
analysed; thus, for
 $\mathrm{\mathbf{PD}} (\alpha,\theta)$
we have
 $(\mathbf{M}_n(\alpha,\theta),K_n(\alpha,\theta))$
(with
 $(\mathbf{M}_n(\alpha,0),K_n(\alpha,0))$
abbreviated to
 $(\mathbf{M}_n(\alpha),K_n(\alpha))$
, for
 $\mathrm{\mathbf{PD}} (\theta)$
we have
 $(\mathbf{M}_n(\theta),K_n(\theta))$
, and similarly for
 $\mathrm{\mathbf{PD}} _\alpha^{(r)}$
. Explicit formulae for the distributions of
 $(\mathbf{M}_n, K_n)$
are available for each of these models, as we now set out in detail.
Distribution of
 $(\mathbf{M}_n(\alpha,\theta),\, K_n(\alpha,\theta))$
for
 $\mathrm{\mathbf{PD}} (\alpha,\theta)$
. Pitman’s sampling formula ([Reference Pitman40, Prop. 9], [Reference Pitman and Yor43, Sect. A.2, p. 896]) gives, for
 $\theta>0$
,
 $0<\alpha<1$
,
 \begin{align}&\mathbf{P}(\mathbf{M}_n(\alpha, \theta)=\mathbf{m},\, K_n(\alpha, \theta)=k)\notag \\ &\quad = \dfrac{n!}{\alpha}\dfrac{\Gamma(\theta/\alpha+k)}{\Gamma(\theta/\alpha+1)}\dfrac{\Gamma(\theta+1)}{\Gamma(n+\theta)}\biggl(\dfrac{\alpha}{\Gamma(1-\alpha)}\biggr)^k\times\prod_{j=1}^n\dfrac{1}{m_j!}\biggl(\dfrac{\Gamma(j-\alpha)}{j!}\biggr)^{m_j}.\end{align}
The corresponding formula for
 $\mathrm{\mathbf{PD}} (\alpha,0)$
is given just by setting
 $\theta=0$
:
 \begin{equation}\mathbf{P}(\mathbf{M}_n(\alpha)=\mathbf{m},\, K_n(\alpha)=k)= \dfrac{n(k-1)!}{\alpha}\biggl(\dfrac{\alpha}{\Gamma(1-\alpha)}\biggr)^k\times\prod_{j=1}^n\dfrac{1}{m_j!}\biggl(\dfrac{\Gamma(j-\alpha)}{j!}\biggr)^{m_j}.\end{equation}
Distribution of
 $(\mathbf{M}_n(\theta),\, K_n(\theta))$
for
 $\mathrm{\mathbf{PD}} (\theta)$
. The Ewens sampling formula ([Reference Ewens10], [Reference Pitman42, p. 46]), for
 $\theta>0$
, is
 \begin{equation}\mathbf{P}(\mathbf{M}_n(\theta)=\mathbf{m},\, K_n(\theta)=k)= \dfrac{n!\Gamma(\theta)\theta^k}{\Gamma(n+\theta)}\prod_{j=1}^n\dfrac{1}{m_j!}\biggl(\dfrac{1}{j}\biggr)^{m_j}.\end{equation}
Distribution of
 $(\mathbf{M}_n(\alpha,r),\, K_n(\alpha,r))$
for
 $\mathrm{\mathbf{PD}} _\alpha^{(r)}$
. Equation (2.1) of [Reference Ipsen, Maller and Shemehsavar26] gives the following formula: for
 $r>0$
,
 $0<\alpha<1$
,
 \begin{equation}\mathbf{P}(\mathbf{M}_n(\alpha,r)=\mathbf{m},\, K_n(\alpha,r)=k)= n\int_{0}^{\infty}\dfrac{\Gamma(r+k)\lambda^{\alpha k}}{\Gamma(r)\Psi(\lambda)^{r+k}}\prod_{j=1}^n \dfrac{1}{m_j!}(F_j(\lambda))^{m_j}\dfrac{\mathrm{d} \lambda}{ \lambda},\end{equation}
where
 \begin{equation}\Psi(\lambda)=1+\alpha \int_{0}^1(1-{\mathrm{e}}^{-\lambda z})z^{-\alpha-1} \,\mathrm{d} z\end{equation}
and
 \begin{equation}F_j(\lambda) =\dfrac{\alpha}{j!} \int_0^\lambda \,{\mathrm{e}}^{-z} z^{j-\alpha-1}\,\mathrm{d} z,\quad j\in\Bbb{N}_n,\ \lambda>0.\end{equation}
In each of (2)–(5),
 $k\in \Bbb{N}_n$
,
 $n\in\Bbb{N}$
, and
 $\mathbf{m}$
takes values in the set
 $A_{kn}$
in (1).
The limiting distribution of
 $K_n$
is already known for each case, and for components of
 $\mathbf{M}_n$
separately for
 $\mathrm{\mathbf{PD}} (\alpha,0)$
and
 $\mathrm{\mathbf{PD}} (\theta)$
, but the joint approach adds new information. For example, the limiting distributions of
 $\mathbf{M}_n(\theta)$
and
 $K_n(\theta)$
are known separately for
 $\mathrm{\mathbf{PD}} (\theta)$
(the ESF), but we show that they are asymptotically independent. For
 $\mathrm{\mathbf{PD}} (\alpha,\theta)$
and
 $\mathrm{\mathbf{PD}} _\alpha^{(r)}$
we obtain the limiting covariance matrix of a finite number of components of
 $\mathbf{M}_n$
after centering and normalising, and show that the conditional limiting distribution of these, given
 $K_n$
, is normal – a useful fact for statistical applications.
Here we list some additional notation and preliminaries. The multinomial distribution arises in a natural way when considering the distribution of
 $\mathbf{M}_n$
. We use the following generic notation for a multinomial vector with its length and associated occupancy probabilities specified by context. If
 $J\ge 0$
and
 $n>J$
are integers,
 $\mathbf{p}=(p_{J+1}, \ldots, p_n)$
is a vector with positive entries such that
 $p_{J+1}+\ldots+p_n=1$
, and
 $m_{J+1}, \ldots, m_n$
are non-negative integers with
 $m_{J+1}+\ldots+m_n=b\le n$
, we set
 \begin{equation}\mathbf{P}(\mathrm{\mathbf{Mult}} (J,b,n,\mathbf{p})=(m_{J+1},\ldots, m_n) )=b! \prod_{j=J+1}^n\dfrac{p_j^{m_j}}{m_j!}.\end{equation}
We recall a useful representation from [Reference Ipsen, Maller and Shemehsavar26, p. 374]. Denote the components of the multinomial
 $\mathrm{\mathbf{Mult}} (J,b,n,\mathbf{p})$
by
 $(M_{J+1}, \ldots, M_n)$
. This vector has moment generating function (MGF)
 \begin{equation*} E\Biggl(\exp\Biggl(\sum_{j=J+1}^n \nu_j M_j\Biggr)\Biggr)= \Biggl(\sum_{j=J+1}^n p_j \,{\mathrm{e}}^{\nu_j}\Biggr)^{b},\end{equation*}
where
 $\nu_j>0$
,
 $J+1\le j\le n$
. Choosing
 $\nu_j=\nu j$
,
 $J+1\le j\le n$
, where
 $\nu>0$
, gives
 \begin{equation}E\Biggl(\exp\Biggl(\nu\sum_{j=J+1}^n j M_j\Biggr)\Biggr)= \Biggl(\sum_{j=J+1}^n p_j \,{\mathrm{e}}^{\nu j}\Biggr)^{b}.\end{equation}
Introduce independent and identically distributed (i.i.d.) random variables
 $X_i$
with
 $P(X_i=j)=p_j$
,
 $J+1\le j\le n$
. Then the right-hand side of (9) is the MGF of
 $\sum_{i=1}^b X_i$
.
A related covariance matrix that occurs in our analyses is the
 $J\times J$
matrix
 $\mathbf{Q}_J$
with diagonal elements
 $q_i(1-q_i)$
and off-diagonal elements
 $-q_iq_j$
,
 $1\le i\ne j\le J$
, where
 \begin{equation}q_j = \dfrac{\alpha \Gamma(j-\alpha)}{j!\Gamma(1-\alpha)}, \quad j\in \Bbb{N}_J,\ J\in \Bbb{N},\ J<n.\end{equation}
We develop a systematic method of proof in which the novelty is to combine detailed asymptotics of the combinatorial parts of (2)–(5) together with a local limit theorem arising from the representation (9) applied to the distributions of
 $(\mathbf{M}_n, K_n$
) in the various cases. In two instances key results concerning subordinators due to Covo [Reference Covo8] and Hensley [Reference Hensley22] are also used.
The paper is organised as follows. We start in the next section with
 $\mathrm{\mathbf{PD}} _\alpha^{(r)}$
by analysing the distribution of
 $(\mathbf{M}_n(\alpha,r),\, K_n(\alpha,r))$
as
 $n\to\infty$
. This is the most difficult of the cases we deal with, but having established the method, the analogous results for
 $\mathrm{\mathbf{PD}} (\alpha,\theta)$
,
 $\mathrm{\mathbf{PD}} (\alpha,0)$
, and
 $\mathrm{\mathbf{PD}} (\theta)$
follow with only necessary changes in Sections 4 and 5. Section 6 gives other related limiting results; for example, the limit as
 $r\downarrow 0$
of
 $\mathrm{\mathbf{PD}} _\alpha^{(r)}$
is
 $\mathrm{\mathbf{PD}} (\alpha,0)$
. Further discussion and more references are in the concluding Section 7.
3. Limiting distribution of
 $(\mathbf{M}_n(\alpha,r),\, K_n(\alpha,r))$
as
$n\to\infty$


In the
 $\mathrm{\mathbf{PD}} _\alpha^{(r)}$
model,
 $\mathbf{M}_n(\alpha,r)$
and
 $K_n(\alpha,r)$
depend on the parameters
 $\alpha\in(0,1)$
and
 $r>0$
, and the sample size
 $n\in \Bbb{N}$
. In this section
 $\alpha$
and r are kept fixed for the large-sample analysis (
 $n\to\infty$
). The limiting distribution of
 $K_n(\alpha,r)$
was derived in [Reference Ipsen, Maller and Shemehsavar26]. Here we extend that analysis to get the joint limiting distribution of a finite number of components of
 $\mathbf{M}_n(\alpha,r)$
, self-normalised by
 $K_n(\alpha,r)$
, together with
 $K_n(\alpha,r)$
. A surprising and novel aspect is the
 $n^{\alpha/2}$
norming needed for the self-normalised frequency spectrum (after appropriate centering).
Introduce for each
 $\lambda>0$
a subordinator
 $(Y_t(\lambda))_{t>0}$
having Lévy measure
 \begin{equation} \Pi_\lambda(\mathrm{d} y) \,:\!=\,\dfrac{ \alpha y^{-\alpha-1}\,\mathrm{d} y} {\Gamma(1-\alpha)}( \mathbf{1}_{\{0<y<\lambda\le 1\}} + \mathbf{1}_{\{0<y<1<\lambda\}}). \end{equation}
As shown in [Reference Ipsen, Maller and Shemehsavar26], each
 $Y_t(\lambda)$
,
 $t>0$
,
 $\lambda>0$
, has a continuous bounded density which we denote by
 $f_{Y_t(\lambda)}(y)$
,
 $y>0$
. Let
 $J\ge 1$
be a fixed integer, and define
 $q_j$
and
 $\mathbf{Q}_J$
as in (10). Let
 $\mathbf{a}=(a_1,a_2, \ldots, a_J)\in\Bbb{R}^J$
,
 $c>0$
, and recall that for the components of
 $\mathbf{M}_n(\alpha,r)$
we write
 $(M_{jn}(\alpha,r))_{1\le j\le n}$
. Throughout, when
 $\mathbf{m}\in A_{kn}$
, let
 $m_{+}= \sum_{j=1}^Jm_j$
and
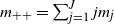 $m_{++}= \sum_{j=1}^Jjm_j$
. Then we have the following.
Theorem 1. For the
 $\mathrm{\mathbf{PD}} _\alpha^{(r)}$
model, we have
 \begin{align}&\lim_{n\to\infty} \mathbf{P}\biggl(\dfrac{M_{jn}(\alpha,r)}{K_n(\alpha,r)}\leq q_j+ \frac{a_j}{n^{\alpha/2}},\, 1\le j\le J,\dfrac{K_n(\alpha,r)}{n^\alpha} \le c\biggr) \notag \\ &\quad = \dfrac{1}{\Gamma(r)\Gamma^r(1-\alpha)} \int_{\mathbf{y}\in \Bbb{R}^J,\, \mathbf{y}\le \mathbf{a}}\int_{0<x\le c} \int_{\lambda>0}\dfrac{x^{r+J/2-1} \,{\mathrm{e}}^{-\frac{x}{2} \mathbf{y}^{{\top}}\mathbf{Q}_J^{-1}\mathbf{y}}}{\sqrt{(2\pi)^{J}\operatorname{det}(\mathbf{Q}_J)}} \notag \\ & \quad \quad \times{\mathrm{e}}^{-x(\lambda^{-\alpha}\vee 1)/\Gamma(1-\alpha)}f_{Y_x(\lambda)}(1)\dfrac{\mathrm{d} \lambda}{ \lambda^{\alpha r+1}} \,\mathrm{d} x\,\mathrm{d} \mathbf{y}.\end{align}
Corollary 1. Let
 $(\widetilde{\mathbf{M}}(\alpha,r), K(\alpha,r))$
denote a vector having the distribution on the right-hand side of (12). Then the distribution of
 $\widetilde{\mathbf{M}}(\alpha,r)$
, conditional on
 $K(\alpha,r)=x>0$
, is
 $N(\bf0,\mathbf{Q}_J/\textrm{x})$
, that is, with density
 \begin{equation}\dfrac{x^{J/2}\,{\mathrm{e}}^{-\frac{x}{2} \mathbf{y}^{{\top}}\mathbf{Q}_J^{-1}\mathbf{y}}}{\sqrt{(2\pi)^{J}\operatorname{det}(\mathbf{Q}_J)}}, \quad \mathbf{y}\in \Bbb{R}^J.\end{equation}
Proof of Theorem
1. Take
 $n,J\in \Bbb{N}$
,
 $n>J$
,
 $\mathbf{m}= (m_1,\ldots,m_n)\in A_{kn}$
and
 $k\in\Bbb{N}_n$
. From (5) we can write
 \begin{align}&\mathbf{P}(M_{jn}(\alpha,r)=m_j, 1\le j\le J,\, K_n(\alpha,r)=k) \notag\\ &\quad =n\int_{0}^{\infty}\dfrac{\Gamma(r+k)\lambda^{\alpha k}}{\Gamma(r)\Psi(\lambda)^{r+k}}\prod_{j=1}^J \dfrac{1}{m_j!} (F_j(\lambda))^{m_j}\times\sum_{\mathbf{m}^{(J)}\in A_{kn}^{(J)}}\prod_{j=J+1}^n \dfrac{1}{m_j!} (F_j(\lambda))^{m_j}\dfrac{\mathrm{d} \lambda}{ \lambda},\end{align}
with
 $\mathbf{m}^{(J)}=(m_{J+1}, \ldots, m_n)$
and
 \begin{equation}A_{kn}^{(J)}=\Biggl\{m_j\ge 0, J< j\le n\colon \sum_{j=J+1}^njm_j=n-m_{++},\,\sum_{j=J+1}^n m_j=k- m_{+}\Biggr\}.\end{equation}
(Recall
 $m_{+}= \sum_{j=1}^Jm_j$
and
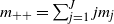 $m_{++}= \sum_{j=1}^Jjm_j$
.) For each
 $\lambda>0$
, let
 \begin{equation*} \mathbf{p}_n^{(J)}(\lambda)= \bigl(p_{jn}^{(J)}(\lambda)\bigr)_{J+1\le j\le n}=\Biggl(\dfrac{F_j(\lambda)}{\sum_{\ell=J+1}^n F_\ell(\lambda)}\Biggr)_{J+1\le j\le n}.\end{equation*}
In the notation of (8), let
 $\mathrm{\mathbf{Mult}} \bigl(J,k-m_+, n, \mathbf{p}_n^{(J)}(\lambda)\bigr)$
be a multinomial vector with
 \begin{equation}\mathbf{P}\bigl(\mathrm{\mathbf{Mult}} \bigl(J,k-m_+, n, \mathbf{p}_n^{(J)}(\lambda)\bigr)=(m_{J+1},\ldots, m_n) \bigr)=(k-m_{+})!\prod_{j=J+1}^n\dfrac{\bigl(p_{jn}^{(J)}(\lambda)\bigr)^{m_j}}{m_j!},\end{equation}
where
 $m_j\ge 0$
,
 $J+1\le j\le n$
, and
 $\sum_{j=J+1}^n m_j=k-m_{+}$
. We can represent the summation over
 $\mathbf{m}^{(J)}\in A_{kn}^{(J)}$
of the right-hand side of (16) using (9), the probability
 \begin{equation}\mathbf{P}\Biggl(\sum_{i=1}^{k-m_{+}} X_{in}^{(J)}(\lambda)=n- m_{++}\Biggr), \end{equation}
and a method detailed in [Reference Ipsen, Maller and Shemehsavar26, p. 375]. In (17),
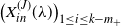 $\bigl(X_{in}^{(J)}(\lambda)\bigr)_{1\le i\le k-m_{+}}$
are i.i.d. with
 \begin{equation*} \mathbf{P}\bigl(X_{1n}^{(J)}(\lambda)=j\bigr) =p_{jn}^{(J)}(\lambda),\ J+1\le j\le n.\end{equation*}
For brevity let
 $k^{\prime}=k-m_{+}$
and
 $n^{\prime}=n- m_{++}$
, where convenient in what follows. Then
 \begin{align*} &\sum_{\mathbf{m}^{(J)}\in A_{kn}^{(J)}}\prod_{j=J+1}^n \dfrac{1}{m_j!} (F_j(\lambda))^{m_j} \notag \\ &\quad =\dfrac{1}{k^{\prime}!}\sum_{\mathbf{m}^{(J)}\in A_{kn}^{(J)}}k^{\prime}!\prod_{j=J+1}^n \dfrac{1}{m_j!} \bigl(p_{jn}^{(J)}(\lambda)\bigr)^{m_j} \Biggl(\sum_{\ell=J+1}^n F_\ell(\lambda)\Biggr)^{m_j} \notag \\ &\quad =\dfrac{1}{ k^{\prime}!} \Biggl(\sum_{\ell=J+1}^n F_\ell(\lambda)\Biggr)^{k^{\prime}}\mathbf{P}\Biggl(\sum_{i=1}^{k^{\prime}} X_{in}^{(J)}(\lambda)=n^{\prime}\Biggr).\end{align*}
So now we can represent (14) as
 \begin{align}&\mathbf{P}(M_{jn}(\alpha,r)=m_j, \,1\le j\le J,\, K_n(\alpha,r)=k) \notag \\ &\quad = n\int_{0}^{\infty}\dfrac{\Gamma(r+k)\lambda^{\alpha k}}{\Gamma(r)\Psi(\lambda)^{r+k}}\prod_{j=1}^J \dfrac{1}{m_j!} (F_j(\lambda))^{m_j} \notag \\ &\quad \quad \times\dfrac{1}{ k^{\prime}!} \Biggl(\sum_{\ell=J+1}^n F_\ell(\lambda)\Biggr)^{k^{\prime}}\mathbf{P}\Biggl(\sum_{i=1}^{k^{\prime}} X_{in}^{(J)}(\lambda)=n^{\prime}\Biggr)\dfrac{\mathrm{d} \lambda}{ \lambda}.\end{align}
In this we change variable from
 $\lambda$
to
 $\lambda n$
, and let
 \begin{equation}q_{jn}=\dfrac{F_j(\lambda n)}{\sum_{\ell=1}^n F_\ell(\lambda n)}, \quad 1\le j\le J,\quad \textrm{and}\quad q_{+n}= \sum_{j=1}^J q_{jn}.\end{equation}
The
 $q_{jn}$
and
 $q_{+n}$
depend on
 $\lambda$
, but this is omitted in the notation. From (19),
 \begin{equation*}\dfrac{\sum_{\ell=J+1}^n F_\ell(\lambda n)}{\sum_{\ell=1}^n F_\ell(\lambda n)}=1-\sum_{j=1}^J q_{jn}=1- q_{+n},\end{equation*}
so we can rewrite (18) as
 \begin{align}&\mathbf{P}(M_{jn}(\alpha,r)=m_j, \,1\le j\le J,\, K_n(\alpha,r)=k ) \notag \\ &\quad =\int_{0}^{\infty}\dfrac{\Gamma(r+k)(1-q_{+n})^{k^{\prime}}}{k^{\prime}!\prod_{j=1}^J m_j!}\prod_{j=1}^J q_{jn}^{m_j} \times\dfrac{(\lambda n) ^{\alpha k}}{\Psi(\lambda n)^{k}}\Biggl(\sum_{\ell=1}^n F_\ell(\lambda n)\Biggr)^{k} \notag\\ &\quad \quad \times\dfrac{1}{\Gamma(r)\Psi(\lambda n)^{r}}\times n\mathbf{P}\Biggl(\sum_{i=1}^{k^{\prime}} X_{in}^{(J)}(\lambda n)=n^{\prime}\Biggr)\dfrac{\mathrm{d} \lambda}{ \lambda}.\end{align}
Introducing continuous variables
 $z>0$
and
 $u_j\ge 0$
,
 $1\le j\le J$
, we can write
 \begin{align}& \mathbf{P}\biggl(\dfrac{M_{jn}(\alpha,r)}{K_n(\alpha,r)}\leq q_j+\frac{a_j}{n^{\alpha/2}},\, 1\le j\le J,\dfrac{K_n(\alpha,r)}{n^\alpha} \le c\biggr) \notag \\ &\quad =\sum_{1\le j\le J,\, 1\le k\le cn^\alpha}\mathbf{1}\bigl\{m_j \le \bigl(q_j+a_j/n^{\alpha/2}\bigr)k\bigr\} \notag \\&\quad \quad \times\mathbf{P}(M_{jn}(\alpha,r)=m_j, \, K_n(\alpha,r)=k) \notag \\ &\quad =\int\mathbf{P}(M_{jn}(\alpha,r)=\lfloor u_j\rfloor,\, K_n(\alpha,r)=\lfloor z \rfloor)\prod_{j=1}^J \,\mathrm{d} u_j \,\mathrm{d} z,\end{align}
where the integration is over the range
 \[\bigl\{u_j \le \bigl(q_j+a_j/n^{\alpha/2}\bigr)z,\, 1\le j\le J,\,0<z\le cn^\alpha\bigr\}.\]
In this integral make the change of variables
 $z=n^\alpha x$
,
 $u_j= \bigl(q_j+ y_j/n^{\alpha/2}\bigr)z$
, so
 $\mathrm{d} z=n^\alpha\,\mathrm{d} x$
,
 $\mathrm{d} u_j= \mathrm{d} y_j xn^{\alpha/2}$
, to write (21) as
 \begin{align}& \mathbf{P}\biggl(\dfrac{M_{jn}(\alpha,r)}{K_n(\alpha,r)}\leq q_j+\frac{a_j}{n^{\alpha/2}},\, 1\le j\le J,\dfrac{K_n(\alpha,r)}{n^\alpha} \le c\biggr) \notag \\ &\quad =n^{\alpha(1+J/2)} \notag \\ &\quad \quad \times \int_{\mathbf{y}\le \mathbf{a},\, 0<x\le c} x^J\mathbf{P}\bigl(M_{jn}(\alpha,r)=\bigl\lfloor \bigl(q_j+ y_j/n^{\alpha/2}\bigr)xn^\alpha\bigr\rfloor,1\leq j\leq J, K_n(\alpha,r)=\lfloor xn^\alpha \rfloor\big)\,\mathrm{d} \mathbf{y}\,\mathrm{d} x.\end{align}
Substitute from (20) to write the last expression as
 \begin{align}\int_{\lambda>0} \int_{\mathbf{y}\le \mathbf{a},\, 0<x\le c} f_n(\mathbf{y},x,\lambda) \,\mathrm{d} \mathbf{y}\, \mathrm{d} x\, \mathrm{d}\lambda\,=\!:\,\int_{\lambda>0} I_n(\mathbf{a},c,\lambda)\,\mathrm{d}\lambda,\end{align}
where
 \[I_n(\mathbf{a},c,\lambda)=\int_{\mathbf{y}\le \mathbf{a},\, 0<x\le c} f_n(\mathbf{y},x,\lambda) \,\mathrm{d} \mathbf{y} \,\mathrm{d} x\]
and
 $ f_n(\mathbf{y},x,\lambda)$
denotes the probability in (22), together with a factor
 $n^{\alpha(1+J/2)}x^J$
, and with
 $m_j$
replaced by
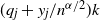 $ (q_j+ y_j/n^{\alpha/2})k$
and k replaced by
 $\lfloor xn^\alpha \rfloor$
in (20). The limiting behaviours of the four factors in (20) which contribute to
 $ f_n(\mathbf{y},x,\lambda)$
are set out in the next lemma, whose proof is given in the supplementary material to this paper. The matrix
 $\mathbf{Q}_J$
is defined using (10), its determinant is
 $\textrm{ det}(\mathbf{Q}_J)$
and a tilde means the ratio of the connected quantities tends to 1.
Lemma 1. With the substitutions
 $k=\lfloor xn^\alpha \rfloor$
,
 $m_j=\lfloor q_j+ y_j/n^{\alpha/2}\rfloor k$
,
 $k^{\prime}=k- m_{+}$
, we have the following limiting behaviours as
 $n\to\infty$
:
 \begin{align}\dfrac{\Gamma(r+k)(1-q_{+n})^{k^{\prime}}}{k^{\prime}!\prod_{j=1}^J m_j!}\prod_{j=1}^J q_{jn}^{m_j}\sim\dfrac{(xn^\alpha)^{r-J/2-1}\,{\mathrm{e}}^{-\frac{x}{2} \mathbf{y}^{{\top}}\mathbf{Q}_J^{-1}\mathbf{y}}}{ \sqrt{(2\pi)^{J}\operatorname{det}(\mathbf{Q}_J)}},\end{align}
 \begin{align}\lim_{n\to\infty}\dfrac{(\lambda n)^{\alpha k}}{\Psi(\lambda n)^{k}}\Biggl(\sum_{\ell=1}^n F_\ell(\lambda n)\Biggr)^{k}={\mathrm{e}}^{-x (\lambda^{-\alpha}\vee 1)/\Gamma(1-\alpha)},\end{align}
 \begin{align}\dfrac{1}{\Gamma(r)\Psi(\lambda n)^{r}}\sim\dfrac{1}{\Gamma(r)(\lambda n)^{r\alpha}\Gamma^r(1-\alpha)},\end{align}
 \begin{align}\lim_{n\to\infty}n\mathbf{P}\Biggl(\sum_{i=1}^{k-m_{+}} X_{in}^{(J)}(\lambda n)=n- m_{++}\Biggr)= f_{Y_x(\lambda)}(1).\end{align}
Multiplying together the right-hand sides of (24)–(27), and keeping in mind the factor of
 $n^{\alpha(1+J/2)}$
from (22), which exactly matches the factors of n in the right-hand side of (24) and (26), then substituting in (20), shows the existence of the limit
 \begin{align}\lim_{n\to\infty} f_n(\mathbf{y},x,\lambda)& \,=\!:\,f(\mathbf{y},x,\lambda) \notag \\ & = \dfrac{1}{\Gamma(r)\Gamma^r(1-\alpha)}\dfrac{x^{r+J/2-1} \,{\mathrm{e}}^{-\frac{x}{2} \mathbf{y}^{{\top}}\mathbf{Q}_J^{-1}\mathbf{y}}}{\sqrt{(2\pi)^{J}\operatorname{det}(\mathbf{Q}_J)}}\,{\mathrm{e}}^{-x(\lambda^{-\alpha}\vee 1)/\Gamma(1-\alpha)}\dfrac{f_{Y_x(\lambda)}(1)} \lambda.\end{align}
This is the integrand in (12). Let
 \[I(\lambda)\,:\!=\, \int_{\mathbf{y}\in\Bbb{R}^J,\, x>0} f(\mathbf{y},x,\lambda) \,\mathrm{d}\mathbf{y} \,\mathrm{d} x. \]
Then
 $\int_{\lambda>0}I(\lambda)\,\mathrm{d}\lambda$
is the integral in (12) taken over
 $(\mathbf{y},x)\in \Bbb{R}^J\times (0,\infty)$
. The integral over
 $\mathbf{y}$
of the right-hand side of (28) equals
 \begin{equation*} \dfrac{x^{r-1} }{\Gamma(r)\Gamma^r(1-\alpha)}\,{\mathrm{e}}^{-x(\lambda^{-\alpha}\vee 1)/\Gamma(1-\alpha)}\dfrac{f_{Y_x(\lambda)}(1)}{ \lambda^{\alpha r+1}},\end{equation*}
and when integrated over
 $\lambda>0$
this equals the limiting density of
 $K_n(\alpha,r)$
in equation (2.8) of [Reference Ipsen, Maller and Shemehsavar26]. Thus
 $\int_{\lambda>0}I(\lambda)\,\mathrm{d}\lambda=1$
.
Now argue as follows. Let
 $E_n$
denote the event in the probability on the left-hand side of (22). Then, by (23),
 $\mathbf{P}(E_n) =\int_{\lambda>0} I_n(\mathbf{a},c,\lambda)\,\mathrm{d}\lambda$
, and Fatou’s lemma gives
 \begin{equation}\liminf_{n\to\infty}\mathbf{P}(E_n) =\liminf_{n\to\infty}\int_{\lambda>0} I_n(\mathbf{a},c,\lambda)\,\mathrm{d}\lambda\ge \int_{\lambda>0} I(\mathbf{a},c,\lambda)\,\mathrm{d}\lambda ,\end{equation}
where
 \begin{equation*} I(\mathbf{a},c,\lambda) = \liminf_{n\to\infty} I_n(\mathbf{a},c,\lambda) \ge \int_{\mathbf{y}\le \mathbf{a},\, 0<x\le c} f(\mathbf{y},x,\lambda)\,\mathrm{d}\mathbf{y} \,\mathrm{d} x,\end{equation*}
again by Fatou’s lemma. Let
 $E_n^c$
denote the complement of
 $E_n$
and set
 $ I^c(\mathbf{a},c,\lambda)=I(\lambda) - I(\mathbf{a},c,\lambda)$
and
 $ I_n^c(\mathbf{a},c,\lambda)=I(\lambda) - I_n(\mathbf{a},c,\lambda)$
. Then
 \begin{align*} \liminf_{n\to\infty}\mathbf{P}(E_n^c) & = \liminf_{n\to\infty}(1-\mathbf{P}(E_n)) \notag\\ & =\liminf_{n\to\infty}\int_{\lambda>0}( I(\lambda)-I_n(\mathbf{a},c,\lambda))\,\mathrm{d}\lambda \notag \\& =\liminf_{n\to\infty}\int_{\lambda>0}I_n^c(\mathbf{a},c,\lambda)\,\mathrm{d}\lambda \notag\\ & \ge \int_{\lambda>0} \liminf_{n\to\infty} I_n^c(\mathbf{a},c,\lambda)\,\mathrm{d}\lambda. \end{align*}
Now
 \begin{align*} \liminf_{n\to\infty} I_n^c(\mathbf{a},c,\lambda) & =\liminf_{n\to\infty} \int_{\{\mathbf{y}\le \mathbf{a},\, 0<x\le c\}^c} f_n(\mathbf{y},x,\lambda)\,\mathrm{d}\mathbf{y} \,\mathrm{d} x\\ & \ge \int_{\{\mathbf{y}\le \mathbf{a},\, 0<x\le c\}^c} f(\mathbf{y},x,\lambda)\,\mathrm{d}\mathbf{y} \,\mathrm{d} x\\& =\biggl( \int_{\{\mathbf{y}\in\Bbb{R}^J,\, x>0\}} - \int_{\mathbf{y}\le \mathbf{a},\, 0<x\le c} \biggr) f(\mathbf{y},x,\lambda)\,\mathrm{d}\mathbf{y} \,\mathrm{d} x\\ &\ge I(\lambda)-I(\mathbf{a},c,\lambda), \end{align*}
and hence
 \begin{equation*} \int_{\lambda>0} \liminf_{n\to\infty} I_n^c(\mathbf{a},c,\lambda)\,\mathrm{d}\lambda \ge \int_{\lambda>0}(I(\lambda)-I(\mathbf{a},c,\lambda)) \,\mathrm{d}\lambda=1-\int_{\lambda>0} I(\mathbf{a},c,\lambda)\,\mathrm{d}\lambda.\end{equation*}
It follows that
 \begin{equation}\limsup_{n\to\infty}\mathbf{P}(E_n) =1- \liminf_{n\to\infty}\mathbf{P}(E_n^c)\le\int_{\lambda>0} I(\mathbf{a},c,\lambda)\,\mathrm{d}\lambda,\end{equation}
and together with (29) this proves
 \[\lim_{n\to\infty}\mathbf{P}(E_n)=\int_{\lambda>0} I(\mathbf{a},c,\lambda)\,\mathrm{d}\lambda,\]
i.e. (12).
Proof of Corollary
1.
 $(\widetilde{\mathbf{M}}(\alpha,r), K(\alpha,r))$
has density equal to
 \[\int_{\lambda>0}f(\mathbf{y},x,\lambda)\,\mathrm{d} \lambda,\]
where
 $f(\mathbf{y},x,\lambda)$
is defined in (28). Integrating out
 $\mathbf{y}$
from this integral gives
 \begin{equation*} f_{K(\alpha,r)}(x)\,:\!=\, \dfrac{x^{r-1} }{\Gamma(r)\Gamma^r(1-\alpha)}\int_{\lambda>0}\,{\mathrm{e}}^{-x(\lambda^{-\alpha}\vee 1)/\Gamma(1-\alpha)}f_{Y_x(\lambda)}(1)\dfrac{\mathrm{d} \lambda}{ \lambda^{\alpha r+1}}, \quad x>0,\end{equation*}
for the density of
 $K(\alpha,r)$
at
 $x>0$
, agreeing with equation (2.8) of [Reference Ipsen, Maller and Shemehsavar26]. Then dividing
 \[\int_{\lambda>0}f(\mathbf{y},x,\lambda)\,\mathrm{d} \lambda\]
by
 $f_{K(\alpha,r)}(x)$
gives (13).
4. The Pitman sampling formula
The next theorem deals with Pitman’s formula for the AFS from
 $\mathrm{\mathbf{PD}} (\alpha, \theta)$
. Again we see an
 $n^{\alpha/2}$
norming for the frequency spectrum, as also occurred in Theorem 1. The marginal limiting distribution obtained for
 $K_n(\alpha,\theta)/n^\alpha$
in Theorem 2 agrees with that in equation (3.27) of [Reference Pitman42, p. 68]. Let
 $c\ge 0$
,
 $J\in \Bbb{N}$
,
 $\mathbf{a}=(a_1,a_2,\ldots,a_J)\in \Bbb{R}^J$
, define
 $\mathbf{Q}_J$
as in (10) and write
 $(M_{jn}(\alpha, \theta))_{1\le j\le n}$
for the components of
 $\mathbf{M}_n(\alpha,\theta)$
.
Theorem 2. For the
 $\mathrm{\mathbf{PD}} (\alpha,\theta)$
model we have the asymptotic property
 \begin{align}&\lim_{n\to\infty} \mathbf{P}\biggl(\dfrac{M_{jn}(\alpha, \theta)}{K_n(\alpha, \theta)}\leq q_j+ \frac{a_j}{n^{\alpha/2}}, 1\le j\le J,\dfrac{K_n(\alpha, \theta)}{n^\alpha} \le c\biggr) \notag \\ &\quad =\dfrac{\Gamma(\theta+1)}{\Gamma(\theta/\alpha+1)} \int_{\mathbf{y}\in\Bbb{R}^J,\, \mathbf{y}\le \mathbf{a}} \int_{0<x\le c}\dfrac{x^{J/2+\theta/\alpha-1}\,{\mathrm{e}}^{-\frac{x}{2} \mathbf{y}^{{\top}}\mathbf{Q}_J^{-1}\mathbf{y}}}{\alpha\sqrt{(2\pi)^J\operatorname{det}(\mathbf{Q}_J)}}f_{Y_x(1)}(1) \,\mathrm{d} x\, \mathrm{d} \mathbf{y}.\end{align}
Integrating out
 $\mathbf{y}$
gives, for the limiting density of
 $K_n(\alpha,\theta)/n^\alpha$
,
 \begin{equation*} \dfrac{\Gamma(\theta+1)}{\alpha\Gamma(\theta/\alpha+1)}x^{\theta/\alpha-1}\,{\mathrm{e}}^{-x/\Gamma(1-\alpha)}f_{Y_x(1)}(1), \ x>0.\end{equation*}
When
 $\theta=0$
this can alternatively be written as a Mittag–Leffler density,
 $f_{L_\alpha}(x)$
,
 $x>0$
.
Proof of Theorem
2. Start from Pitman’s sampling formula (2) and proceed as in (14) to get, with
 $1\le J<n$
,
 \begin{align}&\mathbf{P}(M_{jn}(\alpha,\theta)=m_j, 1\le j\le J,\, K_n(\alpha,\theta)=k) \notag \\ &\quad = \dfrac{n!}{\alpha}\dfrac{\Gamma(\theta/\alpha+k)}{\Gamma(\theta/\alpha+1)}\dfrac{\Gamma(\theta+1)}{\Gamma(n+\theta)}\biggl(\dfrac{\alpha}{\Gamma(1-\alpha)}\biggr)^k\prod_{j=1}^J\dfrac{1}{m_j!}\biggl(\dfrac{\Gamma(j-\alpha)}{j!}\biggr)^{m_j} \notag \\ &\quad \quad \times\sum_{\mathbf{m}^{(J)}\in A_{kn}^{(J)}}\prod_{j=J+1}^n\dfrac{1}{m_j!}\biggl(\dfrac{\Gamma(j-\alpha)}{j!}\biggr)^{m_j},\end{align}
where
 $\mathbf{m}^{(J)}$
and
 $A_{kn}^{(J)}$
are as in (15). Let
 \begin{equation*} \mathbf{p}_n^{(J)}= \bigl(p_{jn}^{(J)}\bigr)_{J+1\le j\le n}=\biggl(\dfrac{\Gamma(j-\alpha)/j!}{\sum_{\ell=J+1}^n\Gamma(\ell-\alpha)/\ell!}\biggr)_{J+1\le j\le n},\end{equation*}
and in the notation of (8) let
 $\mathrm{\mathbf{Mult}} \bigl(J, k-m_+,n, \mathbf{p}_n^{(J)}(\lambda)\bigr)$
be a multinomial with
 \begin{equation}\mathbf{P}\bigl(\mathrm{\mathbf{Mult}} \bigl(J,k-m_+,n, \mathbf{p}_n^{(J)}\bigr)=(m_{J+1},\ldots, m_n) \big)=(k-m_{+})!\prod_{j=J+1}^n\dfrac{\bigl(p_{jn}^{(J)}\bigr)^{m_j}}{m_j!},\end{equation}
where
 $m_j\ge 0$
,
 $J+1\le j\le n$
,
 $\sum_{j=J+1}^n m_j=k-m_{+}$
, and recall that
 \[ m_{+}=\sum_{j=1}^Jm_j\quad \text{and} \quad m_{++}=\sum_{j=1}^J j m_j. \]
As in the previous proof we can represent the summation over
 $\mathbf{m}^{(J)}$
of the left-hand side of (33) using (9) and the probability
 \begin{equation}\mathbf{P}\Biggl(\sum_{i=1}^{k-m_{+}} X_{in}^{(J)}=n- m_{++}\Biggr), \end{equation}
where
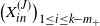 $\bigl(X_{in}^{(J)}\bigr)_{1\le i\le k-m_{+}}$
are i.i.d. with
 \begin{equation*} \mathbf{P}\bigl(X_{1n}^{(J)}=j\bigr) =p_{jn}^{(J)},\ J+1\le j\le n.\end{equation*}
Again let
 $k^{\prime}=k-m_{+}$
and
 $n^{\prime}=n- m_{++}$
where convenient. Then we obtain
 \begin{align}&\sum_{\mathbf{m}^{(J)}\in A_{kn}^{(J)}}\prod_{j=J+1}^n\dfrac{1}{m_j!}\biggl(\dfrac{\Gamma(j-\alpha)}{j!}\biggr)^{m_j} \notag \\ &\quad =\dfrac{1}{k^{\prime}!}\sum_{\mathbf{m}^{(J)}\in A_{kn}^{(J)}}k^{\prime}!\prod_{j=J+1}^n\dfrac{\bigl(p_{jn}^{(J)}\bigr)^{m_j}}{m_j!} \Biggl(\sum_{\ell=J+1}^n \dfrac{\Gamma(\ell-\alpha)}{\ell!}\Biggr)^{m_j} \notag \\ &\quad =\dfrac{1}{ k^{\prime}!} \Biggl(\sum_{\ell=J+1}^n \dfrac{\Gamma(\ell-\alpha)}{\ell!}\Biggr)^{k^{\prime}}\mathbf{P}\Biggl(\sum_{i=1}^{k^{\prime}} X_{in}^{(J)}=n^{\prime}\Biggr).\end{align}
To economise on notation we let
 \begin{equation}q_{jn}=\dfrac{\Gamma(j-\alpha)/j!}{\sum_{\ell=1}^n\Gamma(\ell-\alpha)/\ell! }, \quad 1\le j\le J,\quad \text{so that}\quad \dfrac{\sum_{\ell=J+1}^n \Gamma(\ell-\alpha)/\ell!}{\sum_{\ell=1}^n\Gamma(\ell-\alpha)/\ell!}=1- q_{+n},\end{equation}
still with
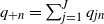 $q_{+n}= \sum_{j=1}^J q_{jn}$
. The
 $q_{jn}$
in (36) play an exactly analogous role to those in (19). We can write, with the same change of variables as in (22),
 \begin{align*} & \mathbf{P}\biggl(\dfrac{M_{jn}(\alpha, \theta)}{K_n(\alpha,\theta)}\leq q_j+\frac{a_j}{n^{\alpha/2}},\, 1\le j\le J,\dfrac{K_n(\alpha, \theta)}{n^\alpha} \le c\biggr) \notag \\ &\quad =n^{\alpha(1+J/2)}\notag \\ &\quad \quad \times \int_{\mathbf{y}\in \Bbb{R}^J,\, \mathbf{y}\le \mathbf{a}}\int_{0<x\le c}x^J\mathbf{P}\bigl(\mathbf{M}_{jn}(\alpha, \theta)=\bigl\lfloor \bigl(q_j+ y_j/n^{\alpha/2}\bigr)xn^\alpha\bigr\rfloor, 1\leq j \leq J, K_n(\alpha, \theta)\notag \\ &\quad=\lfloor xn^\alpha \rfloor\bigr)\,\mathrm{d}\mathbf{y} \,\mathrm{d} x,\end{align*}
where
 $1\le J<n$
, and then, using (32), (34), and (35), we get
 \begin{align}&\mathbf{P}(M_{jn}(\alpha, \theta)=m_j, \, 1\le j\le J,\, K_n(\alpha, \theta)=k) \notag \\ &\quad =\Biggl(\dfrac{\alpha}{\Gamma(1-\alpha)} \sum_{\ell=1}^n \dfrac{\Gamma(\ell-\alpha)}{\ell!}\Biggr)^k\times \dfrac{\Gamma(n)\Gamma(\theta/\alpha+k)\Gamma(\theta+1)}{\alpha k^{\prime}!\Gamma(\theta/\alpha+1)\Gamma(n+\theta)}\notag \\ & \quad \quad \times\big(1-q_{+n}\big)^{k^{\prime}}\prod_{j=1}^J \dfrac{q_{jn}^{m_j}}{m_j!}\times n\mathbf{P}\Biggl(\sum_{i=1}^{k^{\prime}} X_{in}^{(J)}=n^{\prime}\Biggr). \quad \end{align}
The following counterpart of Lemma 1 is proved in the supplementary material.
Lemma 2. With the substitutions
 $k=\lfloor xn^\alpha \rfloor$
,
 $m_j= \lfloor q_j+ y_j/n^{\alpha/2}\rfloor k$
,
 $k^{\prime}=k- m_{+}$
, we have the following limiting behaviours as
 $n\to\infty$
:
 \begin{gather*} \dfrac{(k-1)!(1-q_{+n})^{k^{\prime}}}{k^{\prime}!\prod_{j=1}^J m_j!}\prod_{j=1}^Jq_{jn}^{m_j}\sim\dfrac{(xn^{\alpha})^{-J/2-1} \,{\mathrm{e}}^{-\frac{x}{2} \mathbf{y}^{{\top}}\mathbf{Q}_J^{-1}\mathbf{y}}}{ \sqrt{(2\pi)^J\operatorname{det}(\mathbf{Q}_J)}},\\\lim_{n\to\infty}\Biggl(\dfrac{\alpha}{\Gamma(1-\alpha)} \sum_{\ell=1}^n \dfrac{\Gamma(\ell-\alpha)}{\ell!}\Biggr)^{\lfloor xn^\alpha\rfloor}={\mathrm{e}}^{-x/\Gamma(1-\alpha)},\\ \dfrac{\Gamma(n)\Gamma(\theta/\alpha+k)\Gamma(\theta+1)}{\alpha k^{\prime}!\Gamma(\theta/\alpha+1)\Gamma(n+\theta)}\sim\dfrac{x^{\theta/\alpha} (k-1)! \Gamma(\theta+1)}{\alpha k^{\prime}! \Gamma(\theta/\alpha+1)},\\\lim_{n\to\infty}n\mathbf{P}\Biggl(\sum_{i=1}^{k^{\prime}} X_{in}^{(J)}=n^{\prime}\Biggr)= f_{Y_x(1)}(1).\end{gather*}
Substituting these estimates in (37), we arrive at (31).
The
 $\mathrm{\mathbf{PD}} (\alpha,\theta)$
model reduces exactly to the
 $\mathrm{\mathbf{PD}} (\alpha,0)$
model when
 $\theta$
is set equal to 0, and the same is true of the asymptotic result for it. There is an interesting connection between the probability density of a Stable(
 $\alpha$
) subordinator and that of a Mittag–Leffler random variable, which we exploit. Write the probability density function (PDF) of a Stable(
 $\alpha$
) subordinator
 $(S_x(\alpha))_{x\ge 0}$
(using variable
 $x\ge 0$
for the time parameter) having Laplace transform
 ${\mathrm{e}}^{-x\tau^{\alpha}}$
and Lévy density
 $\alpha z^{-\alpha-1}\mathbf{1}_{\{z>0\}}/\Gamma(1-\alpha)$
, as
 \begin{equation}f_{S_x(\alpha)}(s) =\dfrac{1}{\pi} \sum_{k=0}^\infty\dfrac{({-}1)^{k+1}}{k!}\dfrac{\Gamma(\alpha k+1)}{s^{\alpha k+1}}x^k\sin(\pi\alpha k),\end{equation}
and the PDF of a Mittag–Leffler random variable
 $L_\alpha$
with parameter
 $\alpha$
as
 \begin{equation}f_{L_\alpha}(s) =\dfrac{1}{\pi\alpha} \sum_{k=0}^\infty\dfrac{({-}1)^{k+1}}{k!} {\Gamma(\alpha k+1)}{s^{k-1}}\sin(\pi\alpha k)\end{equation}
(Pitman [Reference Pitman42, pp. 10, 11]). Then observe the useful relation
 \begin{equation}\dfrac{1}{\alpha x}f_{S_x(\alpha)}(1)=f_{L_\alpha}(x), x>0.\end{equation}
Let
 $\mathbf{a}=(a_1,a_2, \ldots,a_J)\in\Bbb{R}^J$
,
 $c> 0$
, and write
 $(M_{jn}(\alpha))_{1\le j\le n}$
for the components of
 $\mathbf{M}_n(\alpha)$
. We prove the following theorem as a corollary to Theorem 2.
Theorem 3. For the
 $\mathrm{\mathbf{PD}} (\alpha,0)$
model, we have
 \begin{align}&\lim_{n\to\infty} \mathbf{P}\biggl(\dfrac{M_{jn}(\alpha)}{K_n(\alpha)}\leq q_j+ \dfrac{a_j}{n^{\alpha/2}},\, 1\le j\le J,\dfrac{K_n(\alpha)}{n^\alpha} \le c\biggr) \notag \\ &\quad = \int_{\mathbf{y}\in \Bbb{R}^J, \, \mathbf{y}\le \mathbf{a}} \int_{0<x\le c}\dfrac{x^{J/2-1}\,{\mathrm{e}}^{-\frac{x}{2} \mathbf{y}^{{\top}}\mathbf{Q}_J^{-1}\mathbf{y}}}{\alpha \sqrt{(2\pi)^J\operatorname{det}(\mathbf{Q}_J)}}\,{\mathrm{e}}^{-x/\Gamma(1-\alpha)}f_{Y_x(1)}(1) \,\mathrm{d} x\, \mathrm{d} \mathbf{y}.\end{align}
Integrating out
 $\mathbf{y}$
gives, for the limiting density of
 $K_n(\alpha)/n^\alpha$
,
 \begin{equation*} \dfrac{1}{\alpha x}\,{\mathrm{e}}^{-x/\Gamma(1-\alpha)}f_{Y_x(1)}(1), \quad x>0.\end{equation*}
This can alternatively be written as a Mittag–Leffler density,
 $f_{L_\alpha}(x)$
,
 $x>0$
.
Let
 $(\widetilde{\mathbf{M}}(\alpha), K(\alpha))$
have the distribution on the right-hand side of (41). The distribution of
 $\widetilde{\mathbf{M}}(\alpha)$
, conditional on
 $K(\alpha)=x>0$
, is
 $N(\bf0,\mathbf{Q}_J/\textrm{x})$
, as in (13).
Remarks. (i) Pitman [Reference Pitman42, Thm 3.8, p. 68] gives the almost sure convergence of
 $K_n(\alpha)/n^\alpha$
to a Mittag–Leffler random variable and the corresponding almost sure convergence of each
 $M_{jn}/n^\alpha$
. Equation (41) also shows that the
 $M_{jn}$
are of order
 $n^\alpha$
, but we express (41) as we do because
 $K_n(\alpha)$
is a natural normaliser of
 $\mathbf{M}_n(\alpha)$
, producing a vector whose components add to 1. Similarly in Theorems 1 and 2.
(ii) Following the fidi convergence proved in Theorems 1, 2, and 3, it is natural to ask for functional versions. We leave consideration of this to another time.
Proof of Theorem
3. Equation (31) reduces to (41) when
 $\theta=0$
, so we need only show how the density
 $f_{Y_x(1)}(1)$
in (41) is related to the density of the Mittag–Leffler distribution. Here a result of Covo [Reference Covo8], which relates the Lévy density of a subordinator to that of a subordinator with the same but truncated Lévy measure, plays a key role.
The Lévy density of
 $Y_x(1)$
is obtained from (11) with
 $\lambda=1$
, and is the same as that of
 $S_x(\alpha)$
truncated at 1. Using Corollary 2.1 of Covo [Reference Covo8] (in his formula set
 $x=1$
,
 $s=\lambda$
,
 $t=x$
, and take
 $\Lambda(\lambda)=\lambda^{-\alpha}/\Gamma(1-\alpha)$
), we have
 \begin{equation}f_{Y_x(\lambda)}(1)={\mathrm{e}}^{x\lambda^{-\alpha}/\Gamma(1-\alpha)}\Biggl(f_{S_x(\alpha)}(1)+\sum_{\kappa=1}^{\lceil 1/\lambda \rceil-1}({-}x)^\kappa A_{\lambda:\kappa}^{(1)}(1,x)\Biggr)\end{equation}
(with
 $\sum_1^0\equiv 0$
), where the
 $ A_{\lambda:\kappa}^{(1)}$
are certain functions defined by Covo. When
 $\lambda =1$
these functions disappear from the formula, and we simply have
 \begin{equation*}f_{Y_x(1)}(1)={\mathrm{e}}^{x/\Gamma(1-\alpha)}f_{S_x(\alpha)}(1).\end{equation*}
Using this together with (40) to replace
 $f_{Y_x(1)}(1)$
in (41), we obtain a representation of the limiting density of
 $K_n(\alpha)/n^\alpha$
in terms of a Mittag–Leffler density, in agreement with Theorem 3.8 of [Reference Pitman42].
The conditional distribution of
 $\widetilde{\mathbf{M}}(\alpha)$
given
 $K(\alpha)$
follows easily.
5. The Ewens sampling formula
In the next theorem, dealing with
 $\mathrm{\mathbf{PD}} (\theta)$
, the limiting behaviours of
 $\mathbf{M}_n(\theta)$
and
 $K_n(\theta)$
as (independent) Poissons and normal are well known separately ([Reference Arratia, Barbour and Tavaré2, p. 96], [Reference Pitman42, pp. 68, 69]), but the asymptotic independence of
 $\mathbf{M}_n(\theta)$
and
 $K_n(\theta)$
seems not to have been previously noted, and the way the joint limit arises from the methodology of the previous sections is also interesting. A result of Hensley [Reference Hensley22] plays a key role. Let
 $\mathbf{m}= (m_1,\ldots,m_n)\in A_{kn}$
,
 $c\in \Bbb{R}$
, and write
 $(M_{jn}(\theta))_{1\le j\le n}$
for the components of
 $\mathbf{M}_n(\theta)$
.
Theorem 4. For the
 $\mathrm{\mathbf{PD}} (\theta)$
model we have
 \begin{align}&\lim_{n\to\infty} \mathbf{P}\biggl(M_{jn}(\theta)=m_j, 1\le j\le J,\dfrac{K_n(\theta)-\theta \log n}{\sqrt{\theta\log n}} \le c\biggr) \notag\\ &\quad =\prod_{j=1}^J\dfrac{1}{m_j!}\biggl(\dfrac{\theta}{j}\biggr)^{m_j}\,{\mathrm{e}}^{-\theta/j}\times\dfrac{1}{\sqrt{2\pi }} \int_{x\le c} \,{\mathrm{e}}^{-\frac{1}{2} x^2} \,\mathrm{d} x.\end{align}
Proof of Theorem
4. Starting from Ewens’ sampling formula (4), with
 $n,J\in \Bbb{N}$
,
 $n>J$
,
 $k\in\Bbb{N}_n$
, and
 $m_+= \sum_{j=1}^J m_j$
, we get
 \begin{align}&\mathbf{P}(M_{jn}(\theta)=m_j, 1\le j\le J,\, K_n(\theta)=k) \notag \\ &\quad = \dfrac{n!\Gamma(\theta)\theta^{k- m_+}}{\Gamma(n+\theta)}\prod_{j=1}^J\dfrac{1}{m_j!}\biggl(\dfrac{\theta}{j}\biggr)^{m_j}\sum_{\mathbf{m}^{(J)}\in A_{kn}^{(J)}}\prod_{j=J+1}^n\dfrac{1}{m_j!}\biggl(\dfrac{1}{j}\biggr)^{m_j},\end{align}
where
 $\mathbf{m}^{(J)}$
and
 $A_{kn}^{(J)}$
are as in (15). Let vector
 $\mathbf{p}_n^{(J)}$
have components

and let
 $\mathrm{\mathbf{Mult}} \bigl(J,k-m_+, n, \mathbf{p}_n^{(J)}\bigr)$
be multinomial with distribution
 \begin{equation*}\mathbf{P}\bigl(\mathrm{\mathbf{Mult}} \bigl(J,k-m_+, n, \mathbf{p}_n^{(J)}\bigr)=(m_{J+1},\ldots, m_n) \bigr)=(k- m_+)!\prod_{j=J+1}^n\dfrac{(p_{jn})^{m_j}}{m_j!},\end{equation*}
for
 $m_j\ge 0$
, with
 $\sum_{j=J+1}^n m_j=k- m_+$
. Thus, arguing as in (35), we find
 \begin{equation*} \sum_{\mathbf{m}^{(J)}\in A_{kn}^{(J)}}\prod_{j=J+1}^n\dfrac{1}{m_j!}\biggl(\dfrac{1}{j}\biggr)^{m_j}=\dfrac{1}{k^{\prime}!}\Biggl(\sum_{\ell=J+1}^n\dfrac{1}{\ell}\Biggr)^{k^{\prime}}\mathbf{P}\Biggl(\sum_{i=1}^{k^{\prime}} X_{in} ^{(J)} =n^{\prime}\Biggr), \end{equation*}
where
 $k^{\prime}=k- m_+$
,
 $n^{\prime}=n- m_{++}$
and
 $\bigl(X_{in} ^{(J)} \bigr)_{1\le i\le k^{\prime}}$
are i.i.d. with
 \begin{equation}\mathbf{P}\bigl(X_{1n} ^{(J)} =j\bigr) =p_{jn},\quad J+1\le j\le n.\end{equation}
So we can write, from (44),
 \begin{align}&\mathbf{P}(M_{jn}(\theta)=m_j, 1\le j\le J,\, K_n(\theta)=k) \notag \\ &\quad = \dfrac{\Gamma(n)\Gamma(\theta)\theta^{k^{\prime}}}{\Gamma(n+\theta)k^{\prime}!} \Biggl(\sum_{\ell=J+1}^n\dfrac{1}{\ell}\Biggr)^{k^{\prime}}\prod_{j=1}^J\dfrac{1}{m_j!}\biggl(\dfrac{\theta}{j}\biggr)^{m_j}n\mathbf{P}\Biggl(\sum_{i=1}^{k^{\prime}} X_{in} ^{(J)} =n^{\prime}\Biggr).\end{align}
Then, for
 $c\in \Bbb{R}$
,
 \begin{align}& \mathbf{P}\biggl(M_{jn}(\theta)=m_j, 1\le j\le J,\dfrac{K_n(\theta)-\theta \log n}{\sqrt{\theta\log n}} \le c\biggr) \notag\\ &\quad = \int_{z\le \theta \log n +c\sqrt{\theta\log n}} \mathbf{P}(M_{jn}(\theta)=m_j, 1\le j\le J, K_n(\theta)=\lfloor z\rfloor) \,\mathrm{d} z \notag \\ &\quad =\sqrt{\theta\log n} \int_{x\le c} \mathbf{P}\big(M_{jn}(\theta)=m_j,\, 1\le j\le J, K_n(\theta)=\lfloor \theta \log n +x\sqrt{\theta\log n}\rfloor\big) \,\mathrm{d} x.\end{align}
Let
 $k_n(x)= \lfloor \theta \log n +x\sqrt{\theta\log n}\rfloor$
and calculate
 \begin{align*}& \sqrt{\theta\log n} \mathbf{P}(M_{jn}(\theta)=m_j, 1\le j\le J, K_n(\theta)=k_n(x))\\ &\quad = \sqrt{\theta\log n}\times \text{right-hand side of (47) with $ k=k_n(x)$.}\end{align*}
We let
 $n\to\infty$
in this. Consider the various factors. First,
 \begin{equation} \dfrac{\Gamma(n)\Gamma(\theta)}{\Gamma(n+\theta)}\sim \dfrac{\Gamma(\theta)}{n^\theta}.\end{equation}
Next, using a standard asymptotic for the harmonic series,
 \begin{align} \Biggl(\sum_{\ell=J+1}^n\dfrac{1}{\ell}\Biggr)^{k- m_+} & = \Biggl(\sum_{\ell=1}^n\dfrac{1}{\ell} -\sum_{j=1}^J \dfrac{1}{j} \Biggr)^{k- m_+} \notag \\ & = \Biggl(\log n +\gamma- \sum_{j=1}^J \dfrac{1}{j}+{\mathrm{O}}(1/n)\Biggr) ^{k-m_+} \notag \\ & =(\log n) ^{k- m_+} \Biggl(1+ \dfrac{\gamma -\sum_{j=1}^J 1/j+{\mathrm{O}}(1/n)}{\log n}\Biggr)^{k- m_+} \notag \\ & \sim (\log n) ^{k- m_+} \,{\mathrm{e}}^{\theta\gamma-\theta\sum_{j=1}^J 1/j}, \quad \text{as $ k=k_n(x)\to\infty$.}\end{align}
Here
 $\gamma=0.577 \ldots$
is Euler’s constant and we recall
 $k_n(x)= \lfloor \theta \log n +x\sqrt{\theta\log n}\rfloor $
.
Substitute (49) and (50) in (47), remembering the factor of
 $\sqrt{\theta \log n}$
from (48), to get (47) asymptotic to
 \begin{equation}\dfrac{ \sqrt{\theta\log n}}{n^\theta}\dfrac{(\theta\log n)^{k^{\prime}} }{k^{\prime}!}\times{\mathrm{e}}^{\theta\gamma}\Gamma(\theta)\times\prod_{j=1}^J\dfrac{1}{m_j!}\biggl(\dfrac{\theta}{j}\biggr)^{m_j}\,{\mathrm{e}}^{-\theta/j}\times n\mathbf{P}\Biggl(\sum_{i=1}^{k^{\prime}} X_{in} ^{(J)} =n^{\prime}\Biggr).\end{equation}
Using Stirling’s formula and the relations
 $k^{\prime}=k-m_+=k- \sum_{j=1}^J m_j$
and
 $k=k_n(x)= \lfloor \theta \log n +x\sqrt{\theta\log n}\rfloor $
, we find that
 \begin{align}\dfrac{ \sqrt{\theta\log n}}{n^\theta}\dfrac{(\theta\log n)^{k^{\prime}}}{k^{\prime}!}& \sim\dfrac{ \sqrt{\theta\log n}}{n^\theta}\dfrac{(\theta\log n)^{k^{\prime}}}{\sqrt{2\pi k^{\prime}}\, (k^{\prime})^{k^{\prime}}\, {\mathrm{e}}^{-k^{\prime}}} \notag \\ & \sim \dfrac{{\mathrm{e}}^{k^{\prime}}}{\sqrt{2\pi} n^\theta} \biggl(\dfrac{\theta\log n}{k^{\prime}}\biggr)^{k^{\prime}}\notag \\& = \dfrac{{\mathrm{e}}^{k^{\prime}}}{\sqrt{2\pi} n^\theta} \biggl(1- \dfrac{k^{\prime}-\theta\log n}{k^{\prime}}\biggr)^{k^{\prime}} \notag \\ & = \dfrac{{\mathrm{e}}^{k^{\prime}}}{\sqrt{2\pi} n^\theta} \exp\biggl(k^{\prime}\log\biggl(1- \dfrac{k^{\prime}-\theta\log n}{k^{\prime}}\biggr)\biggr).\end{align}
Note that
 \begin{equation*}\dfrac{k^{\prime}- \theta \log n}{k^{\prime}}= \dfrac{\lfloor \theta \log n +x\sqrt{\theta\log n}\rfloor- m_+-\theta\log n}{k^{\prime}}=\dfrac{x\sqrt{\theta\log n}+{\mathrm{O}}(1)}{k^{\prime}}\end{equation*}
is
 ${\mathrm{O}}(1/\sqrt{\log n})\to 0$
as
 $n\to\infty$
, so we can use the expansion
 $\log (1-z)=-z-z^2/2-\ldots$
for small z to get, for the right-hand side of (52),
 \begin{align*} & \dfrac{{\mathrm{e}}^{k^{\prime}}}{\sqrt{2\pi} n^\theta}\exp\biggl(k^{\prime}\biggl({-}\dfrac{k^{\prime}-\theta\log n}{k^{\prime}}-\dfrac{1}{2} \biggl(\dfrac{k^{\prime}-\theta\log n}{k^{\prime}}\biggr)^2\biggr)\biggr) +{\mathrm{O}}\biggl(\dfrac{1}{\log n}\biggr)^{3/2}\\ &\quad = \dfrac{1}{\sqrt{2\pi}} \exp\biggl({-}\dfrac{1}{2} \dfrac{ \big(x\sqrt{\theta\log n}+{\mathrm{O}}(1)\big)^2}{ \theta \log n +x\sqrt{\theta\log n}} \biggr) +{\mathrm{O}}\biggl(\dfrac{1}{\log n}\biggr)^{1/2}\notag \\ & \quad \to \dfrac{1}{\sqrt{2\pi}} \,{\mathrm{e}}^{-x^2/2}. \end{align*}
Thus (51) is asymptotic to
 \begin{equation}\prod_{j=1}^J\dfrac{1}{m_j!}\biggl(\dfrac{\theta}{j}\biggr)^{m_j}\,{\mathrm{e}}^{-\theta/j}\times \dfrac{1}{\sqrt{2\pi}} \,{\mathrm{e}}^{-x^2/2}\times {\mathrm{e}}^{\theta\gamma}\Gamma(\theta)\times n\mathbf{P}\Biggl(\sum_{i=1}^{k^{\prime}} X_{in}^{(J)}=n^{\prime}\Biggr). \end{equation}
It remains to deal with the
 $ X_{in} ^{(J)} $
term in (53). We need a version of a local limit theorem for a sum of i.i.d. random variables; this kind of usage has arisen before in various analyses of Poisson–Dirichlet processes [Reference Arratia, Barbour and Tavaré2, Reference Pitman42]. Use the Fourier inversion formula for the mass function of a discrete random variable (Gnedenko and Kolmogorov [Reference Gnedenko and Kolmogorov15, p. 233]) to write
 \begin{align} n\mathbf{P}\Biggl(\sum_{i=1}^{k^{\prime}} X_{in} ^{(J)} =n^{\prime}\Biggr) &= \dfrac{n}{2\pi} \int_{-\pi}^{\pi} \,{\mathrm{e}}^{-n^{\prime} \textrm{i} \nu}( \phi_{n}(\nu)) ^{ k^{\prime}} \,\mathrm{d} \nu \notag \\ &= \dfrac{n}{2\pi n^{\prime}} \int_{-n^{\prime}\pi}^{n^{\prime}\pi} \,{\mathrm{e}}^{-\textrm{i} \nu}\big( \mathbf{E}\big({\mathrm{e}}^{\textrm{i}\nu X_{1n}/n^{\prime}} \big) \big)^{ k^{\prime}} \,\mathrm{d} \nu, \end{align}
where
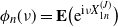 $ \phi_{n}(\nu)= \mathbf{E}\bigl({\mathrm{e}}^{\textrm{i}\nu X_{1n} ^{(J)} }\bigr)$
,
 $\nu\in\Bbb{R}$
. By (45) and (46),

in which
 \begin{align*}\dfrac{\sum_{j=J+1}^n \big({\mathrm{e}}^{\textrm{i}\nu j/n^{\prime}}-1\big)/j}{\sum_{\ell=J+1}^n/\ell}&=\dfrac{\bigl(\sum_{j=1}^n-\sum_{j=1}^J\bigr) \big({\mathrm{e}}^{\textrm{i}\nu j/n^{\prime}}-1\big)/j}{\bigl(\sum_{\ell=1}^n-\sum_{\ell=1}^J \bigr)1/\ell}\\ & =\dfrac{\sum_{j=1}^n \big({\mathrm{e}}^{\textrm{i}\nu j/n^{\prime}}-1\big)/j}{\log n+{\mathrm{O}}(1)}+ {\mathrm{O}}\biggl(\dfrac{1}{n\log n}\biggr). \end{align*}
The numerator here is
 \begin{align*}\sum_{j=1}^n\dfrac{1}{j}\big({\mathrm{e}}^{\textrm{i}\nu j/n^{\prime}}-1\big)& =\sum_{j=1}^n \dfrac{\textrm{i} \nu}{n^{\prime}}\int_0^1\,{\mathrm{e}}^{\textrm{i}\nu zj/n^{\prime}}\,\mathrm{d} z\\ &=\dfrac{\textrm{i} \nu}{n^{\prime}}\int_0^1\sum_{j=0}^n\,{\mathrm{e}}^{\textrm{i}\nu zj/n^{\prime}}\,\mathrm{d} z-\dfrac{\textrm{i} \nu}{n^{\prime}}\\& =\dfrac{\textrm{i} \nu}{n^{\prime}}\int_0^1 \dfrac{{\mathrm{e}}^{\textrm{i}\nu z(n+1)/n^{\prime}}-1}{{\mathrm{e}}^{\textrm{i}\nu z/n^{\prime}}-1}\,\mathrm{d} z +{\mathrm{O}}\biggl(\dfrac{1}{n}\biggr)\\& =\textrm{i} \nu\int_0^1 \dfrac{{\mathrm{e}}^{\textrm{i}\nu z(n+1)/n^{\prime}}-1}{\textrm{i}\nu z+{\mathrm{O}}(1/n)}\,\mathrm{d} z +{\mathrm{O}}\biggl(\dfrac{1}{n}\biggr)\\ & =\int_0^1 \bigl({\mathrm{e}}^{\textrm{i}\nu z}-1\bigr)\dfrac{\mathrm{d} z}{z}+{\mathrm{O}}\biggl(\dfrac{1}{n}\biggr),\end{align*}
and consequently

The last expression has limit
 $\exp(\theta \int_0^1 ({\mathrm{e}}^{\textrm{i}\nu z}-1)\,\mathrm{d} z/z)$
so it follows that
 \begin{equation*}\lim_{n\to\infty}\bigl(\mathbf{E} \,{\mathrm{e}}^{\textrm{i}\nu X_{1n} ^{(J)} /n^{\prime}} \bigr)^{k^{\prime}} ={\mathrm{e}}^{\theta \int_0^1 ({\mathrm{e}}^{\textrm{i}\nu z}-1)\,\mathrm{d} z/z} = \widehat w_\theta(\nu),\end{equation*}
in the notation of Hensley [Reference Hensley22] (his equations (2.6) and (2.12) with
 $\alpha=\theta$
and
 $K(\alpha)=1)$
. Hensley’s function
 $\widehat w_\theta(\nu)$
is the characteristic function of a density
 $w_\theta(u)$
, so taking the limit in (54) gives
 \begin{equation*}\dfrac{1}{2\pi} \int_{-\infty}^{\infty} \,{\mathrm{e}}^{-\textrm{i}\nu}\widehat w_\theta(\nu)\,\mathrm{d} \nu =w_\theta(1).\end{equation*}
(Justification for taking the limit through the integral in (54) can be given by using the kind of arguments in (29)–(30).) By [Reference Hensley22, eq. (2.1)],
 $w_\theta(1) = {\mathrm{e}}^{-\theta\gamma}/\Gamma(\theta)$
. We conclude that
 \begin{equation*}\lim_{n\to\infty}n\mathbf{P}\Biggl(\sum_{i=1}^{k^{\prime}} X_{in} ^{(J)} =n^{\prime}\Biggr)= {\mathrm{e}}^{-\theta\gamma}/\Gamma(\theta).\end{equation*}
Substituting this in (53) gives (43); in fact we get density convergence in (43), which is stronger.
6. Other limits
In this section we derive other limits of the processes studied above. Section 6.1 analyses
 $\mathrm{\mathbf{PD}} _\alpha^{(r)}$
as
 $r\downarrow 0$
or
 $r\to\infty$
. Section 6.2 summarises the results in a convergence diagram for
 $\mathbf{M}_n(\alpha,r)$
, showing that the convergences
 $n\to\infty$
and
 $r \downarrow 0$
commute.
6.1. Limiting behaviour of
$\mathrm{\mathbf{PD}} _\alpha^{(r)}$
as
$r\downarrow 0$
or
$r\to\infty$


Kingman’s
 $\mathrm{\mathbf{PD}} (\alpha, 0)$
distribution arises by taking the ordered jumps,
 $(\Delta S_1^{(i)})_{i\ge 1}$
, up to time 1, of a driftless
 $\alpha$
-stable subordinator
 $S=(S_t)_{t>0}$
, normalised by their sum
 $S_1$
, as a random distribution on the infinite simplex
 $\nabla_{\infty}$
. A natural generalisation is to delete the r largest jumps (
 $r\ge 1$
an integer) up to time 1 of S, and consider the vector whose components are the remaining jumps
 $(\Delta S_1^{(i)})_{i\ge r+1}$
normalised by their sum. Again we obtain a random distribution on
 $\nabla_{\infty}$
, now with an extra parameter, r. This is the
 $\mathrm{\mathbf{PD}} _\alpha^{(r)}$
distribution of Ipsen and Maller [Reference Ipsen and Maller23]. Some limiting and other properties of it were studied in [Reference Ipsen, Maller and Shemehsavar24], where it was extended to all
 $r>0$
, not just integer r, and in Chegini and Zarepour [Reference Chegini and Zarepour6]. Zhang and Dassios [Reference Zhang and Dassios46] also consider an
 $\alpha$
-stable subordinator with largest jumps removed for simulating functionals of a Pitman–Yor process.
By its construction,
 $\mathrm{\mathbf{PD}} _\alpha^{(r)}$
reduces to
 $\mathrm{\mathbf{PD}} (\alpha,0)$
when r is set equal to 0, but Theorem 5 shows a kind of continuity property: as
 $r\downarrow 0$
the distribution of
 $(\mathbf{M}_n(\alpha,r), K_n(\alpha,r))$
from
 $\mathrm{\mathbf{PD}} _\alpha^{(r)}$
converges to the corresponding quantity from
 $\mathrm{\mathbf{PD}} (\alpha,0)$
; a useful result for statistical analysis, where we might fit the
 $\mathrm{\mathbf{PD}} _\alpha^{(r)}$
model with general
 $\alpha$
and r to data, and test
 $H_0\colon r=0$
, i.e. whether r is needed in the model to describe the data. The parameter r models ‘over-dispersion’ in the data [Reference Chegini and Zarepour6].
In this subsection we keep n and
 $\alpha$
fixed and let
 $r\downarrow 0$
or
 $r\to\infty$
. Part (i) of the next theorem is an analogue of the Pitman and Yor result [Reference Pitman and Yor43, p. 880] that, for each
 $\theta>0$
, the limit of
 $\mathrm{\mathbf{PD}} (\alpha,\theta)$
as
 $\alpha\downarrow 0$
is
 $\mathrm{\mathbf{PD}} (\theta)$
.
Theorem 5. We have the following limiting behaviour for
 $\mathrm{\mathbf{PD}} _\alpha^{(r)}$
.
-
(i) As
$r\downarrow 0$
, the limit of
$\mathbf{P}(\mathbf{M}_n(\alpha,r)=\mathbf{m},\, K_n(\alpha,r)=k)$
is the probability in (3), i.e. the distribution of
$(\mathbf{M}_n(\alpha), K_n(\alpha))$
. -
(ii) In the limit as
$r\to \infty$
, a sample from
$\mathrm{\mathbf{PD}} _\alpha^{(r)}$
is of n alleles each with 1 representative, i.e. the singleton distribution with mass
$ \mathbf{1}_{(\mathbf{m},k)=((n,0,\ldots,0_n), n)}$
.





Proof of Theorem
5. For this proof it is convenient to work from a formula for
 $\mathrm{\mathbf{PD}} _\alpha^{(r)}$
derived from equations (2.1) and (3.7) of [Reference Ipsen, Maller and Shemehsavar26]. For
 $ \mathbf{m}\in A_{kn}$
(see (1)) and
 $k \in \Bbb{N}_n$
,
 \begin{align}&\mathbf{P}(\mathbf{M}_n(\alpha,r)=\mathbf{m},\, K_n(\alpha,r)=k) \notag \\ &\quad =n \int_{0}^{\infty}\ell_n(\lambda)^k \mathbf{P}(\mathrm{\mathbf{Mult}} (0,k,n,\mathbf{p}_n(\lambda))= \mathbf{m})\mathbf{P}\biggl( \mathrm{Negbin}\biggl(r, \dfrac{1}{\Psi(\lambda)}\biggr) =k\biggr)\dfrac{\mathrm{d} \lambda}{\lambda}, \quad \end{align}
where the multinomial notation is as in (8) with
 \begin{equation}\mathbf{p}_n(\lambda)= (p_{jn}(\lambda))_{j\in\Bbb{N}_n} =\biggl(\dfrac{F_j(\lambda)}{\sum_{\ell=1}^n F_\ell(\lambda)}\biggr)_{j\in\Bbb{N}_n},\end{equation}
and
 $F_j(\lambda)$
is as in (7). The function
 $\ell_n(\lambda)$
is defined in [Reference Ipsen, Maller and Shemehsavar26, eq. (3.6)] as
 \begin{equation}\ell_n(\lambda)\,:\!=\,\dfrac{\Psi_n(\lambda)-1}{\Psi(\lambda)-1}=\dfrac{ \int_0^\lambda\sum_{j=1}^n (z^j/j!) z^{-\alpha-1}\,{\mathrm{e}}^{-z}\,\mathrm{d} z}{\int_0^\lambda z^{-\alpha-1}(1-{\mathrm{e}}^{-z})\,\mathrm{d} z}\le 1,\end{equation}
where
 $\Psi(\lambda)$
is as in (6). Finally, in (55),
 $ \mathrm{Negbin}(r, 1/\Psi(\lambda))$
is a negative binomial random variable with parameter
 $r>0$
and success probability
 $1/\Psi(\lambda)$
, thus
 \begin{equation}\mathbf{P}\biggl( \mathrm{Negbin}\biggl(r, \dfrac{1}{\Psi(\lambda )}\biggr) =k \biggr)=\dfrac{\Gamma(r+ k)}{\Gamma(r)k!}\biggl( 1- \dfrac{1}{\Psi(\lambda )}\biggr)^{k}\biggl(\dfrac{1}{\Psi(\lambda) }\biggr)^r,\quad k\in \Bbb{N}_n.\end{equation}
(i) Observe, by (6), for all
 $\lambda>0$
,
 \begin{equation}1\vee \lambda^\alpha\int_{0}^{\lambda}\,{\mathrm{e}}^{-z}z^{-\alpha} \,\mathrm{d} z\le\Psi(\lambda)=1+\alpha\lambda^\alpha \int_{0}^\lambda(1-{\mathrm{e}}^{-z})z^{-\alpha-1} \,\mathrm{d} z\le 1+\lambda^\alpha\Gamma(1-\alpha),\end{equation}
so (recalling that
 $\Psi(\lambda)>1$
)
 \begin{equation}\mathbf{P}\biggl( \mathrm{Negbin}\biggl(r, \dfrac{1}{\Psi(\lambda )}\biggr) =k\biggr)=\dfrac{\Gamma(r+ k)}{\Gamma(r) k!}\dfrac{(\Psi(\lambda )-1)^k }{\Psi(\lambda )^{k+r}}\le\dfrac{\Gamma(r+ k)\Gamma^k(1-\alpha)}{\Gamma(r) k!} \lambda^{k\alpha}.\end{equation}
Fix
 $A>0$
. Using (60) and
 $\ell_n(\lambda)\le 1$
, the component of the integral over (0, A) in (55) does not exceed
 \begin{equation*} n\int_0^A \dfrac{\Gamma(r+ k)\Gamma^k(1-\alpha)}{\Gamma(r) k!}\lambda^{k\alpha-1} \,\mathrm{d} \lambda = \dfrac{n\Gamma(r+ k)\Gamma^k(1-\alpha)}{\Gamma(r) k!} \times \dfrac{A^{k\alpha} }{k\alpha},\end{equation*}
and this tends to 0 as
 $r\downarrow 0$
since then
 $\Gamma(r)\to\infty$
.
For the component of the integral over
 $(A,\infty)$
in (55), change variable to
 $\lambda=\lambda/r$
and write it as
 \begin{equation}n \int_{Ar}^{\infty}\ell_n(\lambda/r)^k \mathbf{P}(\mathrm{\mathbf{Mult}} (0,k,n,\mathbf{p}_n(\lambda/r))= \mathbf{m})\mathbf{P}\biggl( \mathrm{Negbin}\biggl(r, \dfrac{1}{\Psi(\lambda/r)}\biggr) =k\biggr) \, \dfrac{\mathrm{d} \lambda}{\lambda}.\end{equation}
 \begin{equation*}\lim_{\lambda\to\infty} \ell_n(\lambda)\,=\!:\,\ell_n^\infty =\dfrac{\alpha}{\Gamma(1-\alpha)}\sum_{j=1}^n \dfrac{\Gamma(j-\alpha)} {j!}\end{equation*}
and

so that, as
 $\lambda\to\infty$
,
 \begin{equation}(\ell_n(\lambda))^k \mathbf{P}(\mathrm{\mathbf{Mult}} (0,k,n,\mathbf{p}_n(\lambda))= \mathbf{m}) \to k! \biggl(\dfrac{\alpha}{\Gamma(1-\alpha)}\biggr)^k\prod_{j=1}^n \dfrac{1}{m_j!} \biggl(\dfrac{\Gamma(j-\alpha)}{j!}\biggr)^{m_j}.\end{equation}
Given
 $\varepsilon>0$
, choose
 $A=A(\varepsilon)$
large enough for the left-hand side of (62) to be within
 $\varepsilon$
of the right-hand side when
 $\lambda>A$
. Note that, by (59), when
 $\lambda/r>A$
,
 \begin{equation*}\Psi(\lambda/r)\ge(\lambda/r)^\alpha\int_{0}^{\lambda/r}\,{\mathrm{e}}^{-z}z^{-\alpha} \,\mathrm{d} z\ge(\lambda/r)^\alpha\int_{0}^{A}\,{\mathrm{e}}^{-z}z^{-\alpha} \,\mathrm{d} z\,=\!:\, c_{\alpha,A}(\lambda/r)^\alpha.\end{equation*}
So, using (58), an upper bound for the integral in (61) is, for
 $r<1$
,
 \begin{align}& \dfrac{n} {c_{\alpha,A}^r} \int_{Ar}^{\infty}\biggl( k! \biggl(\dfrac{\alpha}{\Gamma(1-\alpha)}\biggr)^k\prod_{j=1}^n \dfrac{1}{m_j!} \biggl(\dfrac{\Gamma(j-\alpha)}{j!}\biggr)^{m_j}+\varepsilon\biggr)\dfrac{\Gamma(r+ k)}{\Gamma(r) k!}\dfrac{r^{\alpha r} \,\mathrm{d} \lambda}{\lambda^{\alpha r +1}} \notag\\ &\quad = \dfrac{n} {c_{\alpha,A}^r}\biggl( k! \biggl(\dfrac{\alpha}{\Gamma(1-\alpha)}\biggr)^k\prod_{j=1}^n \dfrac{1}{m_j!} \biggl(\dfrac{\Gamma(j-\alpha)}{j!}\biggr)^{m_j}+\varepsilon\biggr)\dfrac{\Gamma(r+ k)}{\alpha r\Gamma(r) k!}A^{-\alpha r}.\end{align}
Let
 $r\downarrow 0$
and note that
 $c_{\alpha,A}^r\to 1$
,
 $A^{-\alpha r}\to 1$
,
 $ r\Gamma(r) =\Gamma(r+1) \to 1$
and
 $\Gamma(r+ k)\to \Gamma( k)=(k-1)!$
. Then, letting
 $\varepsilon\downarrow 0$
, we obtain an upper bound for the limit of the integral in (55) equal to the distribution in (3).
For a lower bound, we can discard the component of the integral over (0, A) in (55), then change variables as in (61). For
 $\lambda/r\ge A$
,
 $\Psi(\lambda/r) \le 1+(\lambda/r)^\alpha \Gamma(1-\alpha) =(1+{\mathrm{o}}(1))(\lambda/r)^\alpha \Gamma(1-\alpha)$
as
 $r\downarrow 0$
. So, from (58) and (59),
 \begin{equation*} \mathbf{P}\biggl( \mathrm{Negbin}\biggl(r, \dfrac{1}{\Psi(\lambda/r)}\biggr) =k \biggr)\ge\dfrac{\Gamma(r+ k)}{\Gamma(r) k!}\biggl( 1- \dfrac{1}{\Psi(\lambda/r )}\biggr)^{k}\biggl(\dfrac{1}{(1+{\mathrm{o}}(1))(\lambda/r)^\alpha\Gamma(1-\alpha) }\biggr)^r.\end{equation*}
We also have the limit in (62). Substituting these in (61), we get a lower bound of the same form as in the left-hand side of (63). Fatou’s lemma can then be used on the integral to get a lower bound equal to the upper bound derived earlier. Thus we prove part (i).
(ii) In the integral in (55), change variable to
 \begin{equation*} \rho = \biggl(1- \dfrac{1}{\Psi(\lambda)}\biggr) \dfrac{r}{1/\Psi(\lambda)} = r(\Psi(\lambda)-1), \end{equation*}
so that
 \begin{equation*}\dfrac{\mathrm{d} \lambda}{\lambda}=\dfrac{\mathrm{d} \rho}{r\lambda\Psi^{\prime}(\lambda)},\quad \Psi(\lambda)= \dfrac{\rho}{r}+1\quad \text{and}\quad \lambda =\Psi^{\leftarrow}\biggl( \dfrac{\rho}{r}+1\biggr), \end{equation*}
where
 $\Psi^{\leftarrow}$
is the inverse function to
 $\Psi$
. Then
 $r\to\infty$
implies
 $\Psi(\lambda)\to 1$
thus
 $\lambda\to 0$
. From (7), (56), (57), and L’Hôpital’s rule we see that
 \begin{equation*}\lim_{\lambda\to 0}\ell_n(\lambda)=1\quad \textrm{and}\quad \lim_{\lambda\to 0}p_{jn}(\lambda) = p_{jn}(0)=\lim_{\lambda\to 0}\dfrac{1}{j!\sum_{\ell=1}^n \lambda^{\ell-j}/\ell!} = \mathbf{1}_{j=1}.\end{equation*}
After changing variable in (55), we get
 \begin{align}&\mathbf{P}(\mathbf{M}_n(\alpha,r)=\mathbf{m},\, K_n(\alpha,r)=k) \notag \\ &\quad =n \int_{0}^{\infty}\ell_n\biggl(\Psi^{\leftarrow}\biggl( \dfrac{\rho}{r}+1\biggr)\biggr)^k \mathbf{P}\biggl( \mathrm{\mathbf{Mult}} (0,k,n,\mathbf{p}_n \biggl(\Psi^{\leftarrow}\biggl( \dfrac{\rho}{r}+1\biggr)\biggr)= \mathbf{m}\biggr) \notag \\ &\quad \quad \times\mathbf{P}\biggl( \mathrm{Negbin}\biggl(r, \dfrac{r}{r+\rho}\biggr) =k\biggr) \, \dfrac{\mathrm{d} \rho}{r\lambda \Psi^{\prime}(\lambda) }.\end{align}
In this, by (6),
 \[\Psi(\lambda)-1 \sim \alpha \lambda/(1-\alpha)\quad \text{as $\lambda\to 0$,}\]
so
 $r\lambda \sim (1-\alpha)\rho/\alpha$
, and
 \[\Psi^{\prime}(\lambda)= \alpha \int_{0}^1\,{\mathrm{e}}^{-\lambda z}z^{-\alpha} \,\mathrm{d} z \to \alpha/(1-\alpha)\quad \text{as $\lambda\to 0$.} \]
We have
 $\ell_n(\cdot)\le 1$
, and by (60) the negative binomial probability is bounded above by a constant multiple of
 $r^k\lambda^k\asymp \rho^k$
for large r, and as
 $r\to \infty$
we have convergence of the negative binomial to the Poisson. So by dominated convergence the right-hand side of (64) converges to
 \begin{align*}&n \int_{0}^{\infty} \mathbf{P}( \mathrm{\mathbf{Mult}} (0,k,n,\mathbf{p}_n (0))= (1,0,\ldots, 0)) \dfrac{{\mathrm{e}}^{-\rho} \rho^k}{k!} \dfrac{ \mathrm{d} \rho}{\rho }\\ &\quad =\dfrac{n}{k} \mathbf{P}(\mathrm{\mathbf{Mult}} (0,k,n,\mathbf{p}_n(0))= (1,0,\ldots, 0)).\end{align*}
Here
 $\mathrm{\mathbf{Mult}} (0,k,n,\mathbf{p}_n(0))$
is multinomial with
 $\mathbf{p}_n(0)= (p_{jn}(0))_{1\le j\le n}$
, and so the probability equals
 $ \mathbf{1}_{(\mathbf{m},k)=((n,0,\ldots,0_n), n)}$
as required.
Theorem 6. For the
 $\mathrm{\mathbf{PD}} _\alpha^{(r)}$
model we have the property
 \begin{equation*}\lim_{r\downarrow 0} (\textit{right-hand side of}\ (12))=\textit{right-hand side of}\ (41).\end{equation*}
Proof of Theorem 6. From (12) it suffices to consider the integrand
 \begin{equation} \dfrac{x^{r+J/2-1} }{\Gamma(r)\Gamma^r(1-\alpha)} \dfrac{{\mathrm{e}}^{-\frac{x}{2} \mathbf{y}^{{\top}}\mathbf{Q}_J^{-1}\mathbf{y}}}{\sqrt{(2\pi )^J \operatorname{det}(\mathbf{Q}_J)}}\int_{\lambda=0}^\infty\,{\mathrm{e}}^{-x(\lambda^{-\alpha}\vee 1)/\Gamma(1-\alpha)}f_{Y_x(\lambda)}(1)\dfrac{\mathrm{d} \lambda}{ \lambda^{\alpha r+1}},\end{equation}
and for this we look at
 $\int_0^1$
and
 $\int_1^\infty$
separately. Recall that
 $f_{Y_x(\lambda)}(y)$
is uniformly bounded in
 $\lambda$
by C, say. For the first part, make the transformation
 $y=\lambda^{-\alpha}$
, so
 $\lambda=y^{-1/\alpha}$
and
 $\mathrm{d}\lambda=-y^{-1/\alpha-1}\,\mathrm{d} y/\alpha$
. Then
 $\int_0^1$
is bounded by
 \begin{align*}& \dfrac{Cx^{r+J/2-1} }{\Gamma(r)\Gamma^r(1-\alpha)} \dfrac{{\mathrm{e}}^{-\frac{x}{2} \mathbf{y}^{{\top}}\mathbf{Q}_J^{-1}\mathbf{y}}}{\sqrt{(2\pi )^J \operatorname{det}(\mathbf{Q}_J)}}\int_{\lambda=0}^1\,{\mathrm{e}}^{-x(\lambda^{-\alpha}\vee 1)/\Gamma(1-\alpha)}\dfrac{\mathrm{d} \lambda}{ \lambda^{\alpha r+1}} \\ &\quad = \dfrac{Cx^{r+J/2-1} }{\alpha\Gamma(r)\Gamma^r(1-\alpha)} \dfrac{{\mathrm{e}}^{-\frac{x}{2} \mathbf{y}^{{\top}}\mathbf{Q}_J^{-1}\mathbf{y}}}{\sqrt{(2\pi )^J \operatorname{det}(\mathbf{Q}_J)}}\int_{y=1}^\infty\,{\mathrm{e}}^{-xy/\Gamma(1-\alpha)}y^{r-1} \,\mathrm{d} y,\end{align*}
which tends to 0 as
 $r\downarrow 0$
. So we can neglect
 $\int_0^1$
. For
 $\int_1^\infty$
the contribution is
 \begin{align*}& \dfrac{x^{r+J/2-1} }{\Gamma(r)\Gamma^r(1-\alpha)} \dfrac{{\mathrm{e}}^{-\frac{x}{2} \mathbf{y}^{{\top}}\mathbf{Q}_J^{-1}\mathbf{y}}}{\sqrt{(2\pi )^J \operatorname{det}(\mathbf{Q}_J)}}\int_{\lambda=1}^\infty\,{\mathrm{e}}^{-x/\Gamma(1-\alpha)}f_{Y_x(1)}(1)\dfrac{\mathrm{d} \lambda}{ \lambda^{\alpha r+1}} \\ &\quad = \dfrac{x^{r+J/2-1} } {\alpha r\Gamma(r)\Gamma^r(1-\alpha)} \dfrac{{\mathrm{e}}^{-\frac{x}{2} \mathbf{y}^{{\top}}\mathbf{Q}_J^{-1}\mathbf{y}}}{\sqrt{(2\pi )^J \operatorname{det}(\mathbf{Q}_J)}} \,{\mathrm{e}}^{-x/\Gamma(1-\alpha)}f_{Y_x(1)}(1)\\ &\quad \to\dfrac{x^{J/2-1} \,{\mathrm{e}}^{-\frac{x}{2} \mathbf{y}^{{\top}}\mathbf{Q}_J^{-1}\mathbf{y}}}{\alpha\sqrt{(2\pi )^J \operatorname{det}(\mathbf{Q}_J)}} \,{\mathrm{e}}^{-x/\Gamma(1-\alpha)}f_{Y_x(1)}(1),\end{align*}
using
 $\lim_{r\downarrow 0} r\Gamma(r)=\lim_{r\downarrow 0}\Gamma(r+1)=1$
. This equals the integrand on the right-hand side of (41).
Remarks. (i) We can simplify the limit distribution in (12) somewhat by using Corollary 2.1 of [Reference Covo8] as we did in the proof of Theorem 3. Once again in the integral in (65) look at
 $\int_0^1$
and
 $\int_1^\infty$
separately. The component of the integral over
 $(1,\infty)$
can be explicitly evaluated as
 \begin{equation*} \dfrac{1}{\Gamma(r)\Gamma^r(1-\alpha)} x^r f_{L_\alpha}(x). \end{equation*}
The component over (0,1) involves the functions
 $ A_{\lambda:\kappa}^{(1)}$
defined by Covo (see (42)), which can be calculated using a recursion formula he gives; for an alternative approach, see [Reference Perman38].
(ii) Theorem 3.1 of Maller and Shemehsavar [Reference Maller and Shemehsavar35] shows that a sampling model based on the Dickman subordinator has the same limiting behaviour as the Ewens sampling formula. The Dickman function is well known to be closely associated with
 $\mathrm{\mathbf{PD}} (\theta)$
and some of its generalisations; see e.g. Arratia and Baxendale [Reference Arratia and Baxendale1], Arratia et al. [Reference Arratia, Barbour and Tavaré2, pp. 14, 76], Handa [Reference Handa20], and [Reference Ipsen, Maller and Shemehsavar25], [Reference Ipsen, Maller and Shemehsavar26], and [Reference Maller and Shemehsavar35].
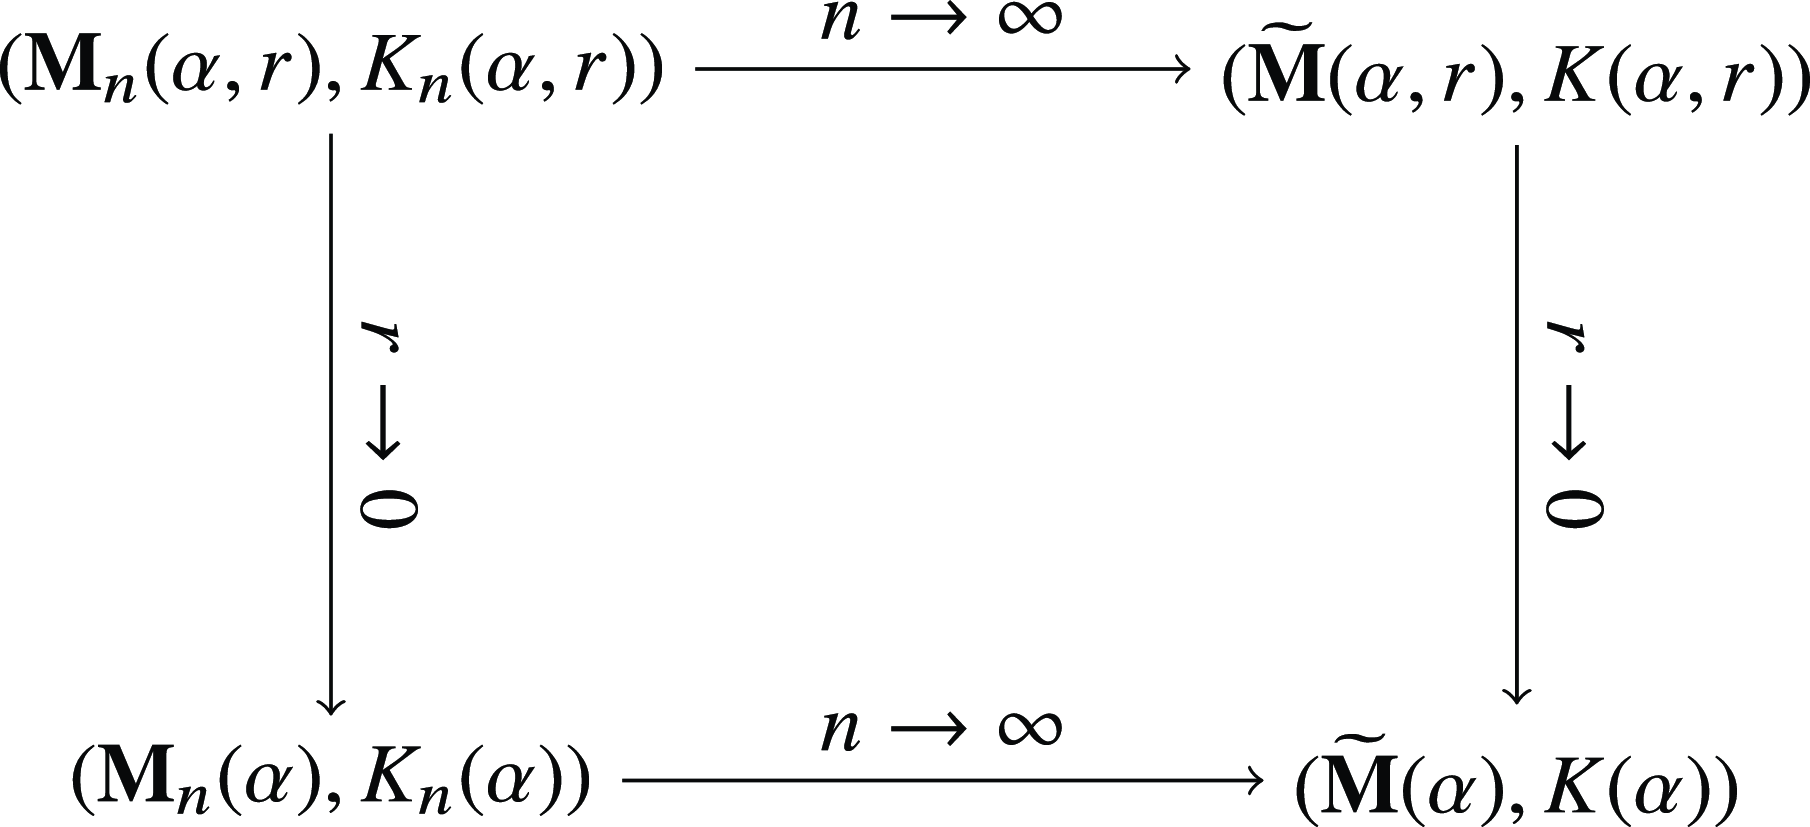
6.2. Convergence diagram for
$\mathrm{\mathbf{PD}} _\alpha^{(r)}$

Using Theorems 1 and 3 we can give the convergence diagram shown in Figure 1. We can also use Theorem 1 to complete the convergence diagram for
 $\mathbf{M}_n(\alpha,r)$
in [Reference Maller and Shemehsavar35]; the missing upper right entry in their Figure 2 is
 $\widetilde{\mathbf{M}}(\alpha,r), K(\alpha,r)$
. Note that
 $r\to\infty$
,
 $\alpha\downarrow 0$
, such that
 $r\alpha\to a>0$
, in [Reference Maller and Shemehsavar35].
Convergence diagram for
 $\mathrm{\mathbf{PD}} _\alpha^{(r)}$
. Arrows denote convergence in distribution. Upper left to upper right is proved in Theorem 1;
 $(\widetilde{\mathbf{M}}(\alpha,r), K(\alpha,r))$
has the distribution on the right-hand side of (12). Upper left to lower left is proved in Theorem 5(i). For upper right to lower right, the convergence is proved in Theorem 6. Lower left to lower right is proved in Theorem 3, with
 $(\widetilde{\mathbf{M}}(\alpha),K(\alpha))$
denoting a random variable with the Normal-Mittag–Leffler mixture distribution on the right-hand side of (41). The diagram is schematic only: the random variables have to be normed and centred in certain ways before convergence takes place.

We also have the following useful results, which follow immediately from Theorems 1 and 3.
Corollary 2. We have
 $\sqrt{ K(\alpha,r)}\widetilde{\mathbf{M}}(\alpha,r) \stackrel{\mathrm{D}}{=} N(\bf0,\mathbf{Q}_J)$
, independent of
 $K(\alpha,r)$
, and similarly
 $\sqrt{ K(\alpha)}\widetilde{\mathbf{M}}(\alpha) \stackrel{\mathrm{D}}{=} N(\bf0,\mathbf{Q}_J)$
, independent of
 $K(\alpha)$
.
7. Discussion
The methods developed in Sections 3–6 offer a unified approach with nice interpretations to limit theorems of various sorts for Poisson–Dirichlet models, and we expect they can be applied in other situations too. For example, Grote and Speed [Reference Grote and Speed19] analyse a ‘general selection model’ based on the infinite alleles mutation scheme. Their formula (1.13) gives a version of the distribution of
 $(\mathbf{M}_n, K_n)$
amenable to analysis by our methods. Ruggiero et al. [Reference Ruggiero, Walker and Favaro44, eqs (3.1), (3.2)]) analyse a species sampling model based on normalised inverse-Gaussian diffusions as a generalisation of
 $\mathrm{\mathbf{PD}} (\alpha,0)$
; an extra parameter
 $\beta$
is introduced to the
 $\mathrm{\mathbf{PD}} (\alpha,0)$
model, somewhat analogous to our
 $\mathrm{\mathbf{PD}} _\alpha^{(r)}$
. See also Lijoi et al. [Reference Lijoi, Mena and Prunster34] and Favaro and Feng [Reference Favaro and Feng11].
Formula (5) can be compared with an analogous formula, equation (4.14) of Pitman [Reference Pitman42, p. 81], in which the component
 $\prod_{i=1}^k \Psi^{(n_i)}(\lambda)$
can be replaced by
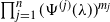 $\prod_{j=1}^n (\Psi^{(j)}(\lambda))^{m_j}$
using the identity
 $m_j =\sum_{i=1}^k 1_{\{j=n_i\}}$
. See also Pitman [Reference Pitman41] and the Gibbs partitions in [Reference Pitman42, pp. 25–26, eq. (1.52)]. Hansen [Reference Hansen21] gave a general treatment of decomposable combinatorial structures having a Poisson–Dirichlet limit.
There are many other limiting results in the literature. Joyce et al. [Reference Joyce, Krone and Kurtz29] prove a variety of Gaussian limit theorems as the mutation rate
 $\theta\to \infty$
in the
 $\mathrm{\mathbf{PD}} (\theta)$
model; see also Griffiths [Reference Griffiths17] and Handa [Reference Handa20]. Feng [Reference Feng12, Reference Feng13] gives large deviation results as
 $\theta\to\infty$
. James [Reference James28] gives results like this related to
 $\mathrm{\mathbf{PD}} (\alpha,\theta)$
in a Bayesian set-up. Dolera and Favaro [Reference Dolera and Favaro9] investigate
 $\alpha$
-diversity in
 $\mathrm{\mathbf{PD}} (\alpha,\theta)$
. Berestycki et al. [Reference Basdevant and Goldschmidt3] prove laws of large numbers for the AFS when the coalescent process is taken to be the Bolthausen–Sznitman coalescent. Möhle [Reference Möhle37] introduces a Mittag–Leffler process and shows that the block counting process of the Bolthausen–Sznitman n-coalescent, properly scaled, converges to it in the Skorokhod topology. See also Freund and and Möhle [Reference Freund14]. Relevant to our Theorem 2, Koriyama, Matsuda, and Komaki [Reference Koriyama, Matsuda and Komaki33] derive the asymptotic distribution of the maximum likelihood estimator of
 $(\alpha,\theta)$
for the
 $\mathrm{\mathbf{PD}} (\alpha,\theta)$
model and show that
 $\alpha_n$
is
 $n^{\alpha/2}$
consistent for
 $\alpha$
.
When
 $r \to \infty$
, size-biased samples from
 $\mathrm{\mathbf{PD}} _\alpha^{(r)}$
tend to those of
 $\mathrm{\mathbf{PD}} (1 - \alpha )$
, i.e. to
 $\mathrm{\mathbf{PD}} (\theta)$
with
 $\theta = 1- \alpha $
; see [Reference Ipsen, Maller and Shemehsavar24]. Together with part (i) of Theorem 5, this suggests that
 $\mathrm{\mathbf{PD}} _\alpha^{(r)}$
is intermediate in a sense between
 $\mathrm{\mathbf{PD}} (\alpha,0)$
and
 $\mathrm{\mathbf{PD}} (\theta)$
. Chegini and Zarepour [Reference Chegini and Zarepour6] show that
 $\mathrm{\mathbf{PD}} _\alpha^{(r)}$
can alternatively be obtained as the ordered normalised jumps of a negative binomial process, as defined in Gregoire [Reference Gregoire16]. When
 $r \to \infty$
,
 $\alpha \to 0$
such that
 $r \alpha \to a > 0$
, a limit involving the Dickman subordinator is obtained; see [Reference Maller and Shemehsavar35].
The AFS is alternatively known as the site frequency spectrum (SFS). It summarises the distribution of allele frequencies throughout the genome. According to Mas-Sandoval et al. [Reference Mas-Sandoval, Pope, Nielsen, Altinkaya, Fumagalli and Korneliussen36, p. 2]:
The SFS is arguably one of the most important summary statistics of population genetic data
 $\ldots$
contain[ing] invaluable information on the demographic and adaptive processes that shaped the evolution of the population under investigation
 $\ldots$
For instance, an SFS showing an overrepresentation of rare alleles is an indication of an expanding population, while bottleneck events tend to deplete low-frequency variants.
The appearance of the normal as the limiting distribution of
 $\mathbf{M}_n$
, after centering and norming, conditional on
 $K_n$
, for
 $\mathrm{\mathbf{PD}} _\alpha^{(r)}$
,
 $\mathrm{\mathbf{PD}} (\alpha,0)$
and
 $\mathrm{\mathbf{PD}} (\alpha,\theta)$
, is useful for statistical applications. In Ipsen et al. [Reference Ipsen, Shemehsavar and Maller27] we used a least-squares method to fit
 $\mathrm{\mathbf{PD}} _\alpha^{(r)}$
to a variety of data sets, some quite small. Even so, we observed by simulations that the finite sample distributions of the estimates of
 $\alpha$
and r were quite closely approximated by the normal. The asymptotic normality derived in the present paper provides a rationale for using least-squares and helps explain the approximate normality of the parameter estimates. Similar ideas may be useful for
 $\mathrm{\mathbf{PD}} (\alpha,\theta)$
. Cereda and Corradi [Reference Cereda and Corradi5] give a methodology for fitting that model to forensic data. Keith et al. [Reference Keith, Brooks, Lewontin, Martinez-Cruzado and Rigby30] give an example of testing differences between similar allelic distributions using the AFS. Functionals of
 $\mathbf{M}_n$
such as
 $\sum_{j=1}^n (M_{jn}- EM_{jn})^2/EM_{jn}$
are important in many aspects of population genetics; see e.g. the measures of sample diversity given by Watterson [Reference Watterson45, Section 4].
Acknowledgements
We are grateful to the Editors and a referee for suggestions which led to simplifications and a significant improvement in the exposition.
Funding information
There are no funding bodies to thank relating to the creation of this article.
Competing interests
There were no competing interests to declare which arose during the preparation or publication process of this article.
Supplementary material
The supplementary material for this article can be found at https://doi.org/10.1017/jpr.2024.84.