Adult native (L1) speakers differ with respect to communicative success when they speak. Some speak slowly, others fast; some articulate poorly, others well; the speech of some is characterized by a high incidence of short utterances, false starts, and self corrections, and the speech of others is characterized by long and flawless utterances (Levelt, Reference Levelt1989). Such differences are also likely to show up in the speech of second language (L2) speakers. Compared to L1 speakers, however, L2 speakers encounter more problems in finding the right words, in giving their utterances the correct morphosyntactic form, and in articulating their utterances correctly and fluently (Kormos, Reference Kormos2006; Poulisse, Reference Poulisse1999). This study aims to explore the componential structure of speaking proficiency of L2 learners at intermediate and advanced levels of L2 proficiency. In other words, this study is concerned with a fundamental issue, which has to be addressed prior to any practical matters, such as the assessment of L2 learners’ proficiency (Schoonen, Reference Schoonen and Hinkel2011). Previous research on the components of L2 speaking proficiency and the rationale of the current study is presented in the next two sections.
Previous Research Investigating Components of L2 Speaking Proficiency
There have been several studies that aimed to unravel the componential structure of L2 speaking proficiency. Two general approaches can broadly be distinguished, labeled here as the subjective-subjective and the subjective-objective approach. In the subjective-subjective approach, global ratings of speaking performances are related to ratings of specific features of the same speaking performances, such as fluency, lexical richness, and grammatical accuracy. In the subjective-objective approach, global ratings of speaking performances are related to objective measurements of lexical, grammatical, and fluency features of the same performances.
One of the first studies adopting the subjective-subjective approach was conducted by Adams (Reference Adams and Frith1980). In this study, 834 participants performed the Foreign Service Institute (FSI) oral interview test. FSI testers rated both overall global proficiency and a number of subskills (accent, comprehension, fluency, grammar, and vocabulary). Adams used discriminant analyses to investigate which subskills contributed mostly to the different levels of global proficiency. The main factors found to discriminate between the levels were vocabulary and grammar, whereas accent and fluency discriminated the least. Adams concluded that, at different levels, raters are sensitive to different aspects of performance. As Fulcher (Reference Fulcher2003) observed, however, no clear pattern of discrimination was found in Adams’s study, which makes it difficult to theoretically link the discriminating factors to specific levels of the FSI descriptors.
Higgs and Clifford (Reference Higgs, Clifford and Higgs1982) also used the subjective-subjective approach, in an attempt to find evidence for their relative contribution model, which posits a fluctuating relative importance of subskill factors contributing to global language proficiency. Fifty foreign-language teachers rated what they perceived to be the relative contribution of subskills for each of the six proficiency levels of the FSI rating scale (thus, the teachers did not rate actual L2 learner performances). Across global proficiency ratings, the relative importance of the subskill factors of vocabulary, grammar, pronunciation, fluency, and sociolinguistic ability did indeed vary, with vocabulary being the most important factor at lower levels of proficiency, and with all factors being equally important at the highest level of proficiency.
McNamara (Reference McNamara1990) reported on results of the Occupational English Test (OET) for health professionals. Part of this test is a speaking task in which candidates engage in a role-play situation. Trained raters gave judgments—for performances in two sessions (produced by 214 and 233 candidates)—of overall communicative effectiveness, intelligibility, fluency, comprehension, appropriateness, and resources of grammar and expression. The researcher analyzed the two sessions separately using stepwise regression analysis and found that the rating on overall communicative effectiveness could largely be explained by the variable resources of grammar and expression (68% and 70% of variance explained in the two sessions respectively). The ratings of fluency, intelligibility, appropriateness, and comprehension each explained some added variance, leading to a total of 78% and 84% of variance explained. McNamara concludes that the construct “resources of grammar and expression” played a crucial role in determining the rating of “overall communicative effectiveness” (p. 62).
In what could also be seen as a subjective-subjective study, de Jong and Van Ginkel (Reference De Jong, Van Ginkel, Verhoeven and de Jong1992) asked teachers to rate speaking performances of 25 Dutch speakers of French as a foreign language (prefinal year in secondary education) on several components as well as on overall speaking proficiency. Participants carried out separate tasks for pronunciation, sentence completion, picture description, strategic skills, and structured conversation. Performance on the pronunciation task was rated dichotomously (correct or incorrect). Performance on the sentence completion task was rated on a 3-point scale that ranged from meaningless response to meaningful response, almost without errors. Performance on the picture description task was rated with four dichotomous scales: comprehensibility, formal correctness, completeness, and fluency. In the strategic skills and structured conversation tasks, responses were rated on a 4-point scale of comprehensibility. Finally, raters were asked to provide a global impression of each participant’s oral proficiency. This rating for global impression was given after all other sections had been rated, and raters based this impression on participants’ performance on the whole test battery. It was found that the relative contribution of subskills varied depending on global rating of proficiency. For low overall proficiency scores, pronunciation contributed mostly to overall ability, whereas for higher proficiency scores, all subskills provided an equal contribution to overall proficiency. These results largely supported Higgs and Clifford’s (Reference Higgs, Clifford and Higgs1982) relative contribution model.
In the subjective-objective approach, expert ratings of overall proficiency in speaking tasks are compared to objective measures of various aspects of performance in those same speaking tasks. Using this approach, Magnan (Reference Magnan1988) related grammatical errors in transcriptions of 40 oral proficiency interviews (OPI) to ratings on these interviews and found significant differences in mean percentages of grammatical errors between levels of speaking proficiency.
Douglas (Reference Douglas1994) administered the five-part semidirect AGSPEAK test of speaking proficiency to six speakers of L2 English with speakers of L1 Slovak. Test performance was rated by two trained raters on comprehensibility, grammar, and pronunciation. Transcripts of test performance were also scored on grammar, vocabulary, and fluency (type-token ratio) as well as content and rhetorical organization. The researcher then compared the subjective ratings with the objective scores and found little relationship. Because of lack of relevant information, and possibly because of the small sample size too, it is difficult to assess the importance of this study.
A recent subjective-objective approach study was conducted by Iwashita, Brown, McNamara, and O’Hagan (Reference Iwashita, Brown, McNamara and O’Hagan2008). Speaking performances of 200 L2 English speakers on a five-task speaking test, developed by Educational Testing Services (ETS; see Y.-W. Lee, Reference Lee2005), were holistically rated as well as objectively scored in terms of linguistic resources (grammatical accuracy, grammatical complexity, and vocabulary profile), phonology (pronunciation, intonation, and rhythm), and fluency (filled and unfilled pauses, repair, total pausing time, speech rate, and mean length of run). Each performance was rated by two trained ETS staff on a 5-level scale that integrated four criteria: (a) provision of main ideas and supporting details, (b) speech fluency based on self-generated text (not copied from the stimulus materials), (c) speech intelligibility and listener effort, and (d) appropriate use of grammar and vocabulary. ANOVAs revealed that many but not all of the objective measures (corrected for amount of speech) distinguished between the 5 levels of the holistic rating scale. Significant predictors were vocabulary (type and token), fluency, grammatical accuracy, and pronunciation. Of these, vocabulary and fluency (speech rate) seemed particularly important, which was not surprising, because fluency and vocabulary formed two of the rubrics of the holistic rating scale. The predictors did not distinguish ratings at all adjacent levels of the holistic scale. The researchers interpreted this finding as supporting Higgs and Clifford’s (Reference Higgs, Clifford and Higgs1982) claim that not all aspects of speaking proficiency play an equally important role in the development of L2 speaking skills.
In sum, studies—whether they take the subjective-subjective or the subjective-objective approach—found significant associations between what might be called subskills or components of speaking proficiency, on the one hand, and a holistic, overall construct of speaking proficiency, on the other hand. Authors of most of these studies, regardless of the approach, interpreted their findings as support for a componential view of the construct of speaking proficiency as well as for the claim that the weight of particular components may differ across proficiency levels (e.g., intelligibility being more important at lower levels and fluency more important at higher levels).
Motivation for the Current Study
These studies addressed the question of how holistic, global ratings of speaking proficiency are related to subjective ratings or objective measures of various aspects or features of speech. However, they were not optimally suited to examine the componential nature of speaking proficiency, because the two types of data being compared in these studies were obtained from the same speech productions—with the exception of the small de Jong and Van Ginkel (Reference De Jong, Van Ginkel, Verhoeven and de Jong1992) study. This feature, although not problematic for a study in the field of language testing, potentially generates the danger of circularity for a study that aims to define and decompose the construct of speaking proficiency. This study aims to decompose the construct of speaking proficiency. It thus addresses a fundamental issue in the study of learner competence (language proficiency); it does not, however, address issues concerning rater behavior or the validity of rating scales. This study investigates how individual differences in subskills (i.e., in skills hypothesized to be components of speaking proficiency) are related to individual differences in successfully conveying information through speaking. To investigate this issue, while trying to avoid the danger of circularity, subskills and success of conveying messages through speaking were measured separately. Success of conveying information (the dependent variable) was measured by a panel of nonlinguists, who rated the functional adequacy of performance in eight speaking tasks of 181 L2 learners of Dutch. The independent (predictor) variables consisted of participants’ performance in a number of different linguistic skill tasks (see Method section for details).
To assess success of conveying messages through speaking, speech was elicited in computer-administrated monologic tasks. As has been demonstrated by He and Young (Reference He, Young, Young and He1998) and Young (Reference Young2002), what people say and understand in real communications with other people is coconstructed by virtue of the interactive nature of such communications (see also Berry, Reference Berry2007; Fulcher, Reference Fulcher2003; Lazaraton & Davis, Reference Lazaraton and Davis2008; McNamara, Reference McNamara1997; O’Sullivan, Reference O’Sullivan2008). The question of whether to assess speaking proficiency (in terms of functional adequacy) with computer-administered tasks or in settings of more natural interaction between people physically present always forms an obstacle for researchers (see Iwashita et al., Reference Iwashita, Brown, McNamara and O’Hagan2008). For this study, the computer-administered tasks were selected to investigate language proficiency as an individual attribute. For that purpose, this study assessed speaking performances not affected by the behavior of other individuals in the communication. Although the tasks were not interactive in the sense that the participants spoke to a live person in several turns, they could be considered communicative, as they were fully contextualized—that is, the addressee, communicative setting, and such were specified. The candidate was expected to give a (long) turn in a communicative role play. To standardize the testing conditions for all participants, a live interlocutor was not used (see Brown, Reference Brown2003; Nakatsuhara, Reference Nakatsuhara2008).
The aim of this study is to produce a definition, or at least a partial one, of the construct of L2 speaking proficiency. Starting from the premise that speaking proficiency is componential in nature (i.e., it consists of various linguistic skills), the relative weight of and the relationship among these skills were empirically examined. A rough distinction must then be made between two types of skills: those that are seen as forms of declarative, crystalized knowledge, and those seen as the ability to rapidly and correctly process linguistic information. For ease of reference, these two types will be referred to as knowledge skills and processing skills and represent, respectively, knowledge and processing components (and hence facets) of speaking proficiency. This distinction between knowledge and processing is roughly in line with various pairs of related labels in the psychological literature, such as declarative versus procedural knowledge (Anderson, Reference Anderson1980; Anderson & Lebiere, Reference Anderson and Lebiere1998; Paradis, Reference Paradis2004; Ullman, Reference Ullman2001, Reference Ullman2004).Footnote 1
These measures of linguistic skills were developed using Levelt’s (Reference Levelt1989) and Levelt, Roelofs, and Meyer’s (Reference Levelt, Roelofs and Meyer1999) model of speaking as a point of departure. According to Levelt, speaking consists of three major components: generating a preverbal message, putting this message into words, and articulating the generated utterance. Levelt calls these components the conceptualizer, the formulator, and the articulator. Concepts generated by the conceptualizer initiate lexical retrieval by activating the appropriate lemmas. After lemma retrieval, knowledge of the phonological form must also be retrieved from the mental lexicon, and the correct inflectional form has to be selected. Subsequently, the phonological forms are phonetically encoded, with aid of knowledge of frequent sound patterns (Cholin, Levelt, & Schiller, Reference Cholin, Levelt and Schiller2006). Finally, motor processes execute the gestural scores that are the product of phonetic encoding, and articulation takes place.
To tap the knowledge and processing skills that follow conceptualization, two knowledge tests (which measured knowledge of vocabulary and grammar) and several processing tests were constructed. A picture naming task (for lexical retrieval speed) and a sentence completion task (for speed with which morphosyntactic knowledge can be used) were then administered to tap formulation processes. Delayed picture naming tasks were also administered to tap the speed with which speech plans can be articulated. In the delayed picture naming task, processes of lexical retrieval and phonetic encoding are supposedly completed, and therefore reaction times reflect articulatory skills, pertaining to the retrieval, unpacking, and execution of the motor program (Eriksen, Pollack, & Montague, Reference Eriksen, Pollack and Montague1970; Sternberg, Knoll, Monsell, & Wright, Reference Sternberg, Knoll, Monsell and Wright1988; Sternberg, Monsell, Knoll, & Wright, Reference Sternberg, Monsell, Knoll, Wright and Stelmach1978). Finally, to tap knowledge of phonetic forms and the ability to correctly produce them, a pronunciation test was constructed in which participants read aloud words and sentences (without time pressure). These sentences were later rated on pronunciation quality.
Research Questions
This study was designed to address the following questions:
1. To what extent do L2 knowledge skills and L2 processing skills predict communicative success in L2 speaking, in a mixed-proficiency group of adult L2 learners?
2. To what extent does the relative weight of the linguistic skills measured in this study differ for L2 learners who are more successful versus L2 learners who are less successful in communicating their message in the speaking tasks?
Whereas the first question aims to examine the relative weight of knowledge and processing skills as facets of L2 speaking proficiency, the second research question aims to explore Higgs and Clifford’s (Reference Higgs, Clifford and Higgs1982) relative contribution model.Footnote 2
METHOD
Overview of the Study
Participants in this study, 181 adult L2 learners of Dutch, performed eight speaking tasks and six tasks tapping linguistic skills. The eight speaking tasks differed in formality, discourse genre, and topic complexity. Performance in the eight speaking tasks was rated on functional adequacy by a panel of judges. Whether the scores of functional adequacy in the eight tasks could be reduced to a single-factor score was first examined using structural equation modeling (SEM). Because this was found to be the case, the single-factor scores were subsequently used in the SEM analyses examining the weight of the predictor variables. The predictor variables consisted of (a) scores obtained from two tasks tapping knowledge skills (knowledge of vocabulary and grammar), (b) scores derived from performance in three tasks tapping speed of processing (picture naming, delayed picture naming, and sentence completion), and (c) three scores obtained in a pronunciation task. The three speed-of-processing tasks produced four speed-of-processing variables, all measured as reaction times (RTs) in ms: speed of lexical retrieval in the picture naming task, response latency and response duration in the delayed picture naming task, and speed of sentence building in the sentence completion task. The pronunciation task produced three variables: participants’ ability to produce (a) a variety of speech sounds in word contexts, (b) word stress in multisyllable words, and (c) intonation patterns. The SEM analyses, in sum, comprised nine predictor variables—two knowledge, four speed-of-processing, and three pronunciation variables—and examined how functional adequacy (in the eight speaking tasks) related to linguistic skills. All tasks were designed for this study and were extensively piloted with L1 and L2 speakers.
The design of the current study is somewhat similar to the one used by Schoonen et al. (Reference Schoonen, Van Gelderen, De Glopper, Hulstijn, Simis and Snellings2003) and Van Gelderen et al. (Reference Van Gelderen, Schoonen, De Glopper, Hulstijn, Simis and Snellings2004). These studies investigated how well several knowledge and skill variables, measured in separate tasks, predicted participants’ L2 (and L1) text comprehension (Van Gelderen et al., Reference Van Gelderen, Schoonen, De Glopper, Hulstijn, Simis and Snellings2004) and their ability to write comprehensible texts in L2 (and L1) (Schoonen et al., Reference Schoonen, Van Gelderen, De Glopper, Hulstijn, Simis and Snellings2003).
Participants
Data were collected from 208 adult L2 learners of Dutch and from 58 adult L1 speakers, as a control group. Because not all participants were able to complete all tasks, data of 181 L2 learners and 54 L1 speakers are reported. Almost all of the L2 learners were taking Dutch courses at intermediate or advanced levels to prepare for enrollment at the University of Amsterdam. The ages of the 181 L2 learners ranged from 20 to 56 (M = 29; SD = 6); the ages of the 54 L1 speakers ranged from 18 to 45 (M = 25; SD = 6). Of the L2 learners, 72% were female and 28% were male, whereas 63% of the L1 speakers were female and 37% were male. The L2 learners reported 46 different L1 backgrounds. The languages most frequently reported were German (n = 23), English (n = 18), Spanish (n = 16), French (n = 15), Polish (n = 11), and Russian (n = 10). Participants’ length of residence in the Netherlands ranged from 10 months to 20 years. Almost all L1 speakers were students enrolled at the same university, studying in programs other than Dutch or foreign languages.
Sessions
The tasks were performed over two sessions and took approximately 2 hr for L1 speakers and around 2.5 to 3 hr for L2 learners. Participants were paid 20€ (L1 speakers) or 25€ (L2 learners). In the first session, participants started with the speaking tasks (approximately 30 min), followed by the picture naming task and delayed picture naming task (10 min), the sentence completion task (10 min), and the pronunciation task (5 min). In the second session, participants completed the vocabulary and grammar tests and filled out the language background questionnaire. Because all tasks in the second session were not administered with time restrictions, this second session took from around 1 to as much as 2 hr. All participants were informed about the purpose of the study and signed a consent form during the first session.
Speaking Tasks
Materials.Speaking proficiency was measured with eight computer-administered speaking tasks. The tasks were constructed with contrasts on the following three dimensions, in a 2 × 2 × 2 fashion: complexity (complex vs. simple topic), formality (informal vs. formal setting), and discourse type (descriptive vs. argumentative). The task instructions specifically mentioned that participants should try to imagine that they were addressing an audience in each task, and participants were to role-play accordingly. For each task (as illustrated in tasks 1–8), the screen provided a picture of the communicative situation and one or several visual-verbal cues concerning the topic.
Task 1 (simple, informal, descriptive): Participant speaks on the phone to a friend and describes the apartment of friends who have recently moved.
Task 2 (simple, formal, descriptive): Participant, who witnessed a road accident some time ago, is in a courtroom and describes to a judge what happened.
Task 3 (simple, informal, argumentative): Participant advises his or her sister on how to choose between (or combine) child care, further education, and paid work.
Task 4 (simple, formal, argumentative): Participant is present at a neighborhood meeting at which an official has just proposed to build a school playground, separated by a road from the school building. Participant gets up to speak, takes the floor, and argues against the planned location of the playground.
Task 5 (complex, informal, descriptive): Participant tells a friend about the development of unemployment among women and men over the last ten years.
Task 6 (complex, informal, argumentative): Participant discusses the pros and cons of three means of transportation (public transportation, bicycle, and automobile) with respect to how to solve the problem of traffic congestion.
Task 7 (complex, formal, descriptive): Participant works at the employment office of a hospital and tells a candidate for a nursing position what the main job duties entail.
Task 8 (complex, formal, argumentative): Participant, who is the manager of a supermarket, addresses a neighborhood meeting and argues for whichever of three alternative plans for building a parking lot he or she prefers.
Apparatus and Software.The tasks were set in Macromedia Authorware, version 7. Speech was recorded with a microphone on the same computer, using PRAAT (Boersma & Weenink, Reference Boersma and Weenink2005) with 11,250 Hz sampling frequency.
Procedure.Each task started with two screens that provided detailed information on the assignment. After a set time of up to 17 s (for reading directions), participants were allotted 30 s to prepare their response. Their time was gauged by a blue bar that appeared at the bottom of the screen. A second (green) bar then appeared and cued participants to speak. Participants were given 120 s for this portion but were told they could stop whenever they had finished. Participants were urged to do their best in imagining they actually were in the situation described. As a warm-up, participants carried out a practice task in which they had to tell a friend about the research project in which they were participating. The tasks were administered in the same order for all participants.
Measure of Functional Adequacy.Participants’ speaking proficiency in the eight tasks was measured in terms of the functional adequacy of their responses and rated by a panel of four judges, from a pool of 12 graduate students who received payment. Nonexperts (none of the students studied linguistics or languages) were deliberately selected to obtain naive judgments on the functional adequacy of the responses. The rationale behind this was that if linguists or L2 teachers were asked to rate the responses, they would have found it almost impossible to ignore the linguistic infelicities in the responses (e.g., errors in grammar, lexis, and pronunciation) as opposed to focusing solely on the responses’ functional (informational) adequacy. For all tasks, the scales comprised six levels and contained descriptors pertaining to both the amount and detail of information conveyed, relevant to the topic, setting (formal or informal), and discourse type (descriptive or argumentative) and the ease with which the description could be followed. For each task, the scale was slightly adapted to include the task-specific descriptions. Each of these six categories was subdivided into five score intervals to allow for an even more precise distinction between responses, and this resulted in a rating scale ranging from 1 to 30. Scores 1 to 5, 6 to 10, and 11 to 15 were described as being insufficient in terms of functional adequacy, with descriptors such as unsuccessful, weak, and mediocre. Scores 16 to 20, 21 to 25, and 26 to 30 were described as being sufficient in terms of functional adequacy, with descriptors such as sufficient, quite successful, and very successful.
After an introductory training session, the judges received all responses of either two or three tasks, such that, for each speaking task, four judges independently rated all speaking responses, randomized per task. Judges performed their rating tasks at home in the span of 20 to 25 hr.
Vocabulary Knowledge
Materials and Procedure.For the assessment of productive vocabulary knowledge, a two-part paper-and-pencil task was administered. Part 1 (90 items) elicited knowledge of single words, and part 2 (26 items) elicited knowledge of multiword units. For part 1, nine words were selected from each frequency band of 1,000 words between words ranked 1 to 10,000 according to the Corpus Gesproken Nederlands “Corpus of Spoken Dutch” (CGN, Dutch Language Union, 2004). The format by Laufer and Nation (Reference Laufer and Nation1999) was used; that is, for each item a meaningful sentence was presented with the target word omitted, except for its first letter. When alternative words beginning with the same letter could also be appropriately used, more letters were given. Part 2 of the vocabulary task tested knowledge of 26 prepositional phrases and verb-noun collocations; the preposition or main verb was omitted and the gap had to be filled in. The test format was the same as in the first part of the vocabulary test, except that for this part, no first letter(s) were given, because all contexts sufficiently narrowed down the possible candidates for the target word(s).
Scoring.Correct and incorrect answers were counted for all 118 items. Because the study is concerned with facets of speaking ability, there was extreme leniency toward spelling mistakes. If the spelling of a response was incorrect but the most likely pronunciation was the same as the correct answer, the item was scored as correct. All inflectional variants of a word were also scored as correct to avoid measuring morphosyntactic knowledge in the vocabulary test.
Grammar Knowledge
Materials and Procedure.The grammar task consisted of 142 items that covered a range of grammatical issues grouped in different test sections. Short instructions and an example were given at the beginning of each section. Knowledge of inflectional variants of adjectives (19 items) and verbs (19 items); word order of main clauses and subclauses (33 items); the place of particles (10 items); use of relative pronouns (15 items), possessive pronouns (5 items), and clause pronouns (26 items); choice of auxiliary verbs (10 items); and construction of passive sentences (5 items) were assessed.
Scoring.One point was awarded for each correct response. Items were also scored as correct if the grammatical form intended to be elicited was correct. For example, mistakes in inflectional variants were not penalized in the parts eliciting word order.
Lexical Retrieval Speed
Materials.From the picture set produced by Snodgrass and Vanderwart (Reference Snodgrass and Vanderwart1980), 28 pictures were selected with 100% name agreement in Dutch (Severens, Van Lommel, Ratinckx, & Hartsuiker, Reference Severens, Van Lommel, Ratinckx and Hartsuiker2005). The names belonged to the 2,200 most frequent lemmas in the CGN, with frequencies ranging from 20 to 498 per million. In a pilot study, both L1 and L2 speakers named these 28 pictures without mistakes.
Apparatus.The presentation of the stimuli was controlled by the E-Prime software system (Schneider, Eschman, & Zuccolotto, Reference Schneider, Eschman and Zuccolotto2002a, Reference Schneider, Eschman and Zuccolotto2002b), and speech was recorded on a flash digital recorder (Edirol) with a microphone (48,000 Hz sampling frequency). The speech signal as well as an auditory cue (unheard by the participant) generated by the E-Prime script was recorded to determine latencies between the target cue and the response.
Procedure.Participants were first made familiar with the pictures and the procedure and were then instructed to name the pictures as fast and accurately as possible. First, a fixation cross was presented in the middle of the screen for 1,500 ms. Then the picture appeared, which was presented for 2,000 ms. After the picture, a blank screen followed for 500 ms. The pictures were presented in different random orders in the familiarization and the test phase but in the same order for all participants. The familiarization phase was preceded by a practice list of seven pictures. The experimenter noted wrong answers and other deviations from the intended responses.
Measure.The time between the appearance of the picture and the beginning of the response was measured using a script written in PRAAT (Boersma & Weenink, Reference Boersma and Weenink2005), which automatically measured changes in dB as well as voice onsets. This script automatically determined the unheard beep generated by the E-Prime script as well as the onset of speech. Response times were then measured for all correct responses (as noted by the experimenter). Incorrect responses and outliers were replaced by missing values. Outliers were defined after inspection of the data as RTs below the minimum of 300 ms and RTs higher than 3 standard deviations above the grand mean. In this way, 11% of all picture naming RTs were replaced. Multiple imputation by chained equations was used to impute these missing data (Van Buuren & Oudshoorn, Reference Van Buuren and Oudshoorn1999).
Speed of Articulation: Response Latency and Response Duration
Materials and Apparatus.The materials and apparatus were the same as the ones used for the lexical retrieval measure (picture naming).
Procedure.Participants carried out the picture naming task once more. This time, however, they were asked to prepare their response and wait until a cue was given to name the picture. A fixation cross was presented in the middle of the screen for 500 ms. Then the picture appeared and remained on the screen for 2,000 ms. After 2,000 ms, the participant heard a short beep, and a green border appeared on the screen, around the picture. The beep together with the green border formed the cue for participants to give their response. The picture (with the green border) remained on the screen for another 1,000 ms, during which the participants responded.
Measures.Response latency was measured as the latency between the auditory cue and the beginning of the response. Response duration was measured as the duration of the response—that is, the latency between the beginning and the end of the response. This was done using a script written in PRAAT and was then computed for all correct responses. Incorrect responses and outliers were replaced by missing values. Minimum response time was defined after inspection of the data (minimum 50 ms for articulation latency and pronunciation duration). For both measures, the maximum response time was set to 3 standard deviations above the grand mean. In this way, 13% and 12% of all articulation latency and articulation duration data, respectively, were replaced by missing values. Missing data were imputed as described for the lexical retrieval task.
Sentence Building Speed
Materials.Participants performed a sentence completion task, in which the completion was an alteration of a given sentence elicited by a cue. For instance, they would hear and read, De meisjes gaan meestal naar de bakker “The girls usually go to the bakery,” after which the written cue Het meisje . . . “The girl” was presented. The correct response would be, Het meisje gaat meestal naar de bakker “The girl usually goes to the bakery.” The alteration of the sentences always involved a grammatical change that was induced by the written cue following the original sentence. Grammatical changes required adjectival inflection (10 items), verbal inflection of number (10 items), verbal conjugation changing present tense to past tense (10 items), construction of subclauses from main clauses (10 items), or subject-verb inversion in main clauses (10 items). The original sentences were recorded in a noise-free booth by a trained female speaker.
Apparatus.The apparatus was the same as described for the lexical retrieval measure.
Procedure.Instructions were presented on the computer screen. For each sentence-changing type, an example was shown. In each experimental trial, first, a fixation cross was presented near the top-left corner of the screen for 1,000 ms. Then participants heard a sentence through the headphones while the same sentence appeared simultaneously (in written form) on the screen. The first letter of the sentence was presented at the same point as where the fixation cross had appeared. The beginning of the altered sentence was presented (in written form) 500 ms after offset of the auditory stimulus, precisely below the first sentence, which remained on the screen. The E-Prime script generated a beep unheard by the participants while the beginning of the altered sentence was presented on the screen. Both the original sentence and the beginning of the altered sentence stayed on the screen for 5,000 ms. Participants were instructed to use the content of the first sentence to correctly complete the altered sentence, beginning with the word or words on the screen (i.e., with Het meisje in the example). The sentences were presented in a random order identical for all participants. The experimenter noted wrong answers and other deviations from the intended responses.
Measure.The period between the beginning and the end of the participants’ response was measured. However, due to a technical failure, the response of the last item could not be measured. A script written in PRAAT (Boersma & Weenink, Reference Boersma and Weenink2005) was used to determine the latencies, and to automatically measure changes in dB as well as voice onsets. Incorrect responses and outliers (minimum defined after inspection of the data as 1,000 ms, and maximum set to 3 standard deviations above the grand mean) were replaced by missing values. In this way, 22% of all data were replaced as missing values (3% outliers and 19% incorrect responses). Missing data were imputed as described for the lexical retrieval task.
Pronunciation
Materials.The materials in the pronunciation task were constructed on the basis of Thio and Verboog (Reference Thio and Verboog1993), a book on the pronunciation of standard Dutch and pronunciation difficulties encountered by L2 learners with a wide range of L1s. Sixty target words (mostly monosyllabic) were selected, covering a broad range of vowels, diphthongs, and to a lesser extent, consonants (each sound occurred in one to four target words). Thirty-six of these words were divided into six sets of six single-word items, and the 24 remaining target words were embedded in 15 sentences. Ten of these sentences were also designated to test the quality of the intonation pattern. Finally, to test word-stress knowledge, 10 words with two to four syllables were added, divided into two sets of five target words.
Apparatus.The apparatus was the same as described for the lexical retrieval measure.
Procedure.The presentation of the written stimuli was controlled by the E-Prime software system, and speech was recorded on a flash digital recorder (Edirol) with a directional microphone (48,000 Hz sampling frequency). Participants were instructed to inspect the items at their leisure before pressing the space bar. They started reading aloud after pressing the space bar, which induced an unheard beep that was recorded, together with the speech signal, in order to automatically cut speech files into the sets just mentioned.
Measures.A script was written in PRAAT (Boersma & Weenink, Reference Boersma and Weenink2005) to automatically create 25 sets of responses (six sets of six words, two sets of five words, and 17 sentences). Three judges (undergraduate students in phonetic sciences) received payment to rate the responses. The judges rated whether the pronunciation of the designated sound of the target word was correct or incorrect for the first six sets of words as well as whether the stress patterns were correct or incorrect for the two sets of five multisyllable words. They also rated the target sounds in words as correct or incorrect for the 15 remaining sentences. Furthermore, for 10 of these sentences, an additional judgment on intonation had to be given (correct or incorrect). In a 2-hr session, the judges were trained to give judgments of phonetic quality of sounds in words, word stress, and sentence intonation. The judges were asked to rate sounds as correct if they were correct in any version of standard Dutch. After the training session, the judges rated all responses (six sets of six words, two sets of five words, and 15 sentences) at home. Speaker responses were randomized per sets of words and sentences, and per judge. Each set of words or sentence could be played a maximum of three times per judge. The rating task took the judges approximately 35 hr. Each judge scored 2% of all items as not scoreable. Missing data were imputed as described for the lexical retrieval task. Each correct item counted as one point, and mean scores were calculated per item over the three judges.
Analyses: Structural Equation Modeling
Structural equation modeling (SEM) was applied to address the research questions. SEM can be conceived of as a combination of factor analysis and regression analysis (see Raykov & Marcoulides, Reference Raykov and Marcoulides2000). First, the structure of the measurements was examined—that is, the observed scores were related to latent variables (like in factor analysis). This part of the analysis is referred to as the measurement model. One measurement model was developed for the dependent variable functional adequacy, representing the construct speaking proficiency, and one for the independent variables (linguistics knowledge and processing skills). For the identification of latent variables, at least three indicators (observed variables) are required. For functional adequacy, the ratings of four judges per task are included in the analyses; in the case of the predictor variables, subscores were used (see the Results section for details). The second step of the analyses investigated the relationship between speaking proficiency (i.e., the latent variable functional adequacy of the speaking tasks) and the independent (latent) variables (as in regression analysis). This part of the analysis is referred to as the structural model.
In SEM there are several indices to evaluate the fit between model and data. One statistical measure is χ2 (df), where χ2 should be small compared to the degrees of freedom (df) for the model to be accepted (i.e., not rejected). However, χ2 is very sensitive to sample size and the number of parameters in the model and easily leads to the rejection of almost any (complex) model. Therefore, the ratio of χ2/df is often used as a (rough) indicator of fit. This ratio should preferably be smaller than 2. A more relevant use of the χ2 is in the comparison of two concurrent nested models—that is, when a model can be converted into another model by adding one or more free parameters (Kline, Reference Kline2005). The difference in fit between two nested models can be tested using the difference in χ2 and df values of the competing models. Descriptive measures for model fit are the standardized root mean squared residual (SRMR), root mean squared error of approximation (RMSEA), and comparative fit index (CFI). The fit of a model is considered good when SRMR ≤ .08, RMSEA ≤ .06, and CFI ≥ .95 (see Hu & Bentler, Reference Hu and Bentler1999).
Analyses were carried out by fitting two measurement models, one for the predictor variables and one for the dependent variable speaking. The measurement models were satisfactory and thus were combined in the next step—that is, in the examination of the structural model. Structural equation modeling allows for testing many different models, but here it was confined to the measurement and structural models that operationalize the research questions and match the research design—that is, the measurement of speaking proficiency with eight tasks each rated by four raters, the measurement of the nine constituent predictor variables, and finally the regression of speaking on the constituent predictor variables.
RESULTS
Comparison between L2 and L1 Speakers
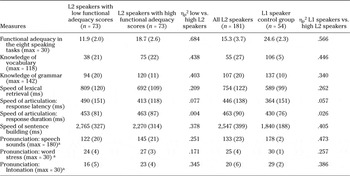
Table 1 shows the descriptive statistics of all measures, for L2 and L1 speakers. Interitem reliability for all measures was satisfactory (Cronbach’s alpha > 0.86), with the exception of the two pronunciation measures with only ten items—namely, word stress (alpha = 0.70) and intonation (alpha = 0.55). The Shapiro-Wilk test showed that for all variables, normality could reasonably be assumed (Ws > 0.9). The 40% of participants with highest functional adequacy scores and the 40% of participants with lowest functional adequacy scores (n = 73 each) were defined within the group of 181 L2 speakers. This was done to answer the second research question. Separate columns in Table 1 show the performance of the high and the low L2 speakers.
Means and standard deviations (in parentheses) for L1 and L2 speakers, and effect sizes (partial eta square, ηp2) for group comparisons

Note
L1 speakers scored significantly better (i.e., higher or faster) than the 73 high L2 speakers (p < .001), and the high L2 speakers scored significantly better than the low L2 speakers on all measures (p < .001), except response duration in delayed picture naming.
a Sum scores of three expert judges.
Group comparisons showed that, as expected, L1 speakers scored significantly higher and faster than the 73 L2 speakers in the high L2 group. This finding suggests that all measures tapped proficiency-related skills rather than individual differences associated with nonlinguistic attributes. As expected, the high L2 speakers scored significantly better (i.e., higher or faster) than the low L2 speakers on all measures, except response duration in delayed picture naming.
Using SEM, it was hoped that these data would also allow for the examination of the structure of speaking proficiency in the L1 speaker control group. Although scores on some predictor variables showed sufficient dispersion, functional adequacy ratings turned out to be almost at ceiling. Functional adequacy, therefore, was not significantly associated with any of the predictor variables (r values between −.06 and .18). A multiple regression analysis on the observed variables showed that only 10% of the variance in functional adequacy could be explained by all predictors together. Thus, the fact that the data exhibited low and nonsignificant correlations prevented a meaningful examination of the componential nature of speaking proficiency in the case of the L1 speaker control group.
Measurement Model: Speaking Proficiency
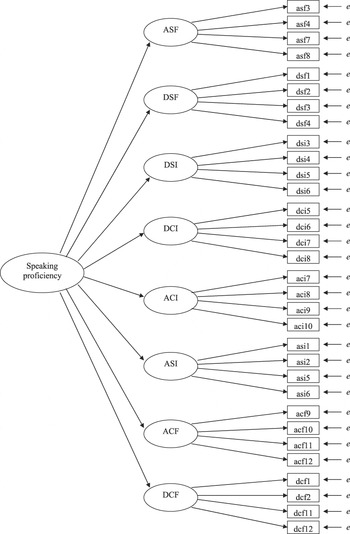
In the measurement model for functional adequacy, 32 scores (8 tasks × 4 raters) had to be modeled. Several competing models could be assumed. The most simple model would be a single-factor model with one single functional adequacy factor explaining (the interrelations between) the 32 scores. Alternatively, it could be assumed that each task tapped a separate yet adequate ability of expression leading to eight functional adequacy factors. Other theoretically plausible models might postulate two speaking factors—that is, functional adequacy in argumentative versus descriptive tasks, in formal versus informal tasks, or (somewhat less plausibly) in complex versus simple tasks. These models accommodate the design features of the speaking tasks in different ways. Analyses showed that none of these models was completely satisfactory. However, there is a complicating issue—namely, that the 32 scores are hierarchically related themselves, which means that it is not possible to consider them as 32 independent measures of speaking proficiency. There were eight (independent) performances, each of which was rated four times. This hierarchy is best accommodated in a second-order factor analysis with the eight different tasks as first-order factors, and with each task factor indicated by the four ratings. At the second-order level, the eight task factors can be modeled as a single factor, speaking proficiency, or as two or more factors—for example, as informal speaking and formal speaking. A measurement model with one second-order factor fitted the data fairly well: χ2(456) = 647.5, p ≤ .001; SRMR = .039, RMSEA = .046, CFI = .994. Models with two second-order factors, reflecting one of the three task dimensions, did not fit better. The standardized loadings for the (four) ratings per task ranged from .68 to .96; for the tasks on the latent factor speaking proficiency, the loadings ranged from .87 to .96. In the SEM analyses (structural model), this second-order factor, illustrated in Figure 1, is the dependent variable, to be explained by (latent) predictor variables. Thus, the operationalization of speaking proficiency, communicative success, can indeed be considered to represent a single construct.
Measurement model of speaking proficiency (operationalized as functional adequacy of the responses in eight speaking tasks) with one second-order factor. Ovals refer to latent variables, boxes to observed variables. The eight (latent) tasks are designated with three letters, referring to the first letters of the following features: descriptive or argumentative, simple or complex, and formal or informal, respectively. Functional adequacy of each task elicits the observed four ratings, indicated by the same letter-trigram and a rater id; e is error.

Measurement Model: Independent Variables
Of the seven measures of linguistic knowledge and processing skills, 24 subscores were initially derived in such a way that each independent variable was indicated by between three and five subscores. As a first step, to test whether these subscores of each variable would indeed load on a single factor, separate confirmatory factor analyses were carried out. A squared loading of .6 was considered as minimum for subscores. For most variables, all loadings were well above this minimum. In the confirmatory factor analysis for pronunciation, however, two subscores had loadings below this minimum (squared loadings for intonation and word stress were .56 and .41, respectively), which indicated that the three indicators did not load well on a single latent factor. Therefore pronunciation was split into three separate latent variables—namely, speech sound quality, word stress quality, and intonation—each with the three separate judge scores as subscores. For these new models, the loadings were satisfactory. The final measurement model, representing the relations between the 30 subscores and 9 (correlated) latent variables, fitted the data quite well, χ2(369) = 531, p ≤ .001; SRMR = .033, RMSEA = .040, CFI = .988.
Structural Models: Relations between Speaking and Linguistic Knowledge and Skills
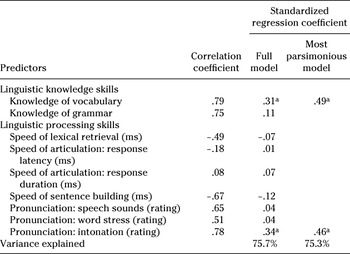
In the structural model, the dependent latent variable speaking proficiency (i.e., the second-order factor of the variable functional adequacy) was regressed on the independent latent variables vocabulary knowledge, grammar knowledge, speed of lexical retrieval (picture naming), speed of articulation response latency (delayed picture naming), speed of articulation response duration (delayed picture naming), speed of sentence building, pronunciation speech sound, pronunciation word stress, and pronunciation intonation (with n = 181). The structural model fits the data quite well, χ2(1776) = 2,380, p ≤ .001; SRMR = .044, RMSEA = .034, CFI = .991. Table 2 shows the separate correlations of the nine independent variables with functional adequacy.
Correlations and standardized regression coefficients of latent predictor variables with the latent dependent variable speaking proficiency in the full and most parsimonious models

a p < .05.
Note
As estimated model parameters, only the regression weights are tested for their statistical significance.
All correlations between functional adequacy and the predictor variables were substantial, except for response latency and response duration in the delayed picture naming task. In the regression analyses, vocabulary knowledge and intonation were found to be significant predictors (standardized regression coefficients of .305 and .341, respectively). Because the two linguistic knowledge, the four speed-of-processing, and the three pronunciation predictors exhibited substantial intercorrelations (collinearity), the most parsimonious model, with only one knowledge predictor (knowledge of vocabulary) and one pronunciation predictor (quality of intonation)—that is, the variables with the two highest correlation coefficients in Table 2—accounted for virtually the same amount of variance: 75.3% in the pruned model versus 75.7% in the full model (χ2(1783) = 2,388, p ≤ .001; SRMR = .0458, RMSEA = .0341, CFI = .991).
In sum, the answer to the first research question is that all latent variables, except for response latency and response duration in the delayed picture naming task, correlate substantially with the communicative success with which the 181 L2 speakers were able to deliver the message in the eight speaking tasks. Thus, speaking proficiency was determined by linguistic knowledge skills (vocabulary and grammar), speed-of-processing skills (lexical retrieval and sentence building), and pronunciation skills (speech sounds, word stress, and intonation). Furthermore, because of the substantial collinearity among the predictors, the full model, containing all predictors, did not explain more variance in functional adequacy than the most parsimonious model with just vocabulary and intonation.
A Comparison of Communicatively Less and More Successful L2 Speakers
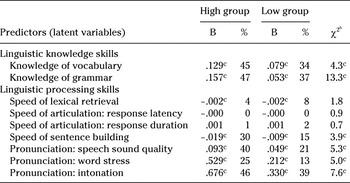
The second research question asked whether the linguistic knowledge and linguistic processing skills attribute equally to speaking proficiency for L2 learners who are more or less successful in communicating their message. To answer this question, the 40% of L2 speakers with the highest and the 40% of L2 speakers with the lowest functional adequacy scores (n = 73 each), called the high and the low L2 groups, were selected from the whole sample of 181 L2 speakers. By selecting the lowest and highest 40%, rather than taking the medium split, the two groups were clearly made distinct from each other, to better test Higgs and Clifford’s (Reference Higgs, Clifford and Higgs1982) relative contribution model. SEM analyses were carried out for each independent variable separately. Table 3 shows the resulting regression weights.
Unstandardized regression weights (B)Footnote a of the single predictor variables, and percentage of variance explained of the dependent variable speaking proficiency, for speakers in the high and low L2 speaker groups (n = 73 each) and χ2-test for different slopes in the high and low group

a The unstandardized regressions come from separate analyses and, therefore, they can only be compared horizontally (between groups) but not vertically (between predictors).
b Df = 1.
c p < .05.
The multigroup analyses (high and low) with single predictors showed significant contributions for all predictors, except for the two measures in the delayed picture naming task (speed of articulation), which was similar to the finding for the L2 group as a whole. In contrast with what could be expected on the basis of Higgs and Clifford’s (Reference Higgs, Clifford and Higgs1982) relative contribution model, the weight of each predictor was always larger for the communicatively more successful group than for the less successful group. This means that a similar increase in linguistic knowledge or speed of processing predicts a higher gain in speaking proficiency for the high group than for the low group. All differences in (unstandardized) regression weights between the two groups were significant, except for lexical retrieval, articulation latency, and response duration (see Table 3).
DISCUSSION
This study explored the componential makeup of L2 speaking proficiency. In a sample of 181 adult L2 speakers of Dutch (nonbeginners) and in a control group of 54 adult L1 speakers, speaking proficiency was assessed as the success with which participants were able to get their message across in eight speaking tasks. Their linguistic knowledge was separately assessed in two tests (vocabulary and grammar) as well as their linguistic processing skills (four reaction time measures obtained in three tasks: picture naming, delayed picture naming, and sentence building) and their pronunciation skills (speech sounds, word stress, and intonation). The study addressed two research questions that pertained to the componential structure of speaking proficiency.
Speaking was elicited in eight tasks, differing in complexity (complex vs. simple topic), formality (informal vs. formal setting), and discourse type (descriptive vs. argumentative). As expected, the L1 speaker control group performed significantly better (higher or faster) than the L2 speakers, which suggested that the measures were relevant with respect to L2 proficiency. In the measurement model for speaking proficiency, it was found that the scores for functional adequacy on the eight different tasks could best be modeled with a single (higher-order) factor, which showed that these tasks all measured the same speaking proficiency construct.
With respect to the first research question, using SEM, all linguistic skills assessed in the study were significantly and substantially related to functional adequacy of speaking, with the exception of the two articulation speed measures obtained in the delayed picture naming task (Table 2). Thus, the efficiency of L2 speakers’ articulatory skills was not found to be associated with speaking proficiency.
Of the seven language skill variables associated with functional adequacy, knowledge of vocabulary and the ability to produce correct sentence intonation turned out to be the best predictors of speaking proficiency. The model with only these two predictors explained the variance in functional adequacy in speaking (75.3%) as well as did the model with all predictors (75.7%). It is important to emphasize that this finding does not mean that the only variables that matter for communicative success are vocabulary and intonation skills. Knowledge of grammar, speed of lexical retrieval, speed of sentence building, and correct pronunciation of speech sounds and word stress were also strongly associated with speaking proficiency (with correlation coefficients between .49 and .75; see Table 2). Thus, speaking proficiency is a matter of declarative knowledge (elicited in this study with a vocabulary and a grammar task), a matter of processing knowledge quickly (elicited in this study in the picture naming and sentence building tasks), and a matter of pronunciation skills (quality of speech sounds, word stress, and intonation). Whether these predictor variables contribute to overall speaking proficiency similarly for all individuals in this study cannot be answered with these data. Follow-up research is needed to investigate whether different speakers show different profiles of factors that contribute to speaking proficiency.
The large-scale study of Iwashita et al. (Reference Iwashita, Brown, McNamara and O’Hagan2008; see the Previous Research Investigating Components of L2 Speaking Proficiency section) pointed to the important role of vocabulary, fluency, grammatical accuracy, and pronunciation in speaking. In a similar manner, this study also points out the importance of those factors, but the current evidence is stronger. It is possible to argue that, in contrast to Iwashita et al., this study measured the functional adequacy of speech (content) independently from the component skills.
The finding that performance in a functional task (in eight speaking tasks in this study) requires knowledge (the representation of information) and the ability to use that knowledge fluently (the processing of information) is in line with findings that Van Gelderen et al. (Reference Van Gelderen, Schoonen, De Glopper, Hulstijn, Simis and Snellings2004) obtained for components of reading and with those of Schoonen et al. (Reference Schoonen, Van Gelderen, De Glopper, Hulstijn, Simis and Snellings2003) for writing. Participants in these two studies were 281 eighth-grade students in the Netherlands, who were tested on reading comprehension and writing in L2 English and L1 Dutch. Additionally, they were tested on (a) several knowledge subskills (vocabulary, grammar, and orthography in L2 and L1), (b) several speed-of-processing subskills (lexical decision, lexical retrieval, sentence verification, and sentence building in L2 and L1), and (c) metacognition (i.e., their knowledge of reading and writing strategies and their knowledge of text characteristics, elicited with an 80-item questionnaire). Structural equation modeling was used to determine the contribution of the subskill variables to performance in the reading comprehension tests (Van Gelderen et al., Reference Van Gelderen, Schoonen, De Glopper, Hulstijn, Simis and Snellings2004) and the writing tests (Schoonen et al., Reference Schoonen, Van Gelderen, De Glopper, Hulstijn, Simis and Snellings2003). This was done for L2 and L1 separately. The common finding was that the variance in reading and writing (in L2 and L1) was significantly associated with (a) the language knowledge predictors (in L2 and L1, respectively) and (b) most of the language processing predictors (in L2 and L1, respectively) and was almost always associated with (c) the metacognitive knowledge predictor.
Unfortunately, the data did not permit the modeling of speaking proficiency in the control group of L1 speakers mainly because of a lack of variability in the dependent variable; most L1 speakers scored at ceiling on functional adequacy and were rather homogenous in nature—consisting of young, intelligent adults (university students). In a separate study, Mulder and Hulstijn (Reference Levelt2011) administered four of the eight speaking tasks of this study to a group of 98 Dutch L1 speakers differing in age (18–76) and levels of education and profession (high vs. low). Functional adequacy was rated in the same way as in the present study. Level of education and profession affected functional adequacy scores substantially. This finding suggests that it should also be possible to investigate the componential structure, in terms of linguistic subskills, of the speaking proficiency of L1 speakers.
The second research question explored Higgs and Clifford’s (Reference Higgs, Clifford and Higgs1982) relative contribution model predicting that, while L2 learners become more proficient over time, the relative weight of component skills may change. In the realm of speaking, the experienced raters in the Higgs and Clifford study exhibited intuitions that largely converged with those of the authors themselves—namely, that at lower levels of the FSI overall speaking proficiency scale, knowledge of vocabulary and grammar would play the most dominant role, whereas at the highest scale level, all components would play an equal role. Only the weight of fluency was estimated to be lower by the teacher raters than expected by the researchers. As mentioned in the introduction to this article, findings of the study by de Jong and Van Ginkel (Reference De Jong, Van Ginkel, Verhoeven and de Jong1992), involving 25 L2 learners, supported the model. However, support for the relative contribution model was not found in the cross-sectional data, when the sample of 181 L2 learners was split into the 40% lowest and the 40% highest performing participants on the dependent variable functional adequacy. It is necessary to notice that functional adequacy was rated on a 30-point scale with scores lower and higher than 15, indicating insufficient and sufficient, respectively, success in conveying the message. All participants in the low group had an average score lower than 15, whereas all participants in the high group had an average score higher than 15 (when the ratings were pooled over the eight speaking tasks). The two groups thus were not only well apart from each other but differed meaningfully in communicative proficiency (pass vs. fail). Furthermore, the relationship of speaking proficiency with the predictor variables differed across the two groups. The regression slopes were steeper in the high group than in the low group for almost all predictor variables (Table 3). It should be kept in mind, however, when interpreting these findings, that L2 speaking performance in the studies of Higgs and Clifford as well as de Jong and Van Ginkel was rated from a hearer perspective. In contrast, this study assessed the components of speaking proficiency as attributes of the speaker. In conclusion, although the data of the current study do not falsify Higgs and Clifford’s hypothesis, they certainly do not provide evidence in its support in the domain of speaking.
In terms of the study’s strengths, it is important to point to several of its features. First, this study is (to the knowledge of the authors) the first one using SEM in the exploration of candidate components of speaking proficiency. SEM allows the researcher to examine associations between variables, free of measurement error. Second, contrary to some previous studies, potential problems arising from computing the dependent and the independent variables from the same data in the investigation of facets of speaking proficiency were avoided. Third, L2 learners substantially differing in speaking proficiency were tested. As Harley, Cummins, Swain, and Allen (Reference Harley, Cummins, Swain, Allen, Harley, Allen, Cummins and Swain1990) pointed out in the context of their large-scale study of the French L2 proficiency of Canadian immersion students, heterogeneity in the subject sample is a requirement for testing models of proficiency. Fourth, functional adequacy in speaking was assessed not with a single task but with eight tasks, differing in topic complexity, discourse type, and formality. It is known from language testing that test tasks may differ in difficulty for different test takers and that they may not all be assumed to measure the same skill to the same extent. The best way of dealing with this problem in language testing is to include several tasks (Brennan, Reference Brennan2001; Y.-W. Lee, Reference Lee2006; S. K. Lee, Reference Lee2007; Sawaki, Reference Sawaki2007; Schoonen, Reference Schoonen2005). The first part of the SEM analyses, which can be seen as a kind of factor analysis, showed that, as far as rated adequacy of task performance is concerned, a common factor emerged. This demonstrates that the measurement of the ability to successfully communicate a message was assessed in a reliable way in this study.
How do the findings relate to models of language proficiency in general (i.e., models not of speaking proficiency in particular)? There are two models that have become very well known in the literature. The first one, proposed by Canale and Swain (Reference Canale and Swain1980), consists of grammatical, sociolinguistic, and strategic competence. The second one, proposed by Bachman and Palmer (Reference Bachman and Palmer1996; see also Bachman, Reference Bachman1990), conceives language ability as consisting of language knowledge (including pragmatic knowledge)—that is, functional and sociolinguistic knowledge—and strategic competence (metacognitive components and strategies). Both models include linguistic knowledge, but linguistic processing skills are not explicitly mentioned. In this study, pragmatic knowledge was not assessed separately. However, the participants in this study performed speaking tasks—differentiated in formality and discourse type—that called on their pragmatic skills to a considerable extent. Thus, although the present study was not designed to test the Canale and Swain (Reference Canale and Swain1980) or the Bachman and Palmer (Reference Bachman and Palmer1996) models, its results do not seem to be at variance with these models. What the empirical studies of Van Gelderen et al. (Reference Van Gelderen, Schoonen, De Glopper, Hulstijn, Simis and Snellings2004), Schoonen et al. (Reference Schoonen, Van Gelderen, De Glopper, Hulstijn, Simis and Snellings2003), and this study clearly demonstrate, however, is the importance of linguistic knowledge and processing skills, explaining, in the case of this study, 75.7% of the variance in communicative success in speaking. Thus, linguistic knowledge and processing skills deserve a prominent place in any model of language proficiency.