Introduction
The reproductive ecology of lichens is an emerging research field (Ramstad & Hestmark Reference Ramstad and Hestmark2001; Pringle et al. Reference Pringle, Chen and Taylor2003; Jackson et al. Reference Jackson, Clair and Eggett2006). A focus of recent research in the field has been the relationship between thallus size and the density of apothecia, i.e. the number of apothecia per unit area. Ramstad and Hestmark (Reference Ramstad and Hestmark2001) proposed that the total number of apothecia was proportional to the thallus area in the coastal saxicolous lichen species, Umbilicaria spodochroa. This suggests that the relationship is isometric, i.e., the density of apothecia is constant or does not depend on thallus size or thallus area. Pringle et al. (Reference Pringle, Chen and Taylor2003), however, stated that the apothecium density depended on thallus size in the foliose saxicolous species, Xanthoparmelia cumberlandia. These authors selected a statistical model, using the likelihood ratio test, in which they evaluated the log likelihood of two different models representing the relationship between apothecium density and thallus size. They showed that the model including the power of thallus size was the better predictor of the number of apothecia than the proportional relationship model.
The effects of environmental factors on the density of apothecia have been discussed in several recent studies. Jackson et al. (Reference Jackson, Clair and Eggett2006) proposed a new model in which the relationship between thallus size and apothecium density was affected by the altitude of the sampling sites. They applied an allometric model assuming that the log of apothecium number could be predicted by a linear expression of the log of thallus area, and concluded that the allometric relationship varied with the altitude of the sampling site.
The foregoing examples of studies involved not only a consideration of biological issues but also of statistical issues. We aim to address two problems in the modelling of apothecium density, including the correctness of terms, that depend on both thallus size and environmental factors. The first factor concerns the functional form of the relationship between thallus size and apothecium number. In theory, a general but reasonable formula for the relationship is the allometric function as described in Jackson et al. (Reference Jackson, Clair and Eggett2006). This is because the number of apothecia is zero when the thallus size is zero. The proper probabilistic distribution for the apothecium number will not be a normal distribution but a Poisson distribution as in Pringle et al. (Reference Pringle, Chen and Taylor2003), because the data are countable. The second problem, modelling of environmental factors, requires a carefully designed statistical model involving both fixed and random effects (e.g. Crawley Reference Crawley2005), i.e. factors of interest and nuisance ones. We focus on the light environment in lichen habitats as a fixed effect because recent studies have shown quantitative effects of light on lichen growth. Dahlman & Palmqvist (Reference Dahlman and Palmqvist2003) demonstrated the importance of irradiance on thalli during the hydration period on growth in two lichens, Nephroma arcticum and Peltigera aphthosa. Many studies have reported that thallus size and anatomy affect the water-holding capacity and thereby the photosynthetic rate (Larson Reference Larson1984; Sancho & Kappen Reference Sancho and Kappen1989; Valladares et al. Reference Valladares, Ascaso and Sancho1993; Gauslaa & Solhaug Reference Gauslaa and Solhaug1998). Some studies of the light harvesting potential of lichens growing on rock surfaces have demonstrated the importance of the aspect of the rock surface on sunlight availability and the retention of water. Saxicolous lichen species show aspect-specific distributions, growth patterns and size-class frequencies (e.g. Armstrong Reference Armstrong1975, Reference Armstrong2002). For example, Monte (Reference Monte1993) reported the faster growth of lichens with Trentepohlia algae on northern aspects characterized by low light intensity and high humidity.
One of our objectives was to investigate the differences in the apothecium densities between two sympatric lichens inhabiting rock surfaces. The number of the environmental factors to be considered was controlled by choosing a suitable research site and by introducing modern statistical methodology. We collected apothecia data for two species in the Umbilicariaceae, Umbilicaria cylindrica and Lasallia pensylvanica, along alpine trails at altitudes >1560 m in northern Japan. Since the lichens at the research site are frequently hydrated by mists or condensation even during daytime in summer, we consider the confounding effects of light and hydration to be of low importance. By introducing a Bayesian approach (e.g. Clark et al. Reference Clark, Mohan, Dietze and Ibanez2003), we aimed to separate the factors of interest from the nuisance ones, such as unobservable characteristics of sampled rock faces. We have developed a new Bayesian model to predict the number of apothecia per thallus area, and an index of sky openness on the rock face where lichens were sampled.
Material and Methods
Study area
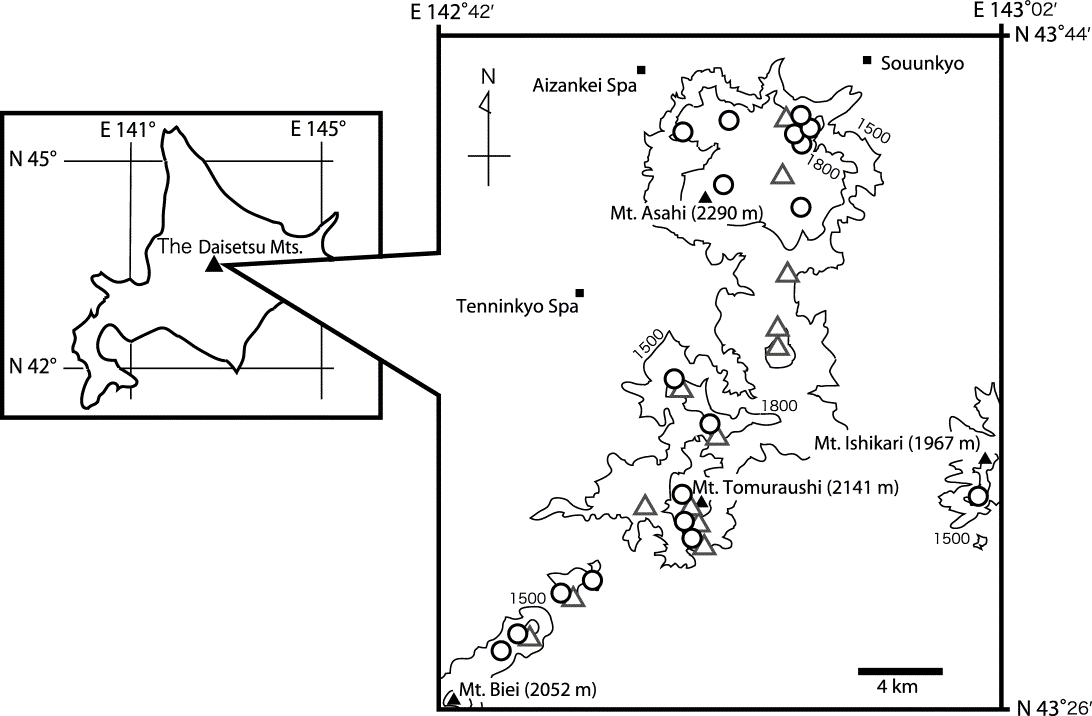
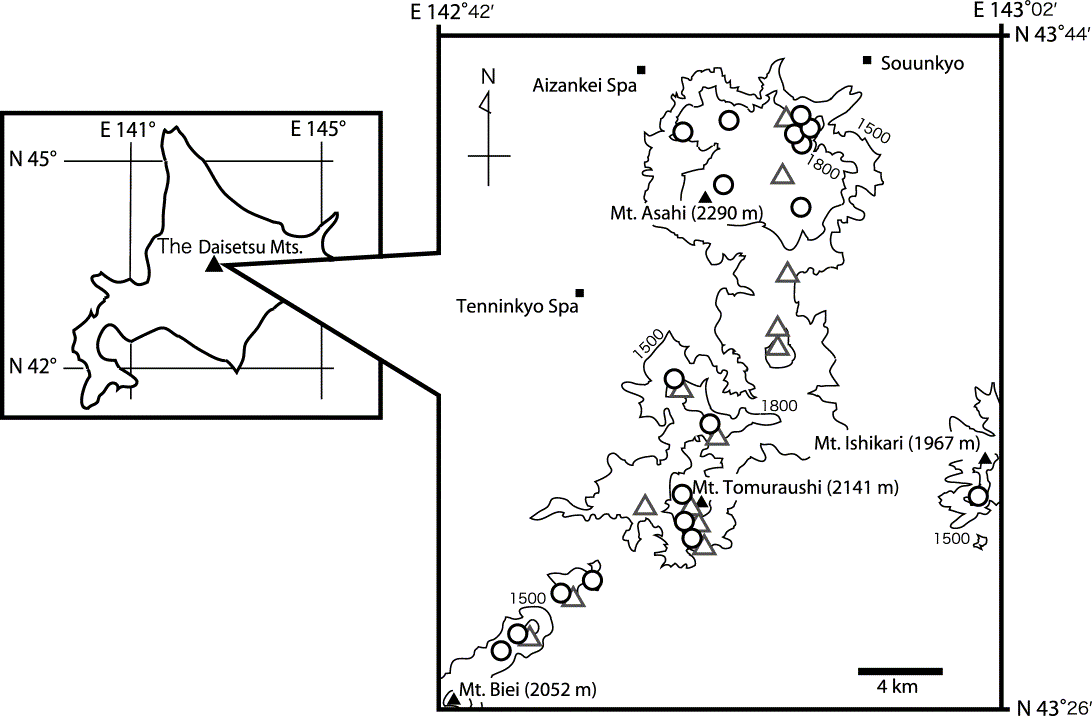
Field surveys were conducted during the summers of 2004 and 2006 in the Daisetsuzan National Park, Hokkaido, Japan (about N 43° and E 143°, Fig. 1). Elevations of the study sites ranged from 1560 to 2170 m, all above the timberlines (1200–1400 m). The area belongs to a volcanic chain with components of different geological ages and the sites comprised mostly volcanic boulders and alpine vegetation with patches of Pinus pumila scrub. Some areas around the active volcanoes, Mount Asahi and Mount Tokachi, have highly acidic environments (Katsui et al. Reference Katsui, Takahashi and Doi1953).The ground is under snow from the end of October until early May.
Location of the study area with 31 sampled boulders in the Daisetsuzan National Park, Hokkaido, Japan. A total of 396 specimens of Umbilicaria cylindrica was collected from 38 rock faces at 18 sites (○), and 222 specimens of Lasallia pensylvanica were collected from 25 rock faces at 13 sites (Δ).
Lichen species selected for study
Boulders in the study areas are mainly covered with arctic-alpine or circumboreal lichen species. Among saxicolous species, umbilicate lichens were regarded as suitable materials for sampling and measuring whole individual thalli. Umbilicaria caroliniana Tuck., U. cylindrica (L.) Delise ex Duby and Lasallia pensylvanica (Hoffm.) Llano are common, U. torrefacta (Lightf.) Schrad. occurs more in the acidic areas, and U. exasperata Hoffm. and U. deusta (L.) Baumg. are found occasionally in the study area (Shimizu et al. Reference Shimizu, Inoue and Moon2004). Since U. caroliniana rarely produces apothecia, whereas U. cylindrica and L. pensylvanica bear many apothecia but no soredia or isidia, the latter two species were chosen for the study. In phytogeographic terms, U. cylindrica belongs to the Alpine Element and L. pensylvanica belongs to the Eastern Asiatic-Eastern North American Disjunctive Group (Kurokawa Reference Kurokawa2006). Morphologically, U. cylindrica has variable, polyphyllous and curved thalli, whereas L. pensylvanica has monophyllous and plane thalli (Wei & Jiang Reference Wei and Jiang1993).
Sampling and measurement methods
The two lichen species were sampled on the surfaces of boulders along alpine trails throughout the National Park (Fig. 1). Boulders located under open sky conditions were randomly chosen if they had rock faces with individuals lichens growing on them. To avoid the influence of volcanic gases, which strongly affect the distribution and growth of lichens (Shimizu Reference Shimizu2004), we avoided boulders on which U. torrefacta was found. Umbilicaria torrefacta is an indicator species found on volcanic and acidic boulders in this area (Shimizu Reference Shimizu2004).
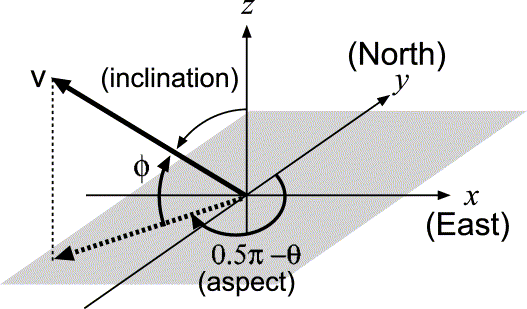
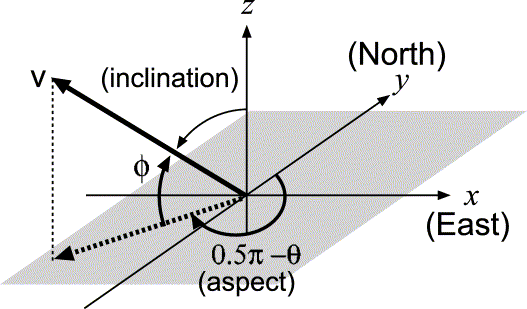
For each selected boulder, the elevation (m), aspect (0° to 360° from N, clockwise, Fig. 2), inclination (0° to 90°, Fig. 2) and height above the ground (cm) of each rock face where lichens were sampled were measured. Samples were taken from all the rock faces on most boulders; the number of individuals of various sizes sampled from each rock face was approximately ten. The size of the samples was sufficient to estimate the random effects of rock faces and individuals as described in the statistical modelling subsection. However, on a few rock faces, we decreased the sample number to preserve the local population. The dry weight (mg), surface area (cm2), number of apothecia and maximum size of apothecia of each sampled thallus were measured in the laboratory. The dry weight of each individual thallus was measured after drying the specimen for 1 week in a desiccator. The thallus surface area was measured using a 1 mm grid. Since thalli tended to be folded at the margins during specimen preparation, we divided the measured areas at folds and added these values together. The surface area was not the total area of each thallus but the light receptive surface area, particularly in the polyphyllous U. cylindrica. Apothecia were counted under a ×20–32 magnification microscope, counting only apothecia exhibiting a disk margin. The maximum diameter of the apothecia on each thallus was measured with a micrometer under the same microscope.
The coordinate system used for sky openness index (SOI) modelling. The x and y axes correspond to west-east and south-north axes, respectively. θ is the azimuth angle of the rock face on a two-dimensional polar coordinate system on the horizontal plane. ϕ is the slope of the rock face. 0.5π−θ and 0.5π−ϕ are equal to the aspect and inclincation angles of the rock face, respectively. v is a vector normal to the rock face (see Appendix).
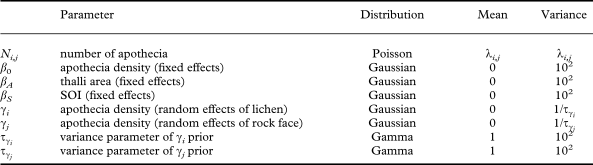
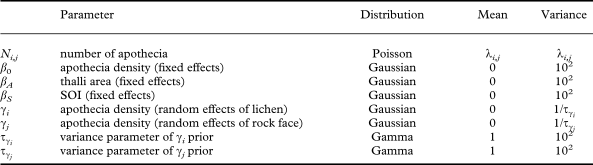
The definitions of prior distributions of parameters. The ‘distribution’ column shows the name of the probabilistic distribution used as the prior distribution for each parameter. The ‘mean’ and ‘variances’ columns show the means and variances of the posterior distribution, respectively.
Evaluating sky openness on rock faces
To evaluate sky openness for each rock face, an index referred to as the sky openness index (SOI) was developed that took into account both aspect and inclination (Fig. 2) of the rock face. The SOI is the degree of shading on the rock face due to aspect and slope of the rock itself. The index was incorporated into the statistical model described below to estimate whether the apothecium density increased or decreased due shading by the focal rock, e.g., a surface on the west side of a rock is shaded by the rock when the sun is in the east. Further details regarding the modelling of the SOI are shown in the Appendix.
Statistical analysis
A hierarchical Bayesian model was developed to estimate the effects of thallus area and the SOI on the number of apothecia taking into account random effects of lichen individuals and rock faces. As Johnson (Reference Johnson1999) discussed, most biological papers use tests of statistical significance that are, in fact, not significant at all. In the present study, the statistical model must take the random effects into account to be valid. It is, however, impossible to show how to construct a Bayesian model for all data in the paper. Therefore, we demonstrate the development and analysis of the Bayesian statistical model only to address the topic of interest, i.e. the observed number of apothecia.
We assumed that the number of apothecia of a lichen individual i and rock face j, Ni,j, followed the Poisson distribution of the mean λi,j as follows:

and the functional form of λi,j was assumed as:
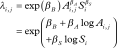
where βB is the base density of apothecia; Ai,j and βA are the thallus area (size) of individual i on rock face j and its exponent, respectively; Si and βs are the estimated SOI on rock face j and its exponent, respectively. The random effects of lichen individuals and rock faces were incorporated into the base density, thus the base density parameter βB is divided as βB = β 0 + γi + γj, where β 0 is the constant portion of apothecium density, and γi and γj are the random effects of lichen individual i and rock face j, respectively. The random effects, which represent unobservable effects of individual attributes and characteristics of rock faces, are incorporated as random variables in the linear predictor. This means that the median of the distribution of the number of apothecia is not changed but its variance is (Crawley, Reference Crawley2005). One of the important roles of the parameters for random effects is the modelling of overdispersion (Crawley Reference Crawley2005). In the modelling of apothecium density, overdispersion causes the estimate of the variance of the number of apothecia to be much larger than the expected estimate under a Poisson distribution. The overdispersed distribution of the apothecium number can be expressed by the convolution of the Poisson distribution and the normal distributions characterized by the random effect parameters in the model. Another role of the random effect parameters is the representation of the nuisance parameters such as elevation, microtopography around boulders and rock faces, and other unobservable/unobserved factors. This is particularly important in pseudoreplication situations where multiple samples (e.g. lichen individuals) are obtained from the same block (e.g. a rock face). Statistical analysis including random effects allows the effects of pseudoreplication to be taken into account (Crawley Reference Crawley2005).
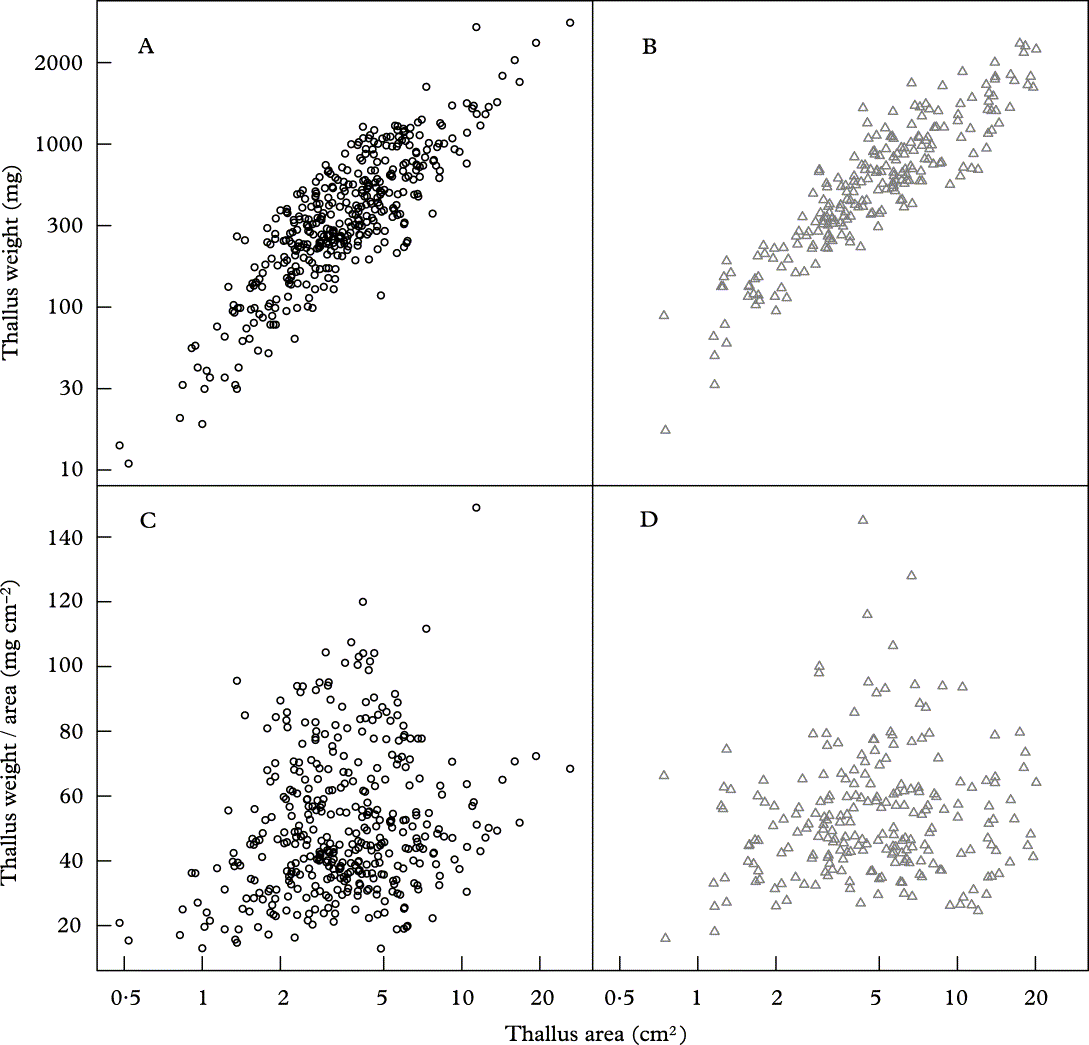
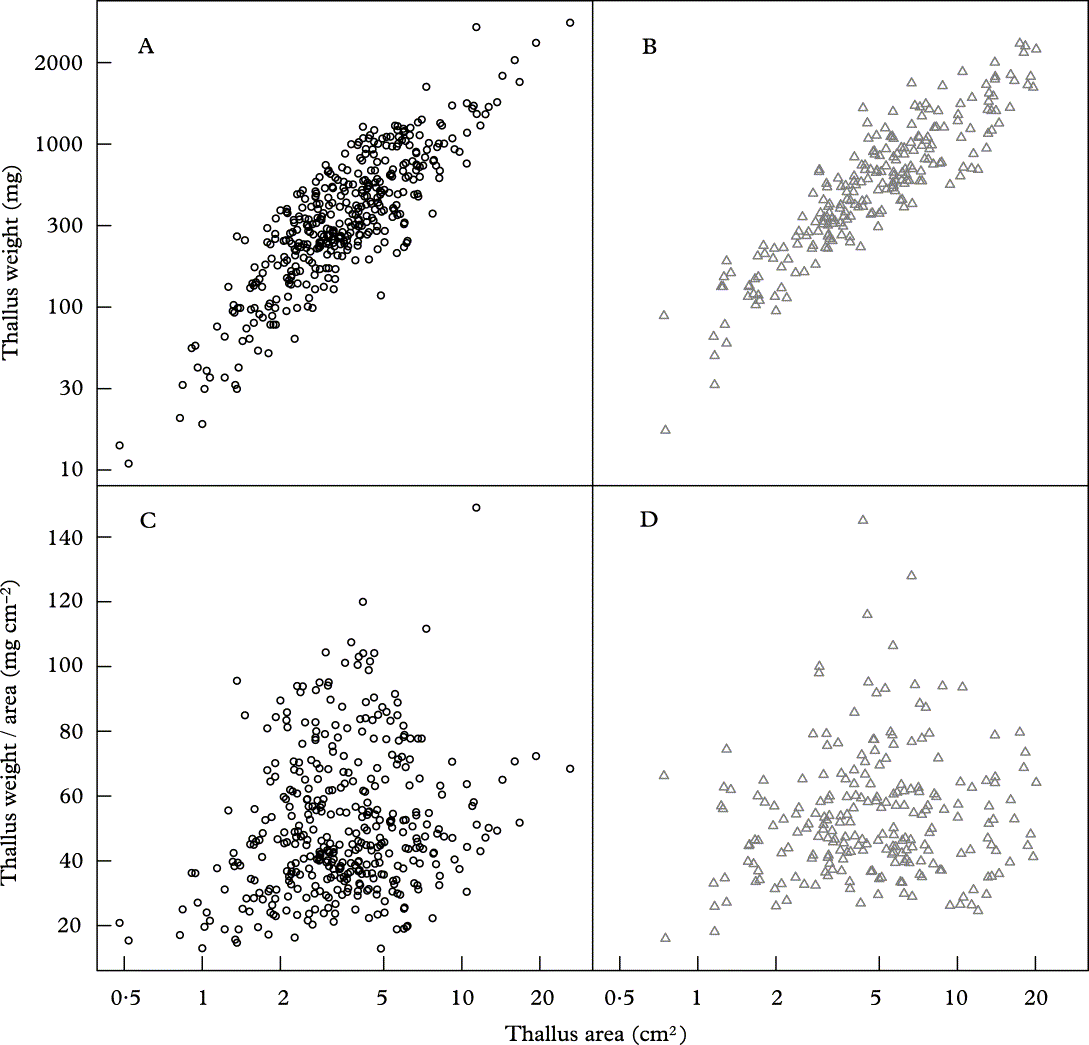
The relationship between thallus surface area and thallus weight (A & B) and thallus mass per unit area (weight / area)(C & D); A & C, Umbilicaria cylindrica (○); B & D, Lasallia pensylvanica (Δ). The x axes are log transformed in all cases, the y axes are log transformed in A and B.
The fixed effect parameters, β 0, β A, and β S were estimated independently for U. cylindrica and L. pensylvanica. The random effect of rock face j, γj, was assumed to be common to both species. As the number of parameters is too large for the maximum likelihood method to be used, we adopted a hierarchical Bayesian approach in which all parameters were expressed as posterior distributions estimated from a combination of observed data and prior distributions (e.g. Clark & Gelfand Reference Clark and Gelfand2006). The prior distributions used in the current model are shown in Table 1. An advantage of a hierarchical Bayesian modelling is that it overcomes the technical difficulties of the maximum likelihood estimation for a relatively large number of parameters. This is because we use direct sampling of posterior distributions of parameters (e.g. Clark & Gelfand Reference Clark and Gelfand2006) based on a given data set and a set of prior and hyperprior distributions. Another advantage is that prior distributions are also dynamically generated from appropriate non-informative hyperpriors to obtain better fits for the data.
Sampling from the posterior distributions of the parameters using Markov Chain Monte Carlo (MCMC) methods was performed with WinBUGS 1.4.2 (Spiegelhalter et al. Reference Spiegelhalter, Thomas, Best and Lunn2003) in the R2WinBUGS package (Sturtz et al. Reference Sturtz, Ligges and Gelman2005) in R 2.4.1 (R Development Core Team 2006). The posterior samples were obtained from three independent Markov chains in which 300 values were sampled with a 100 iteration interval after a burn-in of 30 000 iterations. The convergence of the Markov chains was evaluated with  (Gelman et al. Reference Gelman, Carlin, Stern and Rubin2003) for each parameter by comparing the variance within each chain and among chains. All source code files were written in R and BUGS languages and the entire data set used in the current estimation can be downloaded from http://hosho.ees.hokudai.ac.jp/~kubo/r/lichen/.
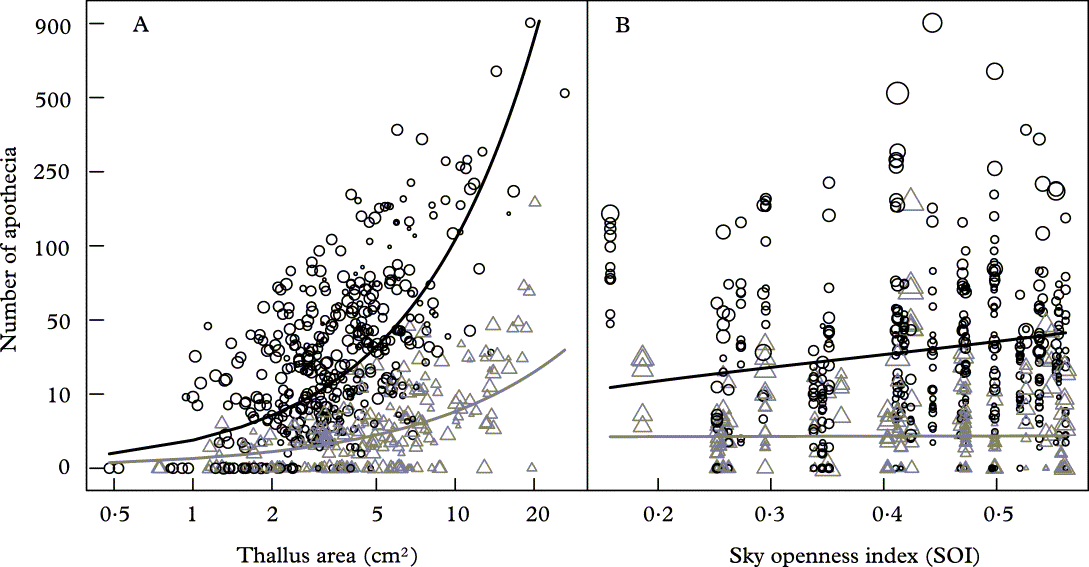
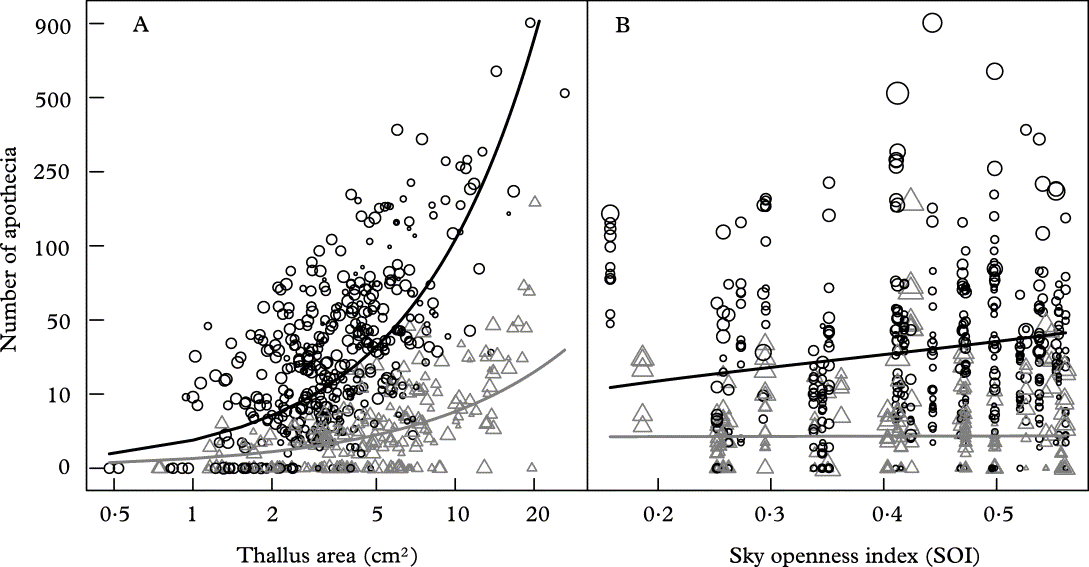
The relationship between the number of apothecia and thallus surface area (cm2, note log scale) (A) and the estimated sky openness index, SOI (B) in Umbilicaria cylindrica (○) and Lasallia pensylvanica (Δ). The x and y axes are log and square root transformed, respectively. The curves are the prediction of mean apothecium number by fixing the SOI in (A) and thallus area (B) to their population mean values, respectively. The size of the symbols represent SOI and thallus area in A and B, respectively.
Results
A total of 396 thalli of U. cylindrica were collected from 38 rock faces on 18 boulders, and 222 thalli of L. pensylvanica were collected from 25 rock faces on 13 boulders. In U. cylindrica, the mean thallus surface area and mean thallus weight were 4.12 cm2 (range 0·480–26·2 cm2) and 217 mg (range 8·00–1790 mg), respectively, whereas those for L. pensylvanica were 5·92 cm2 (0·74–20·1 cm2) and 320 mg (12·0–1390 mg), respectively. The allometric relationships between the thallus area and weight for each species are shown in Fig. 3A & B. Although we did not apply detailed Bayesian modelling to analyze the relationships, we can reach two conclusions about the relationships. First, the data set of the log of thallus area and weight is not a random sample from the bivariate normal distribution for which covariance elements are considerably positive. Second, there is no great difference in the allometric exponent between the two species in the log-log plot. In other words, these two species were similar in their dependencies of thallus mass per unit area (mg cm−2) on thallus area (Fig. 3 C & D). Similarly, in both species, the variance of thallus mass per unit area increased when thallus area increased (Fig. 3C & D).
The mean number of apothecia increased as thallus area increased (Fig. 4A). Umbilicaria cylindrica produced many apothecia on smaller thalli, whereas L. pensylvanica produced fewer late-developing apothecia on larger thalli. The mean number of apothecia per thallus and mean maximum apothecium size per thallus for U. cylindrica were 88·2 (range 0–903) and 1·25 mm (range 0·220–2·18 mm), respectively, whereas those in L. pensylvanica were 15·2 (0–321) and 1·59 mm (0·300–3·33 mm), respectively. The relationships between the SOI and the number of apothecia for the two species are shown in the Fig. 4 B. Since the thallus size reliably predicted the number of apothecia, the effects of the SOI and the differences between the two species appeared to be hidden by the effects of the differences in thallus size between the lichens. The curves in Fig. 4 B, however, indicate the effects of the SOI on the mean number of apothecia under mean thallus size. These are based on the posterior distributions of the parameters of the hierarchical Bayesian model, which are described later.
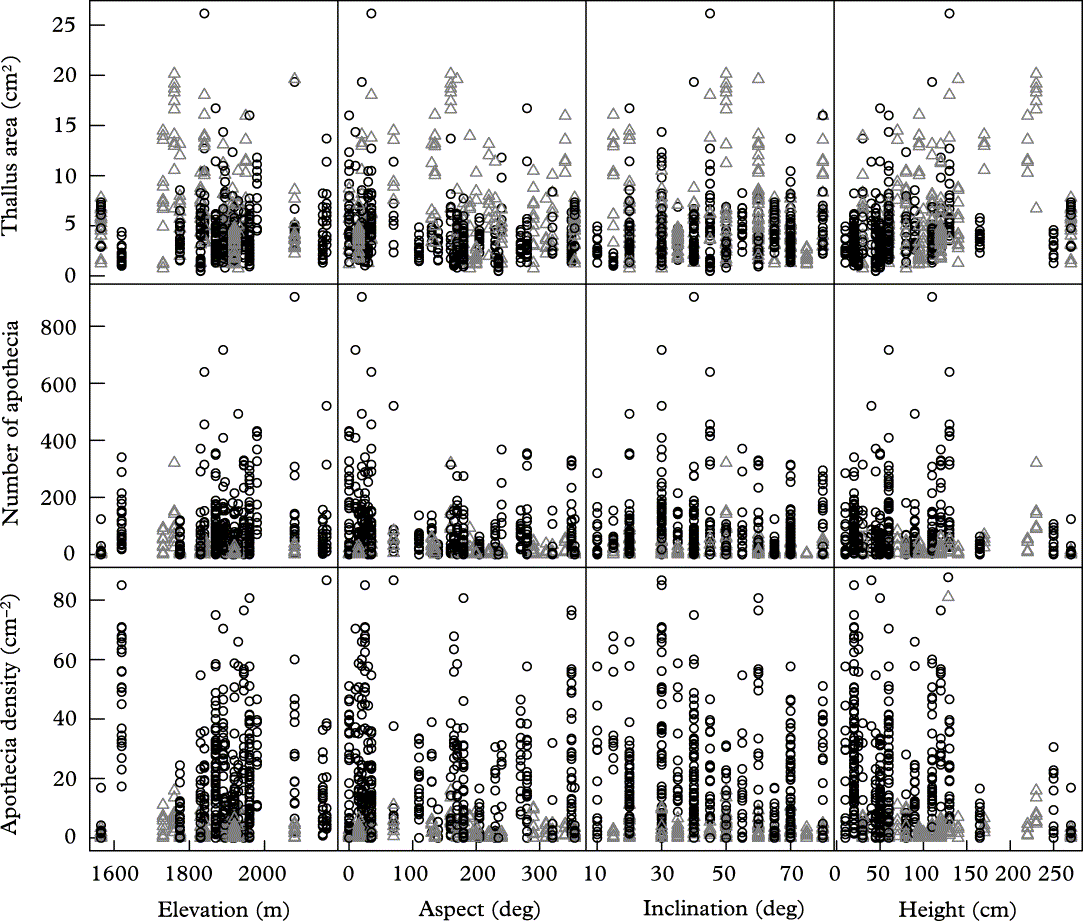
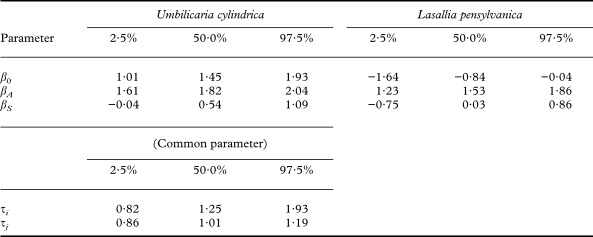
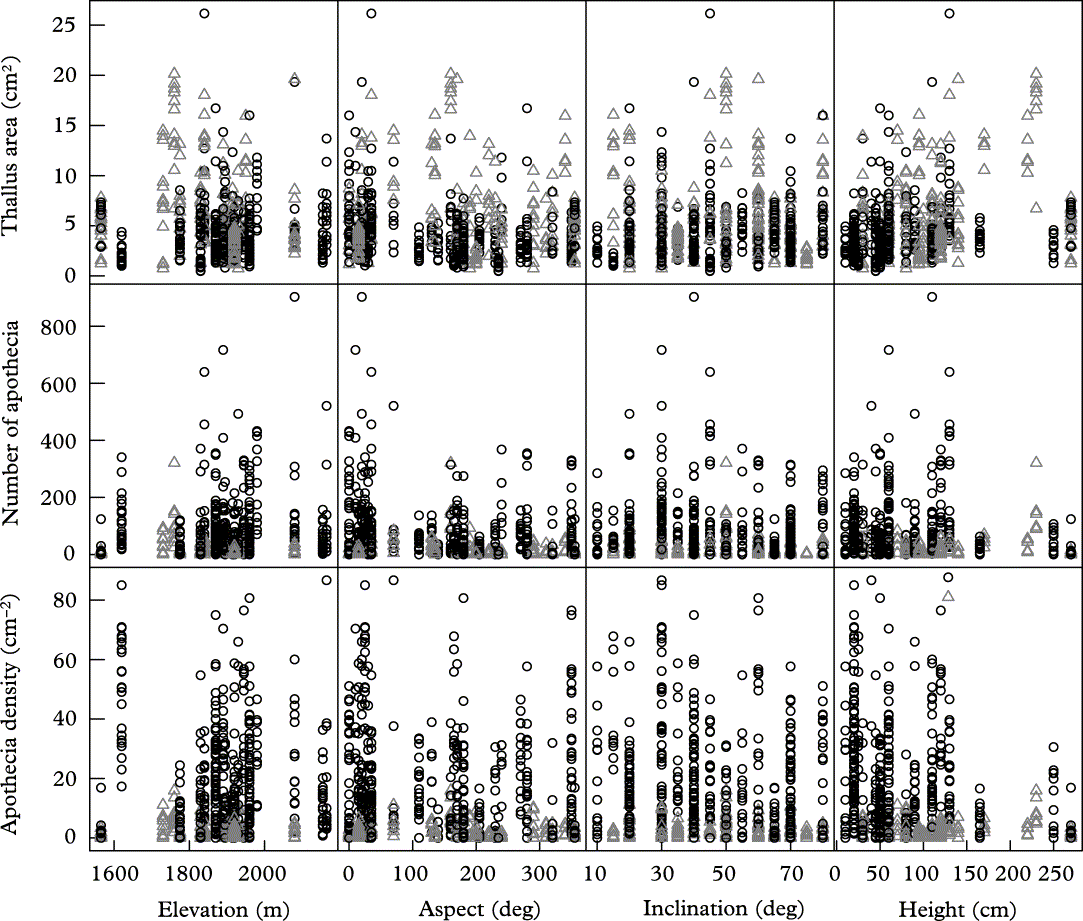
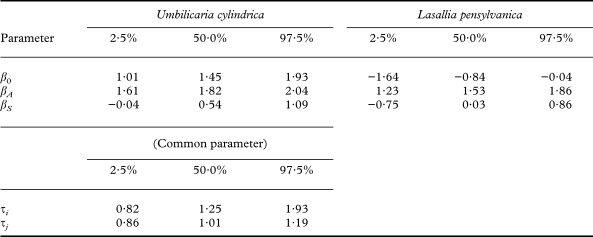
We prepared Fig. 5 to demonstrate the difficulties in predicting the number of apothecia using simple regression analyses of measurements of elevation, aspect, inclination and height of rock faces, because the data were heteroscedastic for continuous measurements and were overdispersed for countable measurements. Aspect and inclination of rock faces were used in the evaluation of the SOI, whereas elevation and height represented some of the random effects of rock faces, γi. The median of the variance parameters of the random effects derived from rock faces, γi, and lichen individuals, γj, were 1·01 and 1·25, respectively (Table 2).
Scatter diagrams of environmental factors [elevation (m), aspect of the rock face (0° to 360° from N, clockwise), inclination of the rock face (0° to 90°) and height above the ground (cm)] and thallus surface area, number of apothecia, and apothecium density; Umbilicaria cylindrica (○), Lasallia pensylvanica (Δ).
The posterior distributions of parameters of fixed effects and variances. The quantiles (2·5%, 50%, and 97·5%) of posterior distributions are shown.
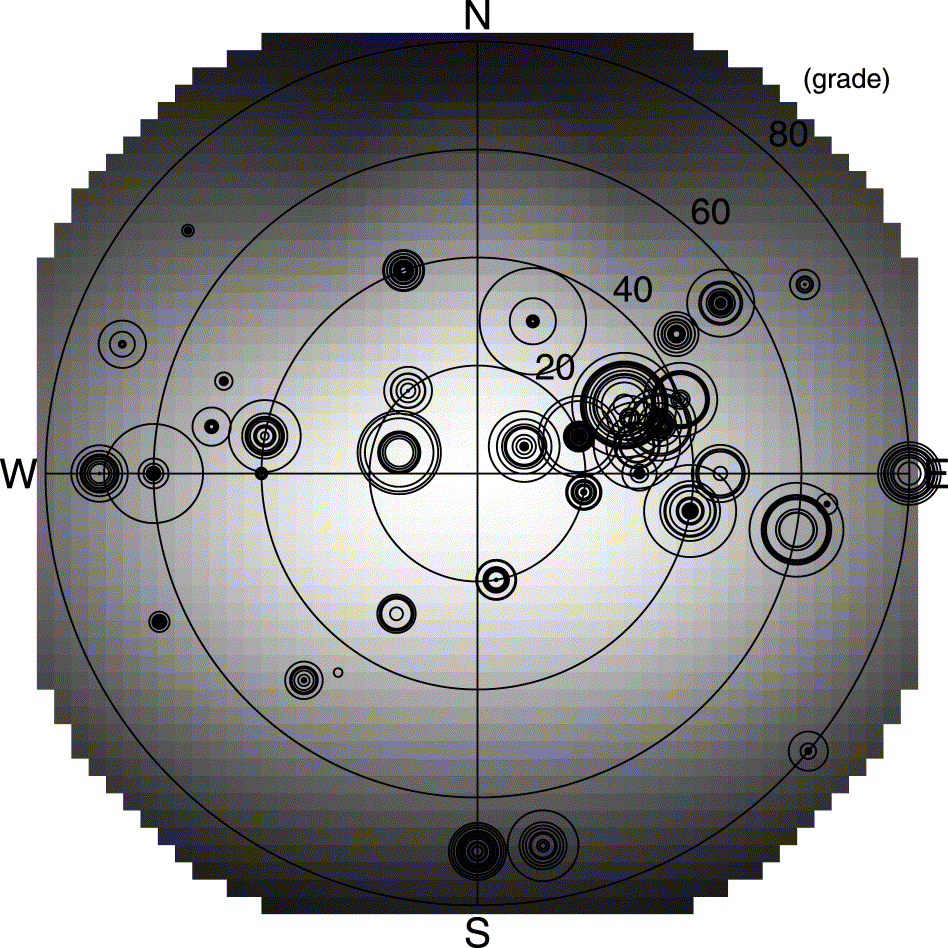
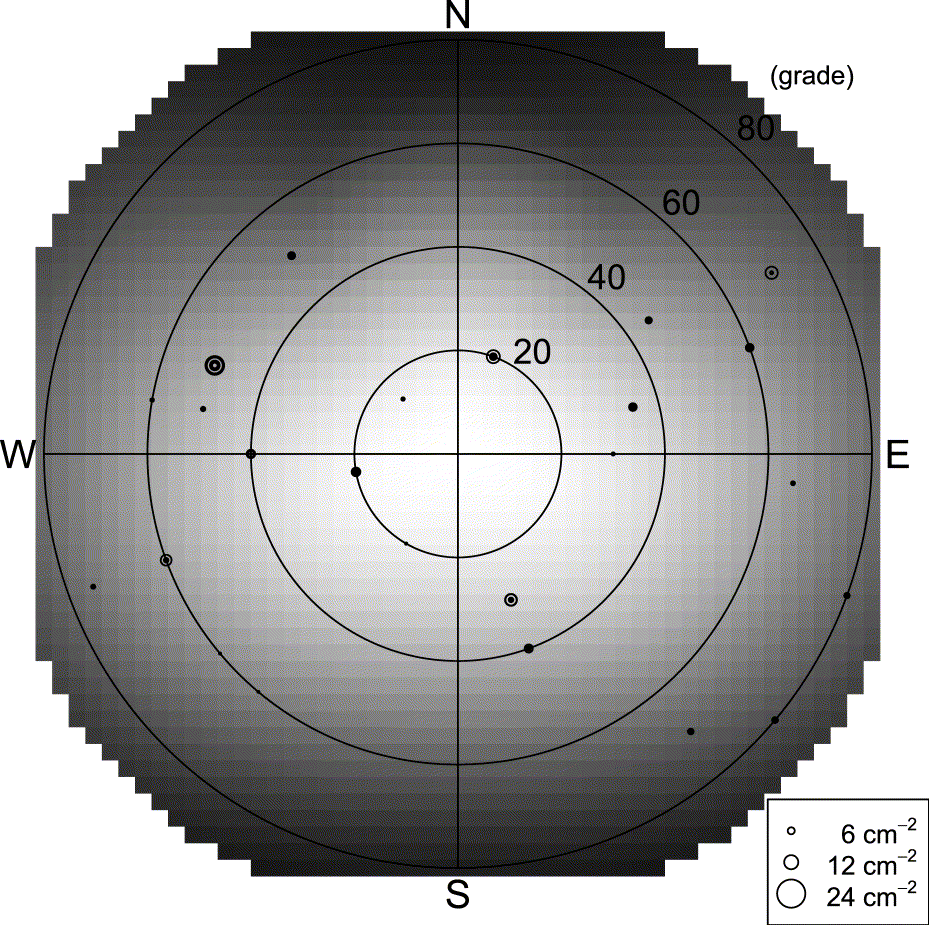
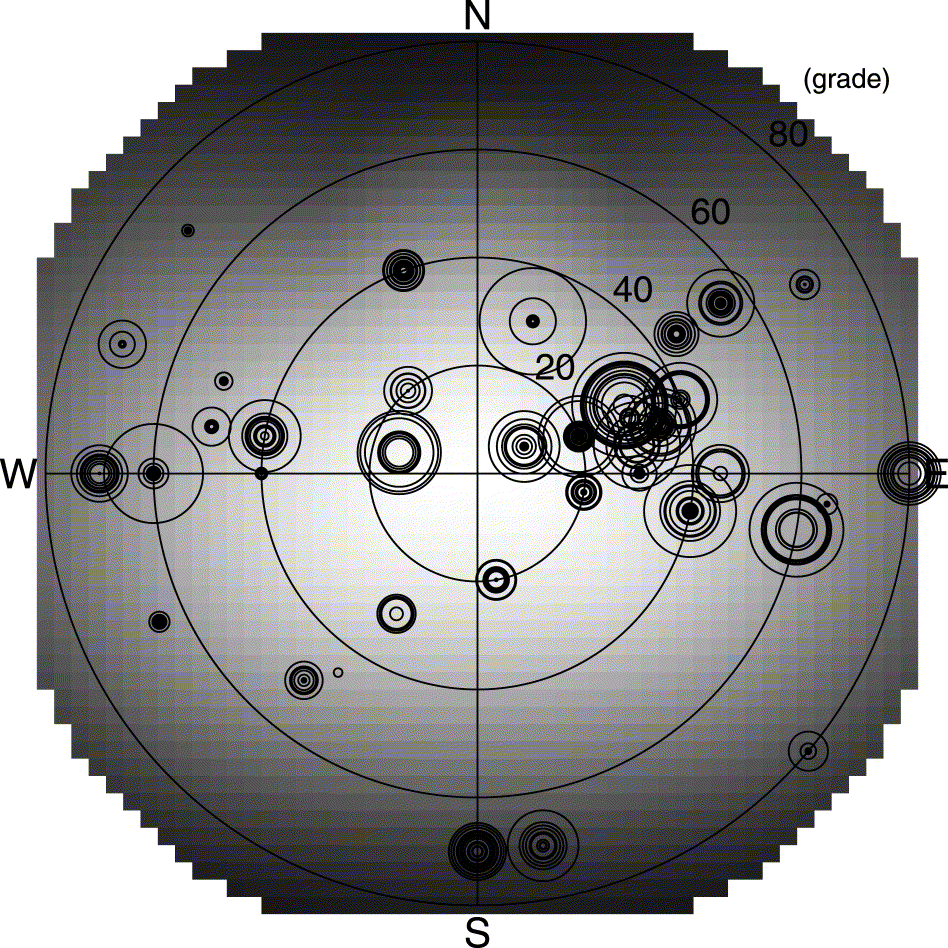
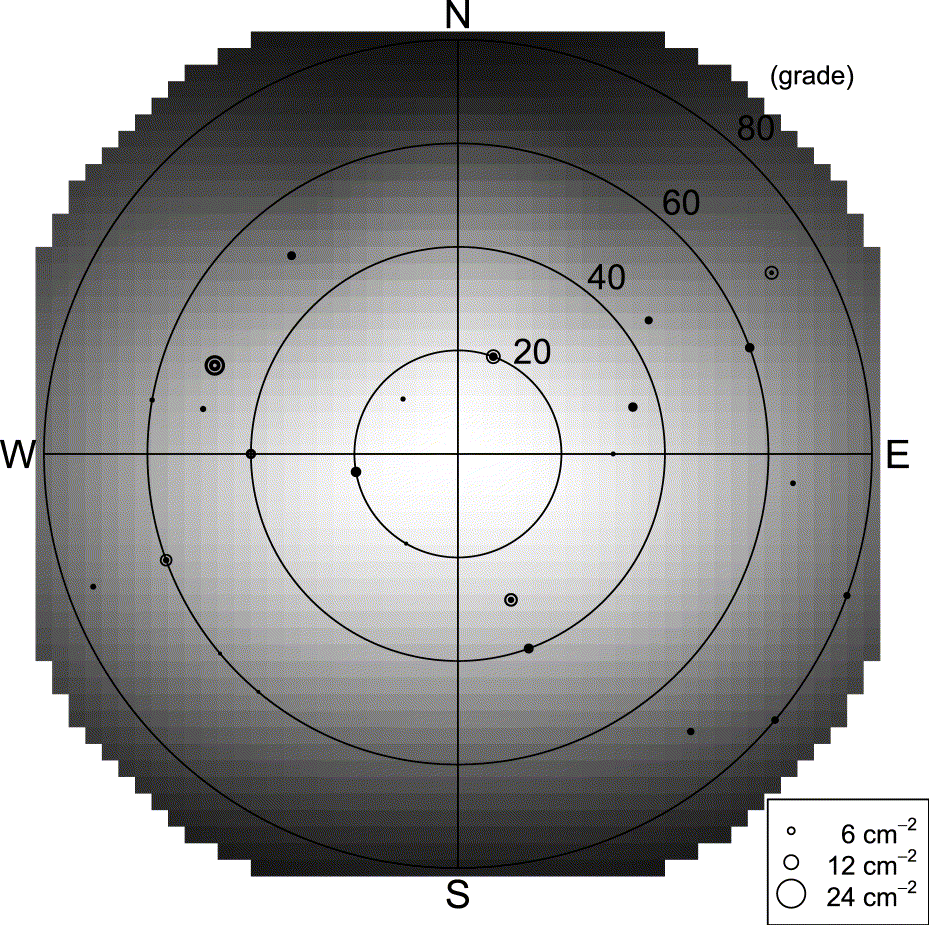
The distributions of thalli on the boulders are shown in Figs 6 & 7 where the SOI distribution is indicated by shading. Since the rock face inclination becomes smaller near the centre of each figure, the SOI values increase towards the centre. The SOI values on inclined rock faces did not differ greatly with aspect. Both species were found in various SOI environments. However, in U. cylindrica (Fig. 6), the distribution of sampled thalli was not random, although there was no method to characterize the distribution. For L. pensylvanica (Fig. 7), we could not examine whether the distribution was random or not because the number of samples was too small. The relationship between the SOI and apothecium density (diameter of each species circle in Figs 6 & 7) was obscure in both species.
The relationship between the distribution of Umbilicaria cylindrica and aspect and inclination of the rock face on boulders. Each concentric circle indicates thalli collected from the same rock face and the centre of each circle indicates aspect (0° to 360° from N, clockwise) and inclination (0° to 90°) of the rock face sampled. The radius of each circle is proportional to the density of apothecia on each thallus; the shading becomes darker as the SOI value decreases. The range of SOI values evaluated on all possible rock faces was 0·158–0·568. For key see Fig. 7
The relationship between the distribution of Lasallia pensylvanica and aspect and inclination of the rock face on boulders. For further explanation see legend for Fig. 6
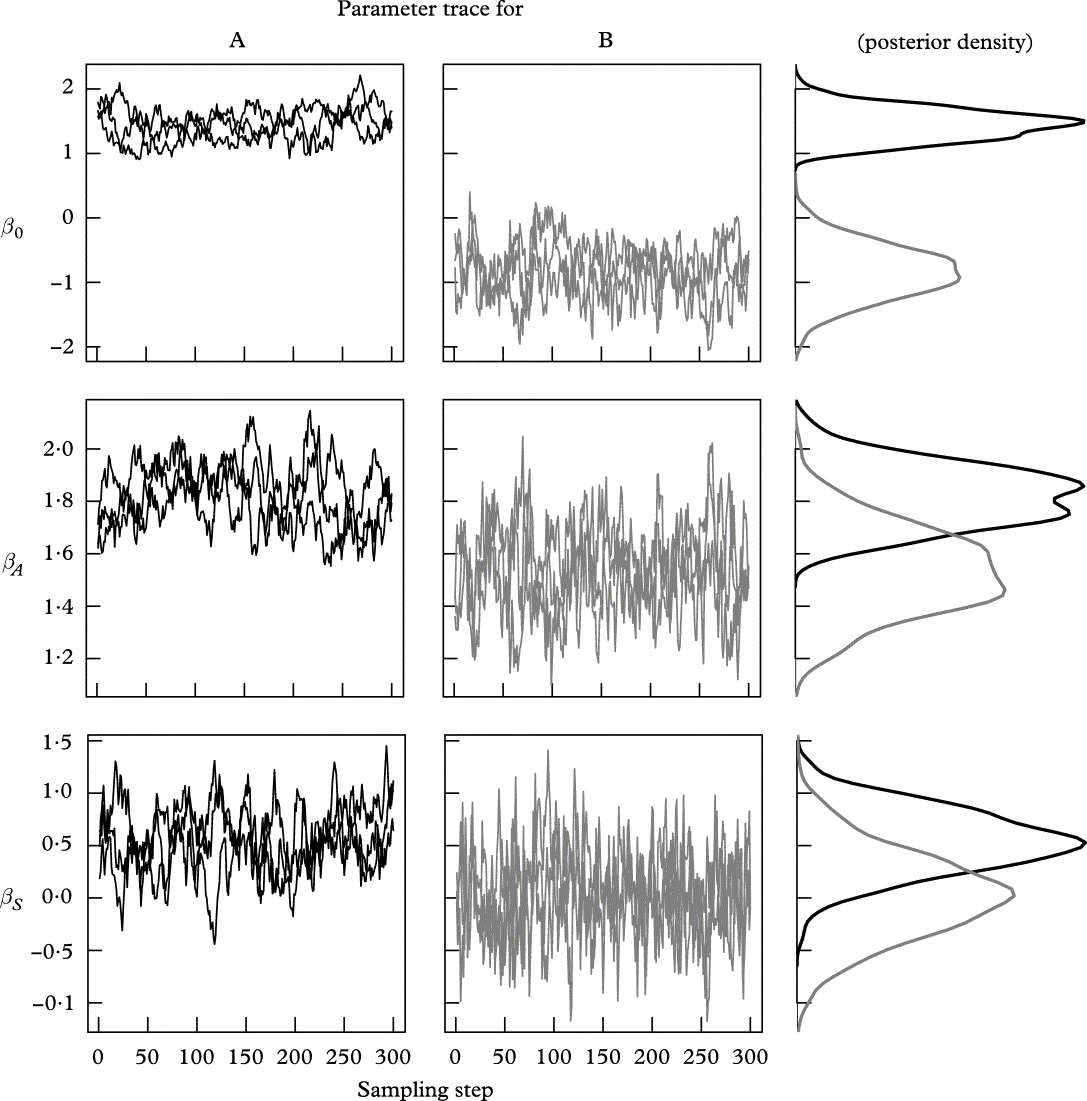
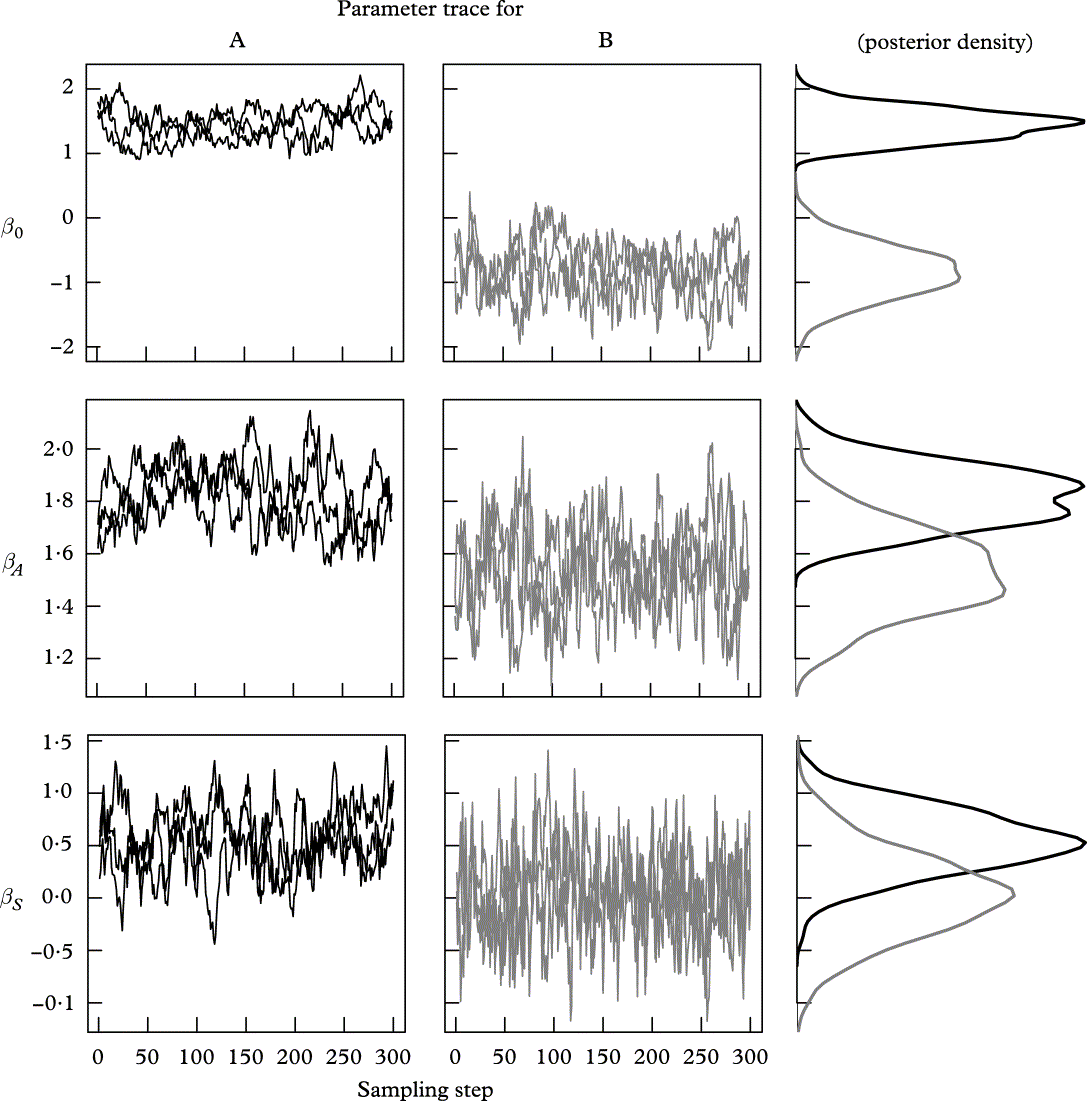
The estimates or parameters in the hierarchical Bayesian model based on apothecium number are listed in Table 2 and Fig. 8. All
estimates for parameters were so close to unity that the Markov chains for all fixed and random effect parameters were sufficiently converged. The medians of posteriors of all fixed effect parameters (β 0, βA, and βS) for U. cylindrica were larger than those of L. pensylvanica. The medians of the exponent of thallus area, βA, 1·82 and 1·52 for U. cylindrica and L. pensylvanica, respectively, were significantly larger than unity. Most samples obtained from the posterior distribution of the SOI effect on apothecium density, βS, for U. cylindrica were positive (median βS = 0·54, Table 2 and Fig. 8), but the 95% confidence interval [−0·04, 1·09] included zero. On the other hand, the medians of the posterior βS for L. pensylvanica were almost zero. (median βS = 0·03, Table 2, Fig. 8). In short, we determined that the apothecium density of U. cylindrica depended on thallus size and, possibly, on the SOI, while that of L. pensylvanica depended only on thallus size.
Traces of the Markov chains and the posterior densities of the fixed effect parameters in the hierarchical Bayesian analysis. A, Umbilicaria cylindrica; B, Lasallia pensylvanica.
Discussion
We have demonstrated differences in the relationship between the number of apothecia and thallus area between two sympatric lichens, Umbilicaria cylindrica and Lasallia pensylvanica, using a new statistical model for apothecium density. The model suggested that there may be species-specific responses to light conditions on rock faces. These results were based on hierarchical Bayesian modelling taking into account the effects of nuisance factors or the unobserved factors of rock faces and individual lichens.
By evaluating the posterior distributions of βA (Table 2, Fig. 8), we concluded that the relationships between thallus area and the number of apothecia were allometric rather than isometric for both species. This was because the exponents of the log of thallus area were significantly larger than unity, i.e. apothecium density increased as the thallus area increased. Our results regarding the modelling of the apothecium density support exponential (Pringle et al. Reference Pringle, Chen and Taylor2003) and allometric (Jackson et al. Reference Jackson, Clair and Eggett2006) rather than linear formulation (Ramstad & Hestmark Reference Ramstad and Hestmark2001).
Statistical analysis in the present study detected large random effects derived from rock faces and lichen individuals (Table 2). We propose that Bayesian modelling, which takes into account these random or nuisance factors, is required to properly estimate fixed effects such as thallus area and the SOI in statistical analyses of field data. In the mixed modelling of fixed and random effects, the parameters of random effects were assumed to include the effects of elevation and height of rock faces (Fig. 5).
A difference was detected between the two sympatric lichens in the response of apothecium density both to thallus area and SOI. As shown in Fig. 4 A, the response of the apothecium number to thallus area was much more sensitive in U. cylindrica than in L. pensylvanica because of differences between these two species in the log of base apothecium density, β 0, and the exponent of thallus area, βA (Table 2, Fig. 8). However, it is difficult to assess the reproductive allocation for these lichens because the sizes of their apothecia differ. The apothecia of U. cylindrica, which has a higher apothecium density, are smaller than those of L. pensylvanica, which has a lower apothecium density. Therefore, we discuss only the response of the apothecium number to thallus area and SOI.
There are several possible physiological explanations for the observed positive relationship between apothecium density and thallus area. Dahlman and Palmqvist (Reference Dahlman and Palmqvist2003) suggested that thallus growth in two foliose tripartite lichens was influenced by a greater water-holding capacity of large thalli and a similar effect is probably important in the growth of U. cylindrica and L. pensylvanica. Although we did not measure water relationships, we believe that an advantage of a large thallus is a higher water-holding ability. This is consistent with Gauslaa & Solhaug (Reference Gauslaa and Solhaug1998) who reported differences in desiccation rate depending on the thallus area. They concluded that the improved water-holding capacity of larger thalli was mainly a result of a thicker hypothallus. In the umbilicate lichens at our research site, a greater ability to retain water during desiccation may increase as the thallus area increases because the mean thallus mass per unit area (mg cm−2) tends to increase as thallus area increases (Fig. 3 C & D). Umbilicate lichen thalli have comparatively high water holding capacities and high tolerance to osmotic stress (Harrissson et al. Reference Harrison, Walton and Rothery1989; Hájek et al. Reference Hájek, Barták and Dubová2006). There are also lichens that are sensitive to desiccation that maximizes their photosynthetic rate in dim light (e.g. Lange Reference Lange2003; Gauslaa et al. Reference Gauslaa, Lie, Solhaug and Ohlson2006).
Before discussing the light response of lichens, we describe biological interpretations of the effects of the SOI as defined for this study. The SOI, which indicates the degree of sky openness, is weighted by the solar trajectory or the lack of local shading from the same boulder. It does not indicate cumulative irradiance because the daily change of solar radiation is not incorporated. Although Dahlman & Palmqvist (Reference Dahlman and Palmqvist2003) stressed the importance for thallus growth of light intensity under wet conditions, we did not define the SOI as such a conditional index. This is because of the highly unpredictable hydration regime at the alpine research site. The boulders in the alpine area are frequently hydrated by mists or condensation during daytime in summer, while thalli can be desiccated even in the early morning.
The response of the number of apothecia to the SOI, βS, differed between the two species (Table 2, Fig. 4 B, Fig. 8). However, both species were distributed on rock faces with various SOI levels (Figs 6 & 7). The apothecium density of U. cylindrica probably increased on unshaded rock faces whereas that of L. pensylvanica did not respond to the SOI. It is noteworthy that the SOI is an explanatory variable of apothecium density despite its very simplified definition as an index of the sky openness. This result suggests that U. cylindrica increases photosynthetic rate as the SOI increases. Species differences in plasticity are possibly caused by differences in the maximum photosynthetic rate or water-holding capacity. In other words, L. pensylvanica may be sensitive to the negative effects of the SOI such as photoinhibition and desiccation. However, we found no evidence of negative effects from evaluating the posterior distribution of βS.
We thank the Japanese Environmental Agency and the Agency for Cultural Affairs for permission to collect lichens from the Daisetsuzan National Park. The authors are grateful to two anonymous reviewers for their helpful comments.
Appendix. Modelling of sky openness
The coordinate system used in sky openness index (SOI) modelling is shown in Fig. 2 in which the x and y axes correspond to west-east and north-south axes, respectively. In the coordinate system, all vectors are defined as follows:
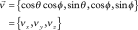
and are always normalized (i.e. vx + vy + vz = 1). Hence, the normal vector of a rock face  is defined using measurements of aspect and the inclination of the rock face:

where both θf and ϕf are converted from the aspect (d) and inclination (g) of the rock face so that θf = 0.5π − d θf = 0.5π − g. Note that the unit of angle in the coordinate system is radians.
In the model, time t in a day is defined as an angle, the range of t is from −0·5π to +1·5π. Giving some examples of time angles, t = {−0·5π, 0·5π, π} correspond to midnight, noon, and 6 pm, respectively. By using the time angle, the direction vector of the sun at time t is defined as:

The day of the year is also expressed by angle ad in the range [−0·13π, 0·13π]. For example, ad = 0 for spring and autumn equinox days and ad = 0·13π (equal to the rotation angle of the axis of the earth) for the summer solstice day. Suppose  is the direction vector of the ecliptic observed on the equator at time t. The elements of the vector are {r cos t, ye, r sin t} where ye = cos ad and
 . The ecliptic vector observed from latitude L N,
 , can be derived by transforming
 . By setting
 , the elements of are derived as:

where  and θL = arccos(ey/ry,z)+L (if ad > 0).
Suppose the angle between the rock face and the sun, α(t), is derived as follows:

where is the normal vector of a rock face, is the sun direction, and the binary operator “a * b” generates the inner product of a and b. Note that both and a are normalized. Since the cos α(t) does not include the daily change of the intensity of solar irradiance, the SOI is defined as the sum of the total exposure time of the rock face weighted by solar trajectory, that is:

where ws(SL(t)) is a function that is unity if the sun is over the horizon (i.e. SL(t) > 0, daytime), otherwise zero; w α(α(t)) is defined as cos α(t) if, 0 ≤ α(t) ≤ 0.5π, otherwise zero because the sun cannot be seen from the rock face when it is behind it. We evaluated SOIs for all observed rock faces by fixing ad = 0·13 π (the summer solstice day) and L = 0·239π (latitude 43° N) for the appropriate model for lichen growth in the area.