Recent studies at the interface between oral and written language have examined the influence of orthography on first language (L1) speech production (e.g., Bi, Wei, Janssen, & Han, Reference Bi, Wei, Janssen and Han2009; Damian & Bowers, Reference Damian and Bowers2003; Han & Choi, Reference Han and Choi2016; Zhang & Damian, Reference Zhang and Damian2012). These studies have yielded mixed results revealing that orthographic effects vary according to the nature of the task. For instance, Roelofs (Reference Roelofs2006) examined the effect of spelling inconsistency in Dutch in three tasks: oral reading, object naming, and prompt-response word generation. This allowed the author to observe whether the effect of spelling consistency could be attributed to the nature of the task being performed or whether it directly constrained spoken word production. Results demonstrated that the spelling consistency effect was present only in oral reading (i.e., a task in which spelling is relevant). Reading tasks require access to orthographic properties via the processing of the orthographic input. Therefore, Roelofs’s (Reference Roelofs2006) findings suggest that orthographic effects are constrained by the task. Task effects might have prevented firm conclusions to be drawn on this issue. A new approach in the word learning domain was adopted by some researchers in order to examine the orthographic influence on speech production (Rastle, McCormick, Bayliss, & Davis, Reference Rastle, McCormick, Bayliss and Davis2011).
The word learning paradigm is based on the results of recent research demonstrating that adults can learn new words orally, and that after a one-night consolidation period (Dumay & Gaskell, Reference Dumay and Gaskell2007), these new words are stored in the mental lexicon (Bowers, Davis, & Hanley, Reference Bowers, Davis and Hanley2005; Gaskell & Dumay, Reference Gaskell and Dumay2003; Merkx, Rastle, & Davis, Reference Merkx, Rastle and Davis2011). Consequently, they come to behave like known words in psycholinguistics tasks.
Using the word learning paradigm, several studies have demonstrated a significant orthographic effect (Bürki, Spinelli, & Gaskell, Reference Bürki, Spinelli and Gaskell2012; Chevrot, Beaud, & Varga, Reference Chevrot, Beaud and Varga2000; Rastle et al., Reference Rastle, McCormick, Bayliss and Davis2011), with orthographic input allowing existing phonological representations to be modified. For instance, Bürki et al. (Reference Bürki, Spinelli and Gaskell2012) studied the influence of orthographic input on speech production through phonological variation in French. Words affected by this phenomenon have two phonological variants: one that corresponds to the orthographic form (e.g., médecin pronounced [mεdǝsɛ̃]) and one that does not (e.g., médecin pronounced [mεdsɛ̃]). Participants were asked to learn the auditory association between novel French words and corresponding pictures of nonexistent objects over 4 days. All the novel words were reduced variants of schwa words (e.g., rvinche, /ᴚvɛ̃ʃ/). Then, the orthographic form of the French novel word was only once presented. Half the participants saw the orthographic form with the letter e (e.g., revinche, /ᴚǝvɛ̃ʃ/), and the other half saw the orthographic form without it (e.g., rvinche, /ʁvɛ̃ʃ/). Results showed that participants modified their existent phonological representation of the learned novel words after exposure to the orthographic forms. Participants exposed to the orthographic form containing the letter e produced the schwa variant in a picture-naming task, even though they had always heard the variant without the schwa.
The influence of orthography has also been demonstrated on second language (L2) speech production. In recent years, a great deal of research has examined the influence of orthographic forms on L2 phonology in a variety of languages and populations. Orthography has been widely shown to influence L2 perception and/or word form learning. Orthography can have a facilitating (e.g., Showalter & Hayes-Harb, Reference Showalter and Hayes-Harb2013), mixed (e.g., Detey & Nespoulous, Reference Detey and Nespoulous2008; Escudero, Reference Escudero2015), negative (e.g., Bassetti, Reference Bassetti2017; Hayes-Harb, Brown, & Smith, Reference Hayes-Harb, Brown and Smith2018; Mathieu, Reference Mathieu2016; Showalter, Reference Showalter2018) or null (Simon, Chambless, & Kickhöfel Alves, Reference Simon, Chambless and Kickhöfel Alves2010) effect.
The specific influence of orthography on L2 speech production is a relatively new question, even if the literature goes back as far as Young-Scholten, Atika, and Cross’s (Reference Young-Scholten, Akita, Cross, Robinson and Jungheim1999) study. Bassetti (Reference Bassetti, Thorsten and Young-Scholten2008) was the first to propose a review of the literature on orthographic effects on L2 speech production. More recently, in 2015, Applied Psycholinguistics published a Special Issue on this topic, and Katharina Nimz (Reference Nimz2016) published her thesis on the influence of orthography on sound perception and production in a foreign language. Results are mixed, as orthographic effects on speech production can be either positive (e.g., De Martin, Reference De Martin2013; Erdener & Burnham, Reference Erdener and Burnham2005; Rafat, Reference Rafat2015; Steele, Reference Steele2005) or negative (e.g., Bassetti & Atkinson, Reference Bassetti and Atkinson2015; Young-Scholten & Langer, Reference Young-Scholten and Langer2015). For instance, in a repetition task, Erdener and Burnham (Reference Erdener and Burnham2005) tested the effect of orthography on nonnative speech in adults. Turkish and Australian English monolingual participants were tested on their production of Irish and Spanish nonwords in a repetition task in four conditions: auditory-only, auditory-visual, auditory-orthographic and auditory-visual-orthographic. Participants performed significantly better, that is, their pronunciation was more accurate, in orthographic conditions compared to auditory conditions for both groups. For example, Turkish participants registered a significantly lower rate of Spanish bilabial confusion ([b] vs. [p]) in the orthographic conditions than in the auditory conditions. This study demonstrated the positive effect of orthography, facilitating L2 speech production.
By contrast, Bassetti and Atkinson (Reference Bassetti and Atkinson2015) showed the negative effect of orthographic forms on L2 speech production. Among other things, they showed that the availability of the written input led advanced Italian learners of English to pronounce silent letters. For example, the English word lamb /lᴂm/ was produced as [lᴂmb]. Two tasks were performed: a reading task and a repetition task in which auditory input was given after the disappearance of the written input. Results revealed that an extra phoneme was produced by 85% of participants in the reading task and by 56% of participants in the repetition task.
Whereas a large body of research has demonstrated the influence of orthography on L2 speech production, there is no consensus as to the nature of this influence, as it can be either positive or negative. The negative influence of orthography on L2 speech production has been demonstrated in two cases: in the presence of written input (e.g., Bassetti & Atkinson, Reference Bassetti and Atkinson2015; Browning, Reference Browning2004; Rafat, Reference Rafat2013), via the application of L1 grapheme-to-phoneme conversion (GPC) rules, or in the absence of the orthographic input (e.g., Bassetti, Reference Bassetti, Guder, Jiang and Wan2007, Reference Bassetti2017; Young-Scholten & Langer, Reference Young-Scholten and Langer2015), via the activation of L2 phonological representations, which have been restructured during the exposure to the written information at the beginning of L2 acquisition. Conversely, the positive influence of orthography has been observed when written and auditory input are combined (simultaneously presented), in a repetition task (e.g., Erdener & Burnham, Reference Erdener and Burnham2005; Steele, Reference Steele2005) or in a picture-naming task (e.g., Rafat, Reference Rafat2015). Moreover, the studies of Steele (Reference Steele2005) and Erdener and Burnham (Reference Erdener and Burnham2005) show that the positive influence of orthography on L2 speech production is stronger when L1 and L2 have the same degree of orthographic depth. In short, studies examining the influence of orthography on L2 speech production have shown that the effect of orthography is mostly positive when L1 and L2 share the same degree of orthographic depth and when the presentation of a written and an auditory input are combined. On the contrary, the effect of orthography is mostly negative when L1 and L2 do not share the same degree of orthographic depth, when participants have been exposed to written input at the beginning of L2 acquisition, and when only a written input is presented.
It seems that reading tasks or tasks that present written input (involving reading processes) might cause the negative influence of orthography. There are fewer speech production errors in a picture-naming task with auditive input than with written input (Rafat, Reference Rafat2013), in the same way as there are fewer speech production errors in a repetition task with written input followed by auditory input than in a reading task with written input only (Bassetti & Atkinson, Reference Bassetti and Atkinson2015). This is why several authors have criticized reading tasks for overestimating orthographic effects (Bassetti & Atkinson, Reference Bassetti and Atkinson2015) and potentially eliciting spelling pronunciations, that is, the pronunciation of a word according to its spelling (Nimz & Khattab, Reference Nimz and Khattab2019; Roettger, Winter, Grawunder, Kirby, & Grice, Reference Roettger, Winter, Grawunder, Kirby and Grice2014; Silveira, Reference Silveira2007). Consequently, reading tasks may not truly reflect learners’ actual phonological representations.
We therefore decided to test the influence of orthography on spoken word production in L2, by comparing written production training tasks (i.e., copy and dictation) with oral production training tasks (i.e., repetition tasks) and assessed L2 speech production with a repetition task. Concerning spelling to dictation, we referred to Rapp, Epstein, and Tainturier (Reference Rapp, Epstein and Tainturier2002)’s dual-route model of spelling to dictation. Concerning copy, the two most recent models are the model developed by Pérez (Reference Pérez2013) and Pérez, Giraudo, and Tricot (Reference Pérez, Giraudo and Tricot2012), which compares the underlying cognitive processes in the copy and dictation tasks, as well as the model developed by Kandel, Lassus-Sangosse, Grosjacques, and Perret (Reference Kandel, Lassus-Sangosse, Grosjacques and Perret2017). The main difference between the two tasks we chose is that in the copy task, the input is visual, and the word’s orthographic form is available and acts as an external memory. In the dictation task, the input is auditory, and participants have to turn it into a written response, by applying phoneme-to-grapheme conversion rules and retrieving the orthographic representation in the mental lexicon.
In light of the studies we have cited and the models of writing to dictation and copy, which highlight the link between orthographic and phonological representations, we assumed (as Bürki et al., Reference Bürki, Spinelli and Gaskell2012, did for L1) that the activation of orthographic representations during written production modifies and improves L2 French pronunciation, by allowing preexisting phonological representations to be restructured, leading to more accurate pronunciation. Two different L2 orthographic representations (e.g., taxi /taksi/ vs. journée /ʒuʁne/) for two L2 phonemes, which are not perceptually discriminated (e.g., /i/ vs. /e/), allow participants to restructure the phonological representations of these two phonemes, no matter if the target word is consistent or inconsistent (e.g., taxi /taksi/ or pharmacie /faʁmasi/ for /i/ vs. journée /ʒuʁne/ or potager /potaʒe/ for /e/). In order to examine the role of activated orthographic representations in written production, we used French words containing either one of two oral target vowels (/e/, /i/) or one of two nasal target vowels (/ã/, /ɔ̃/) in final position (e.g., talon /talɔ̃/, “heel”; carburant /kaʁbyʁã/, “fuel”; panier /panje/, “basket”; merci /mεʁsi/, “thanks”). The target vowels selection was based on (a) a preliminary written production corpus that we constructed and analyzed and (b) studies examining speech production errors (Calaque, Reference Calaque1992; Escudero, Reference Escudero2005, Reference Escudero, Boersma and Hamann2009; Maume, Reference Maume1973; van Leussen & Escudero, Reference van Leussen and Escudero2015), which allowed us to pinpoint recurring errors made by Moroccan learners of French. Target vowels are in the final word position because in French, the word-final position carries stress, thus permitting target vowels to be perceptually more prominent. Moreover, target vowels are more frequent in the final position. All the stimuli were manipulated in terms of spelling consistency (Bonin, Collay, & Fayol, Reference Bonin, Collay and Fayol2008; Planton, Reference Planton2014; Planton, Jucla, Démonet, & Soum-Favaro, Reference Planton, Jucla, Démonet and Soum-Favaro2019). We tested our assumption in a pretest/posttest design. Participants undertook three tasks in succession: a pretest (word repetition task) assessing pronunciation accuracy for target vowels; a task in one of the five experimental conditions (repetition of minimal pairs, word repetition with verbotonal method of phonetic correction, vocalized copy, dictation, or copy); and a posttest (same task as in pretest).
In foreign language teaching, different methods are used to address pronunciation problems in speech production. We chose the verbotonal method of phonetic correction and the minimal pair method in our study. The verbotonal method of phonetic correction was developed by Peter Guberina (Billières, Reference Billières and Berré2005) in the 1950s. The main purpose of this method is to give L2 learners access to the L2 phonological system by modifying their initial perception. The initial state of L2 perception is determined by the phonological sieve (Dupoux & Peperkamp, Reference Dupoux, Peperkamp, Durand and Laks2002; Escudero, Reference Escudero2005; Troubetzkoy, Reference Troubetzkoy1939; van Leussen & Escudero, Reference van Leussen and Escudero2015). The phonological sieve illustrates the L1 influence on L2 sound perception and production: L1 phonology filters L2 speech signal properties that are not relevant for the native phonological system. The verbotonal method of phonetic correction uses intonation, prosody, rhythm, and gesture to modify L2 learners’ perception and increase pronunciation accuracy. The minimal pair method is based on the distinctive function of the phonemes in minimal pairs (e.g., banc /bã/–bon /bɔ̃/). The aim of this method is to help students to perceptually discriminate between two phonemes. The perceptive discrimination of minimal pairs would allow the students to establish contrastive lexical representations and increase pronunciation accuracy.
In the repetition of minimal pair condition (MP), participants had to repeat a minimal pair they heard. In the word repetition with verbotonal method of phonetic correction condition (VTM), participants also had to repeat a word they heard. In the latter condition, the word was corrected after repetition, according to the VTM parameters. In the vocalized copy condition (VCOP) participants had to write and pronounce the word they saw on the screen. In the copy condition (COP) participants had to write the word they saw on the screen, and finally, in the dictation condition (DIC), participants had to write the word they heard.
Participants’ pretest performances were a baseline against which we compared their posttest performances. The posttest assessed the improvement in pronunciation after the task had been completed (one of the five experimental conditions).
If our general assumption were true, we should observe differences in pronunciation accuracy across the experimental conditions. We formulated four specific hypotheses on posttest pronunciation accuracy.
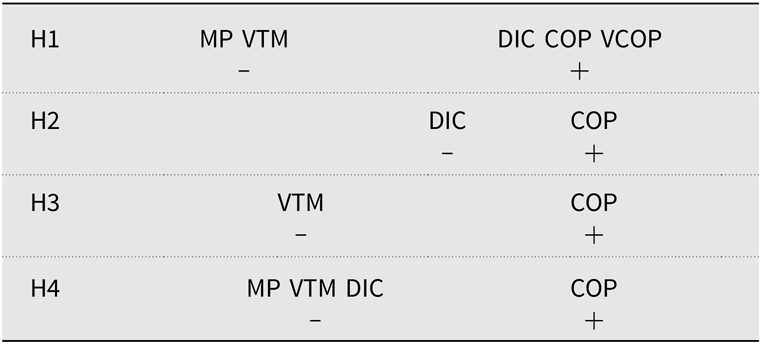
Our first hypothesis related to the fact that the manipulation of orthographic and phonological information in written production tasks helps to modify phonological representations (Bürki et al., Reference Bürki, Spinelli and Gaskell2012; Chevrot et al., Reference Chevrot, Beaud and Varga2000; Soum-Favaro, Gunnarsson, Simoës-Perlant, & Largy, Reference Soum-Favaro, Gunnarsson, Simoës-Perlant, Largy, Soum-Favaro, Coquillon and Chevrot2014). Manipulating written information allows preexisting phonological representations to be corrected. These corrected phonological representations lead to more accurate pronunciation in L2 speech production. We predicted that performances after the written production tasks (COP, VCOP, and DIC) would be better than performances after the spoken production tasks (VTM and MP).
The VCOP condition was only tested in this first hypothesis. The aim was to collect information about the quality of each participant’s phonological representations of the vocalized stimuli. This task was chosen to examine the similarity or dissimilarity between each participant’s oral and written productions for each stimulus. We did not include the VCOP condition in the other hypotheses. However, the analysis of written production is still in progress and will be the subject of a later study.
Our second hypothesis concerned the COP condition, where the visual orthographic trace of the word to be copied remains available and is not subject to variation. It therefore acts as a permanent external memory (Pérez et al., Reference Pérez, Giraudo and Tricot2012) to which participants can refer. Visual processing of orthographic information while reading the word to be copied reinforces the interaction between phonological and orthographic representations (Lambert, Alamargot, Larocque, & Caporossi, Reference Lambert, Alamargot, Larocque and Caporossi2011). This processing allows preexisting phonological representations to be modified, and leads to a more accurate pronunciation in L2 speech production. We therefore predicted that, compared with the DIC condition, the COP condition would lead to fewer spoken production errors on the posttest.
Our third hypothesis related to the processing of combined input information. Speech perception involves not only auditory processing but also visual processing (Fort et al., Reference Fort, Kandel, Chipot, Savariaux, Granjon and Spinelli2013; Rafat & Stevenson, Reference Rafat and Stevenson2019), as attested by the famous McGurk effect (McGurk & Macdonald, Reference Mcgurk and Macdonald1976). Recent studies have shown that visual speech information (i.e., movements of the lips and face) has a facilitative effect on nonnative speech perception and production (Erdener & Burnham, Reference Erdener and Burnham2005). However, in accordance with our general assumption, we hypothesized that it is the orthographic representation activated in written production that allows the phonological representation to be restructured. In line with this assumption, we predicted that the processing of visual orthographic and phonological information in the COP condition would improve posttest pronunciation accuracy in L2 speech production more efficiently than the processing of visual gestural and auditory information in the VTM condition.
Our fourth and last hypothesis resulted from the first three. These hypotheses concerned the predicted efficiency of different tasks at improving posttest pronunciation. If we assume that the activation of orthographic representations in a written production task allows for the restructuring of phonological representations, then we can hypothesize that the combined processing of visual orthographic and phonological information is a more efficient way of improving L2 speech production. We therefore predicted that the combination of visual orthographic and phonological information processing in the COP condition would be more effective than the combination of visual gestural and auditory information processing in the VTM condition, as well as the processing of phonological information only in the DIC and MP conditions.
Table 1 summarizes the four hypotheses developed above. We used symbols to represent which condition(s) were expected to improve (+) posttest pronunciation accuracy compared to the other condition(s) (–).
Summary of the 4 hypotheses of the study
Method
Participants
Participants were 100 (40 women and 60 men) Moroccan adult learners of French from the Institut Français of Rabat (Morocco), aged 18–35 years (M = 22). They attended Level A2 (Council of Europe, 2001) French classes. The study was restricted to participants whose native language was Moroccan Arabic (Darija) and who used the French language solely for work and/or study. Participants were selected via linguistic questionnaires that we constructed, inspired by the Alberta Language Environment Questionnaire (Paradis, Reference Paradis2011). We selected questions concerning (a) participants’ L1 (Moroccan dialect had to be Darija) and language use (mainly Darija at home and with friends, French only at work or school) and (b) participants’ family language use (parents: L1 had to be Darija, siblings: mainly Darija and not French). We had to simplify certain questions because the Alberta Language Environment Questionnaire contains multiple questions about the language background, but we were only interested in controlling the above cited factors.
Material
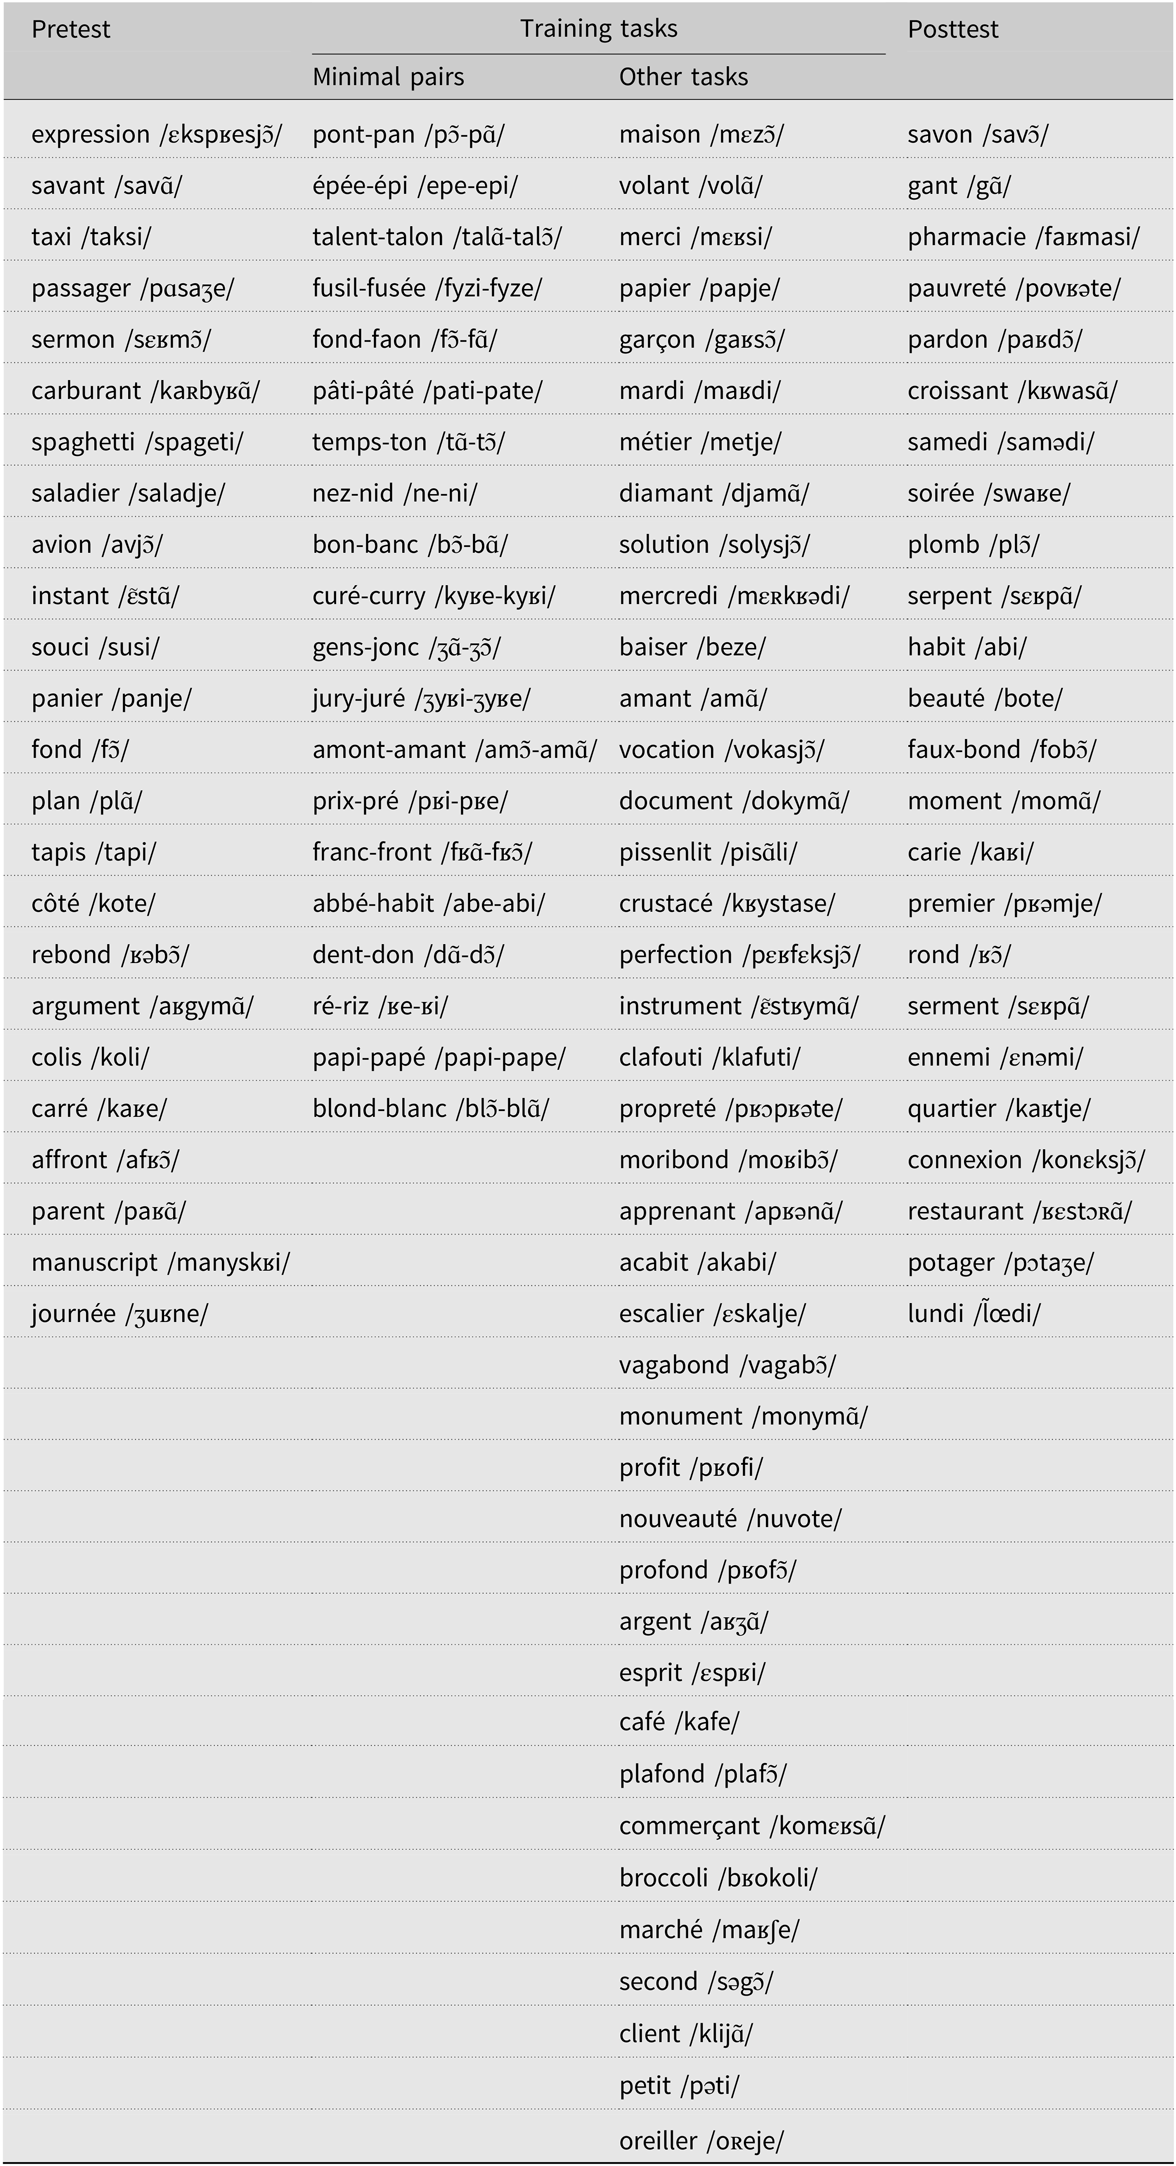
We created four stimulus lists (Appendix A): one for the pretest, one for the posttest, one for the MP experimental condition, and one for the other four experimental conditions (i.e., VTM, VCOP, COP, and DIC).
We constructed a preliminary written production corpus to select the target vowels. The corpus analysis allowed us to pinpoint recurring errors made by Moroccan learners of French. Results showed that vowels were more error prone (90%) than consonants (10%). Furthermore, substitution errors were the most common, mainly involving the four target vowels we selected (e.g., contine /kɔ̃tin/ for cantine /kãtin/ “canteen”; vidio /vidio/ for vidéo /video/ “video”). These errors are also characteristic of Moroccan learners’ L2 speech production (Calaque, Reference Calaque1992; Maume, Reference Maume1973).
The stimuli were 128 French nouns. They were selected from the Lexique French lexical database (New, Pallier, Brysbaert, & Ferrand, Reference New, Pallier, Brysbaert and Ferrand2004) using the following criterion: either one of the two oral target vowels (/e/, /i/) or one of the two nasal target vowels (/ã/, /ɔ̃/) had to be in the word-final position (e.g., talon, “heel”; carburant, “fuel”; panier, “basket”; merci, “thanks”). Each stimulus contained a single occurrence of the same target vowel. For instance, we did not select the word enfant (“child”) because the target vowel /ã/ occurs twice. We chose words with a target vowel in the final position for two reasons. First, in French words, the final position carries a stress, thus allowing target vowels to be more prominent (Astésano & Bertrand, Reference Astésano and Bertrand2016; Rossi, Reference Rossi1999). Second, our selected target vowels are more frequent in the final position than in the initial or middle positions (New et al., Reference New, Pallier, Brysbaert and Ferrand2004). We restricted the number of syllables and letters: stimuli were monosyllabic, disyllabic (containing 2–6 letters), or trisyllabic (containing more than 8 letters). We controlled spelling consistency, which is the frequency of the phoneme-to-grapheme conversion in the word-final position for the target vowels in all the lists except the MP list. The number of words in the French language that met the first three criteria and allowed us to build minimal pairs was so limited that we could not take any further criterion into account. For the other lists, half the stimuli were consistent, and half were inconsistent. To achieve this, we used the phoneme-to-grapheme consistency values produced by Samuel Planton (Reference Planton2014; Planton et al., Reference Planton, Jucla, Démonet and Soum-Favaro2019) for our target vowels in the word-final position. Consistent stimuli contained the most frequent phoneme-to-grapheme conversion in the final position (/ɔ̃/=on, e.g., avion, “plane”) and inconsistent stimuli contained the second (/ɔ̃/=ont, e.g., affront, “affront”) and third most frequent phoneme-to-grapheme conversion (/ɔ̃/=ond, e.g., rebond, “bounce”). Finally, we also controlled and balanced lexical frequency across the lists of stimuli.
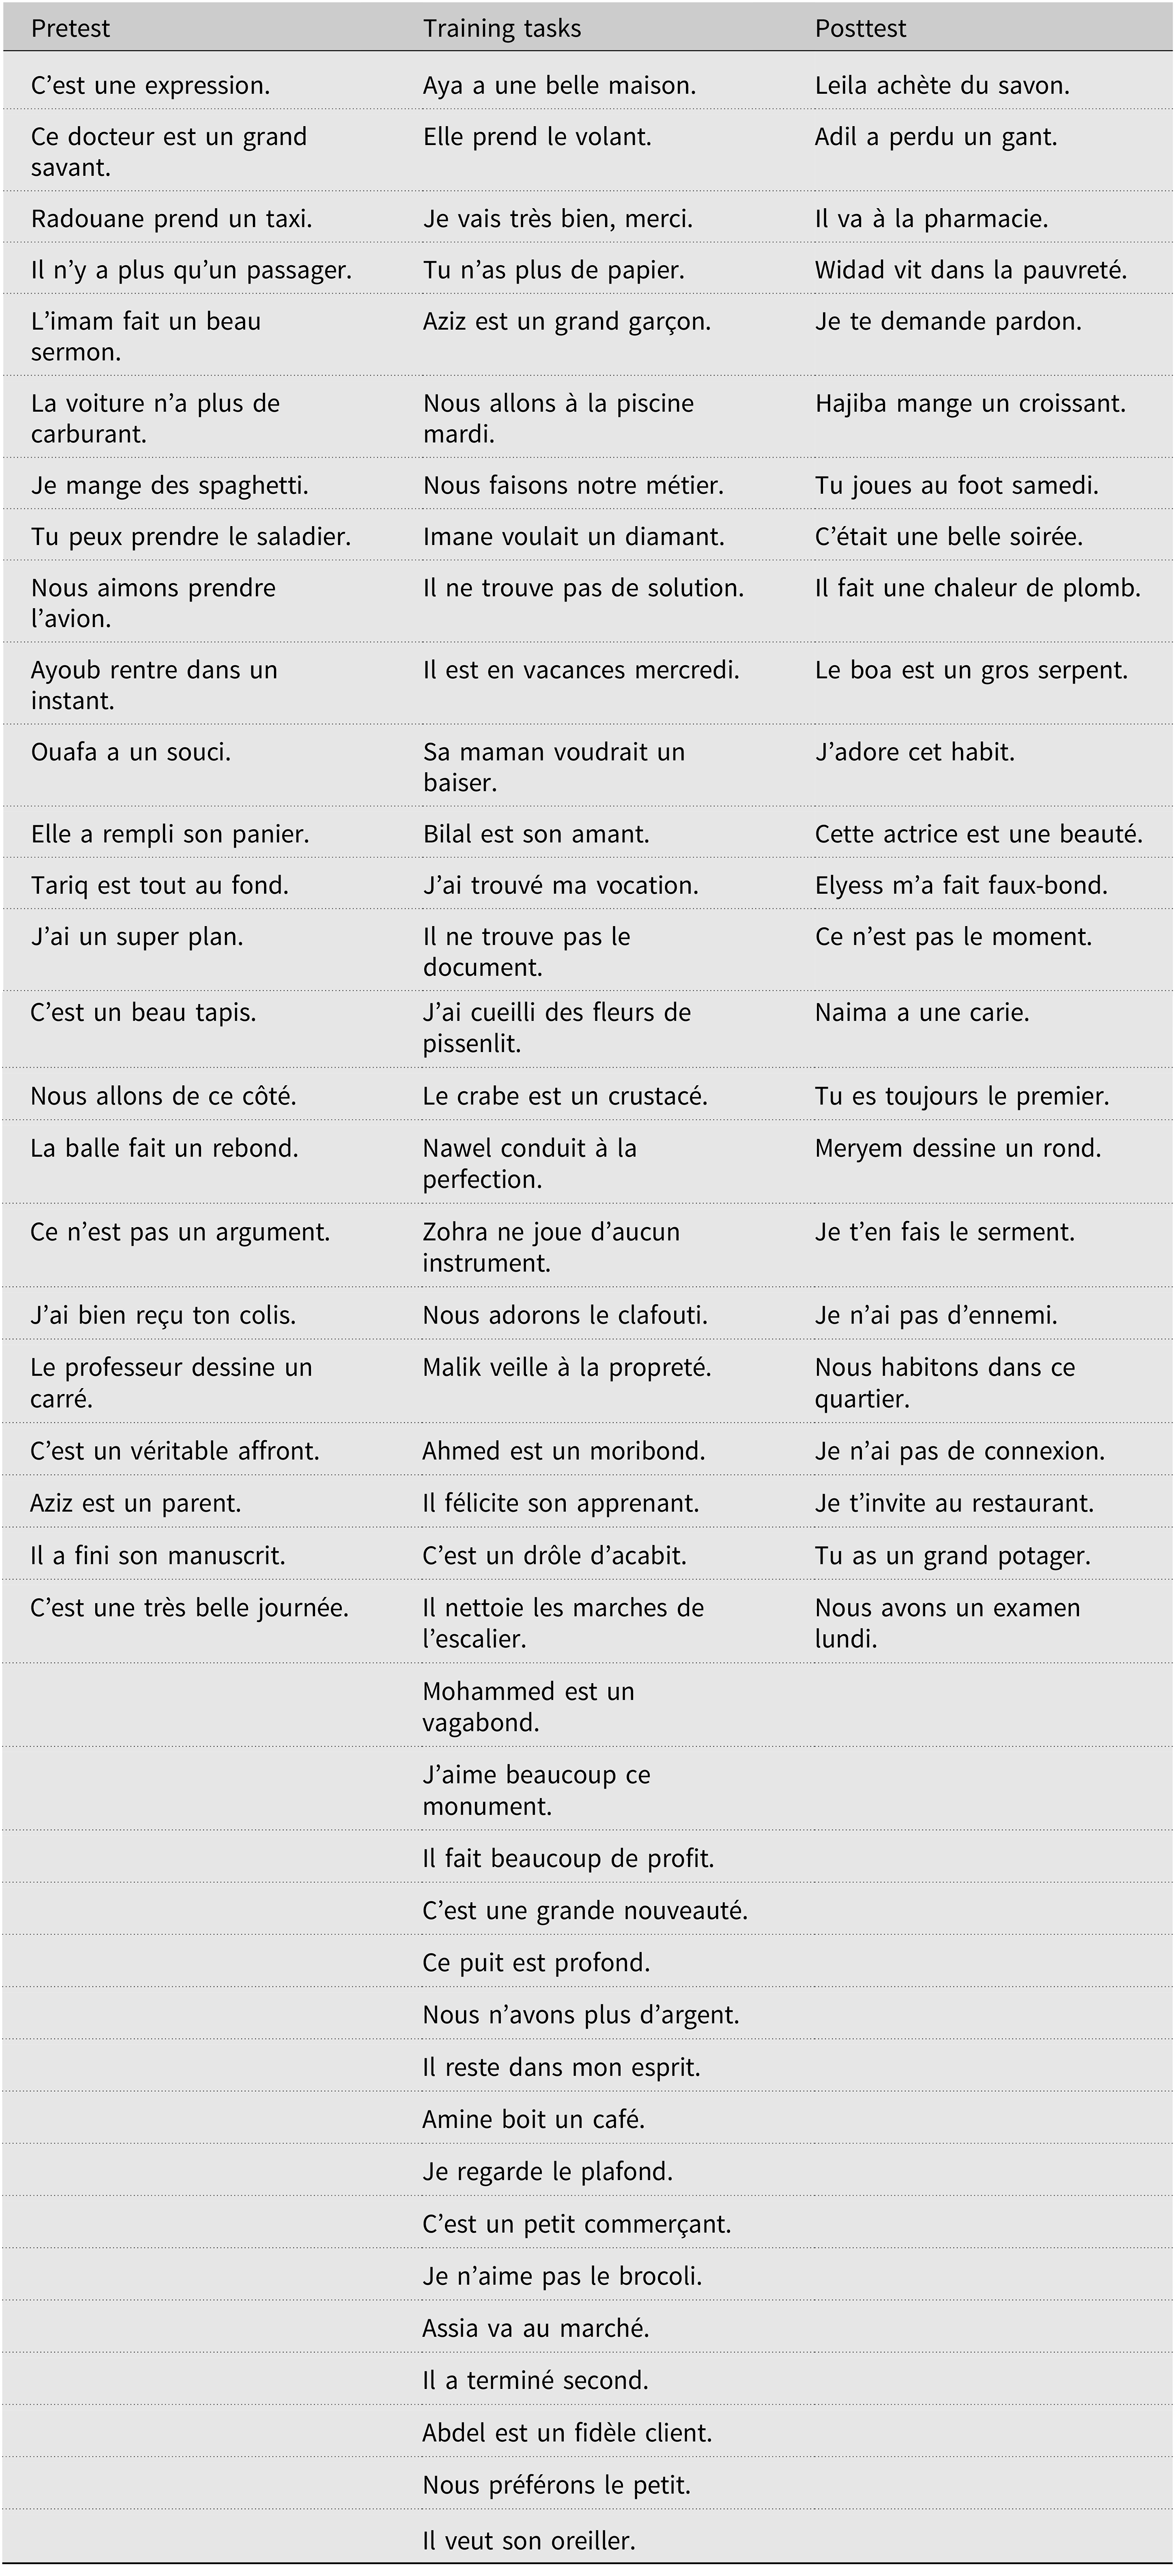
We inserted the stimuli created for the pretest, posttest, and the VTM, VCOP, COP, and DIC experimental conditions into context sentences. We created sentences containing five to nine syllables in which the stimuli were in the final position, that is, the stressed position in French (Appendix B). All the sentences had the same simple syntactic structure: subject, verb, and complement (e.g., Je n’aime pas le brocoli, “I don’t like broccoli”). These sentences provided a semantic context that was crucial for facilitating the participants’ access to meaning, as they were beginning learners. We then created a distractor list containing 108 randomly generated numbers between 100 and 900.
All spoken materials, words, context sentences, and distractors were recorded by a female native speaker of standard French on a Roland Edirol R-09HR wave/MP3 recorder (24 bits, 96 kHz) in a quiet room.
Apparatus
In all the experimental conditions, except for VTM, which is the subject of a subsection below, participants were tested individually using E Prime 2.0 Professional software (Psychology Software Tools, Pittsburgh, PA) to control stimulus presentation and oral data collection. They were placed in front of an HP EliteBook 8440p (Windows 7 Professional, 1366 × 768 screen) laptop, and were provided with a headset (Sennheiser).
Word repetition in the VTM condition was performed by a specialist of this method of phonetic correction, which requires both theoretical and practical knowledge. Responses were again recorded with an Edirol portable digital recorder.
Design and procedure
We implemented a pretest/posttest design. Participants undertook three tasks in a single experimental session: a pretest (word repetition task), one of the five experimental tasks described below, and a posttest (same as the pretest). Participants were randomly assigned to one of the five experimental conditions (n = 20 per condition). We refer hereafter to the groups according to the name of the experimental condition: repetition of minimal pair (MP), word repetition with verbotonal method of phonetic correction (VTM), vocalized copy (VCOP), dictation (DIC), and copy (COP).
The pretest provided a baseline measure of pronunciation errors on the four target vowels. The experimental conditions all had the same objective: improve the pronunciation of the target vowels. The posttest assessed the extent of the improvement in pronunciation after each experimental condition.
For the purposes of comparison, all the tasks had the same design, varying solely in the modality of stimulus presentation (visual or auditory) and the modality of participants’ responses (oral and/or written). For all the tasks, the experimenter gave the instructions orally to each participant in French (Appendix C) and then launched the software (except for VTM).
Participants began with two trial stimuli. This training phase was accompanied by written instructions (same as the oral ones) in French and in Darija (Moroccan dialect). This ensured that participants had no comprehension problems, given that they were beginners in French. They were informed step by step of the stimulus presentation modality (auditory or visual) and the response modality (oral or written). After this trial phase, these written instructions disappeared from the screen.
In each task, except the repetition of minimal pair task (MP), participants were presented with the context sentence containing the target stimulus in the final position. The target stimulus was then presented three times in isolation, and participants had to respond each time in the oral and/or written modality. Each stimulus was therefore presented four times altogether (once in the context sentence and three times in isolation) in each task except for the MP task, where the stimuli were presented just three times in isolation. Processing the same stimulus three times in a row gave participants the chance to improve their pronunciation through repetition. Next, in all five tasks, the distractor appeared as a series of three numbers (e.g., 4–9–2). Participants had to repeat (in the MP and in the word repetition with VTM of phonetic correction tasks) or to read (in the VCOP, DIC, and COP) the distractor aloud. The aim of the distractor was to break out the processing of the target stimulus and erase it from the participant’s working memory. Finally, and again in all five tasks, participants had to orally recall the target word. This allowed us to assess the pronunciation accuracy of the target vowels. All the analyses exclusively concerned the recall of the target word in the posttest. Figure 1 provides an example of the pretest and copy task design.
Pretest repetition task and copy task design.
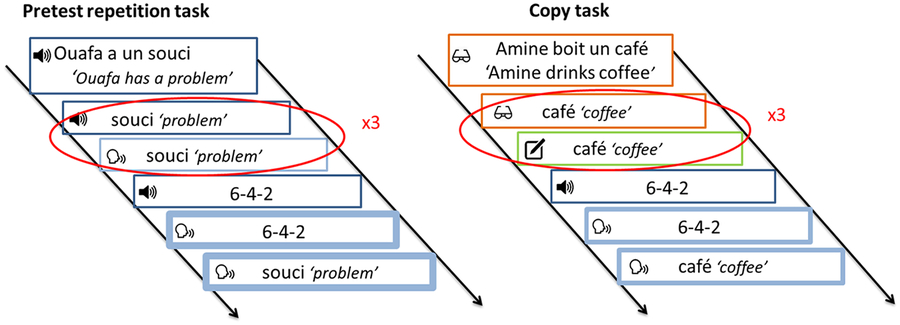
In the pretest and posttest, a fixation cross appeared in the center of the computer screen and participants heard a context sentence ending with a target word. They then heard the target word three times, each time preceded by a fixation cross. They were asked to listen to the whole sentence, but to only repeat the target word each time they heard it. A fixation cross appeared and then they heard the distractor and had to repeat it. Finally, they saw a question mark and had to recall the target word.
The same procedure was used in the MP condition. Participants heard a minimal pair after a fixation cross appeared, and had to repeat it. This procedure was repeated three times for the same stimulus. Then, after a fixation cross had again appeared, they heard the distractor and had to repeat it. Finally, they saw a question mark and had to recall the target minimal pair.
In the VTM condition, the procedure was exactly the same as for the pretest and posttest. The only difference was that the stimuli (context sentences, target words, and distractors) were orally presented to participants by an expert of this method. The latter pronounced each context sentence followed by the target word, which participants then had to repeat. Next, the expert applied a phonetic correction procedure that focused exclusively on the target vowel at the end of the word. This means that pronunciation errors on other phonemes were not corrected. For example, if a participant produced the word discussion (“discussion”) as [diskisjɔ̃] instead of [diskysjɔ̃], the phoneme /y/ pronounced [i] was not corrected. The participant had to repeat the target word as it was pronounced by the expert. This procedure was repeated once. The expert then pronounced the distractor, which the participant had to repeat. Finally, the latter had to recall the target word. Participants were given a break of a few minutes in the middle of the task. It is important to note that as we had to control various parameters so that this task could be compared with the four others, the VTM applied here was quite different from that applied in the classroom (Billières, Reference Billières and Berré2005), even if there are no formal instructions for implementing it.
The same phonetic correction procedures were employed for all 20 participants in the VTM group. They were decided beforehand and focused on errors in pronouncing the target vowels. The target word (model) was always pronounced with a falling intonation. The first correction procedure always targeted the intonation, while the second combined intonation and modified pronunciation.
In the DIC condition, a fixation cross appeared in the center of the computer screen and participants heard a context sentence ending with a target word. They then heard the target word three times, each time preceded by a fixation cross. They were asked to listen to the whole sentence, but only to write the target word each time they heard it. We provided participants with a notebook containing 129 pages (42 stimuli × 3 + three extra pages) to write the words (one word per page). The flipover format of the notebook was used to facilitate writing for right- and left-handed participants. Next, after a fixation cross, they heard the distractor and had to repeat it orally. The task ended with a question mark inviting participants to orally recall the target word. Participants were given a break of a few minutes in the middle of the task. They pressed the spacebar when they were ready to continue.
The COP condition featured the same procedure as in the DIC training task. The only difference was that the stimuli were visually presented. They appeared in the center of the screen, printed in Verdana 16-point font (Harley et al., Reference Harley, Kline, Price, Jones, Mosley, Farmer and Fain2013; Rello & Baeza-Yates, Reference Rello and Baeza-Yates2013) and remained visible while the word was being copied. A fixation cross appeared in the center of the computer screen and participants saw a context sentence ending with a target word. They then saw the target word three times, each time preceded by a fixation cross. They were asked to read the whole sentence silently, but to write only the target word each time they saw it. Participants were provided with the same notebook as before. Next, after a fixation cross, they saw the distractor and had to read it aloud. Finally, they saw a question mark and had to orally recall the target word. Participants were given a break of a few minutes in the middle of the task. They pressed the spacebar when they were ready to continue.
Finally, the procedure in the VCOP condition was the same as in the COP training condition, except that participants had to vocalize the words as they were copying them. Participants were provided with the same flipover notebook as before. Next, after a fixation cross, they saw the distractor, had to read it aloud, and finally saw a question mark and had to orally recall the target word. Participants were given a break of a few minutes in the middle of the task. They pressed the spacebar when they were ready to continue. Table 2 summarizes input modality (oral vs. written) and response modality (oral vs. written) for the five experimental conditions.
Summary of input and response modality (oral vs. written) for the five experimental conditions

Statistical analyses
Participants’ pronunciation of the 8,800 productions of the target vowels during the recall of the target stimuli was transcribed in the International Phonetic Alphabet and coded as accurate versus inaccurate by the experimenter and two native French speakers with training in phonetics (the latter were blind to the participant’s condition in order to avoid any type of classification bias). We did not consider the pronunciation accuracy of the entire target word. We coded target vowel pronunciation in terms of acceptability. This means that the perceived vowel had to be perceptually categorized as the target vowel. As a result, the perceived vowel could be perceptually categorized as the target vowel even if it was not produced in a canonical manner. Productions of target vowels were coded as follows:
Acceptable if the produced vowel was perceptually categorized as the target vowel (produced in a canonical manner or produced in a noncanonical manner: for instance, /i/ could be more opened or closed as long as it was perceived as /i/ by the transcribers);
Nonacceptable if the produced vowel was not the same as the target vowel (it implies substitutions errors like /i/ for /e/; /e/ for /i/; /ã/ for /ɔ̃/; /ɔ̃/ for /ã/; denasalization errors as /a/ or /o/ for /ã/ and /ɔ̃/ or denasalization and addition of a consonant, for example, /an/ or /on/ for /ã/ and /ɔ̃/).
Transcriptions and coding had to be agreed upon by at least two transcribers for each vowel. Target vowels that were inaudible or incomplete and productions other than the target word were removed from analyses (10.05%). These analyses were conducted solely on the pronunciation accuracy of the target vowels, based on auditory analysis.
Data were fitted with a generalized linear mixed effects model (Dixon, Reference Dixon2008) with a binomial distribution. Pre/post (pretest vs. posttest), vowel type (/e/ vs. /i/ and /ɔ̃/ vs. /ã/) and word consistency (consistent vs. inconsistent) were included as fixed-effect variables. We calculated the mean success score for each participant on the training tasks, based on the total number of observations. We divided the number of acceptable vowel pronunciations by the total number of responses (number of nonacceptable vowel pronunciations plus the number of acceptable vowel pronunciations) and included it as a covariate. Participants and items were entered as random-effect variables. Models were fitted by maximum likelihood, computed using the Laplace approximation. Generalized linear mixed effects models were run using R software (R version 3.2.2; R Core Team, 2015) with the lme4 package (Bates, Mächler, Bolker, & Walker, Reference Bates, Mächler, Bolker and Walker2015).
First, we tested the influence of the three main effects and two interactions (i.e., Vowel Type × Pre/Post and Word Consistency × Pre/Post) on the pronunciation accuracy of the target vowels. A constraint model (M0) included the intercept and the random part. We included all the intercepts and slope adjustments in accordance with Barr, Levy, Scheppers, and Tily (Reference Barr, Levy, Scheepers and Tily2013). The most complex model did not fit, so we decreased the complexity by removing, first, the correlations between the slope adjustments, then the correlations between the intercept and slope adjustments, and finally, slope adjustment. The final model included by-participants and by-items intercept adjustments and by-items slope adjustment. We tested fixed effects using an ascendant model comparison strategy. We added a new factor at each step, starting with the covariate (M1), followed by pre/post (M2), vowel type (M3), and word consistency (M4). Finally, we included the interactions between pre/post and vowel type (M5) and between pre/post and word consistency (M6). For each model, we computed the Akaike information criterion (Akaike, Reference Akaike1974) to assess goodness of fit. We used likelihood ratio tests (Pinheiro & Bates, Reference Pinheiro and Bates2000) to test significant changes in the model’s fit. A factor was significant if the likelihood ratio test was significant and the Akaike information criterion decreased.
Second, we tested our four hypotheses concerning the influence of the experimental conditions (training tasks) on pronunciation accuracy, by computing orthogonal contrasts. We computed a model in which the same random part as that used in the initial analysis was included. The covariate, vowel type, and word consistency were also included. Each contrast was compared with the constraint model (M0). The effect was tested with Wald z distribution.
Results
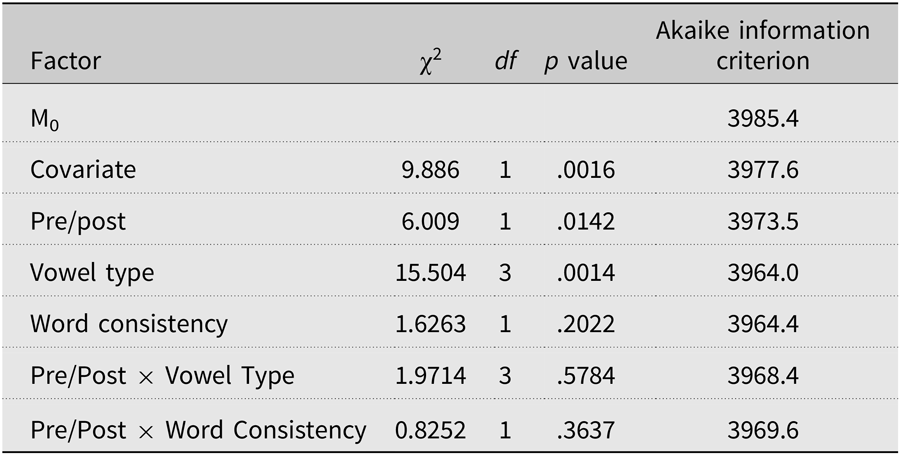
Table 3 summarizes the results of the pre/post data analysis: influence of the covariate (success score on training task), three main effects, and two interactions. Initially, we ensured that the participants’ pretest performances were not statistically different, χ2 (4) = 6.027, p = .1972. Groups did not differ statistically on the accuracy of target vowel pronunciation.
Results of model comparison analyses for pre/post test data
Effects of pre/post variable and covariate
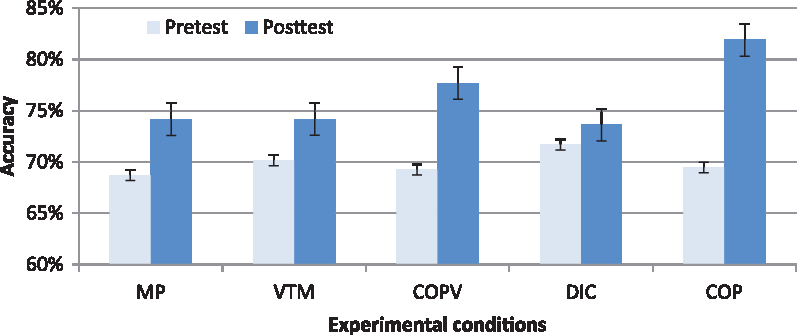
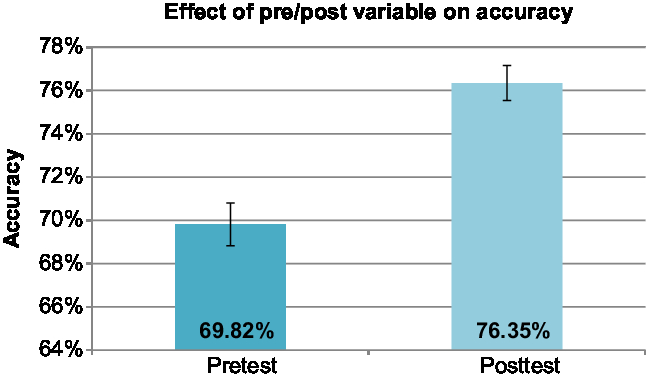
The pre/post variable explained a significant proportion of the variance, χ2 (1) = 6.009, p = .014. Regardless of experimental condition, we observed a benefit of the training on pronunciation accuracy in the posttest (Appendix D). The covariate allowed us to show that this effect was not due to variations in within-participants accuracy in the training tasks, χ2 (1) = 9.886, p = .0016. On average, participants performed better on the posttest (76.35% accuracy) than on the pretest (69.82% accuracy; Figure 2).
Mean of pronunciation accuracy (%) in pretest and posttest. Error bars represent standard error.
Effects of experimental conditions on posttest pronunciation accuracy
Contrast 1
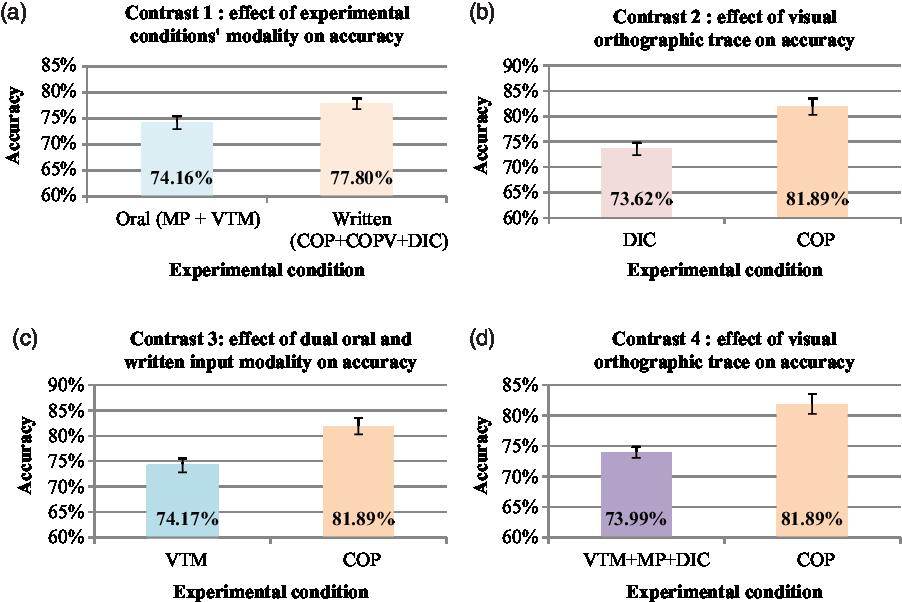
We tested the effect of experimental condition modality (oral vs. written) on pronunciation accuracy (Figure 3a). Participants’ performances differed significantly (z = –2.535, p = .0112) between the oral experimental conditions (VTM and MP) and the written experimental conditions (COP, VCOP, and DIC). On average, participants performed significantly better in the written conditions (77.80%) than in the oral conditions (74.16%).
Mean of accuracy (%) for each orthogonal contrast. (a) Mean accuracy (%) in oral and written conditions. (b) Mean accuracy (%) in DIC and COP conditions. (c) Mean accuracy (%) in VTM and COP conditions. (d) Mean accuracy (%) in VTM, MP, DIC, and COP conditions. Error bars represent standard error.
Contrast 2
Within the written experimental conditions, we tested the effect of the availability of the visual orthographic trace on accuracy (Figure 3b). There was a significant difference in participants’ performances between the COP and DIC conditions (z = –3.158, p = .0016). On average, the group that performed the COP task, in which the visual orthographic trace was available, performed significantly better (81.89%) than the group that performed the DIC task, in which there was no stable visual orthographic trace (73.62%).
Contrast 3
We tested the effect of the dual oral and written input modality on pronunciation accuracy (Figure 3c). Participants’ performances in the VTM and COP conditions differed significantly (z = –3.488, p = .0006). On average, the visual orthographic and phonological input modality of the written COP task led to significantly better performances (81.89%) than the visual gestural and auditory input modality of the oral VTM task (74.1%).
Contrast 4
Finally, we tested the effect of the visual orthographic trace on accuracy across the experimental conditions (Figure 3d). Participants’ performances in the COP condition differed significantly (z = –2.218, p = .0269) from their averaged performances across the MP, VTM, and DIC conditions. More specifically, on average, they performed significantly better in the COP condition, in which the visual orthographic trace was available (81.89%) than in the MP, VTM, and DIC conditions (73.99%).
Discussion
We investigated the influence of orthography on L2 spoken word production, and more specifically on L2 pronunciation. We conducted an experiment in which five groups of Moroccan beginning (Level A2) learners of French performed training tasks in five different experimental conditions (repetition of a minimal pair: MP, word repetition with verbotonal method of phonetic correction: VTM, vocalized copy: VCOP, dictation: DIC, and copy: COP). Based on auditory analysis, we assessed pronunciation accuracy on four word-final target vowels (/ã/, /ɔ̃/, /i/, /e/) in a posttest repetition task. Results showed that, whatever the experimental condition, participants’ pronunciation accuracy increased between the pretest and the posttest, justifying our decision to test the influence of specific training on posttest pronunciation accuracy.
Regarding the results of the orthogonal contrast analyses, our general assumption that the activation of orthographic representations during written production allows preexisting phonological representations to be restructured, leading to correct pronunciation, was confirmed by Contrast 1. The comparison of posttest pronunciation accuracy between the oral (VTM and MP) and written (COP, VCOP, and DIC) conditions clearly showed that written production training is more efficient at improving pronunciation accuracy than oral production training. The activation of orthographic representations allows the conjointly activated phonological representations to be modified, as described in interactive models of written production (Pérez et al., Reference Pérez, Giraudo and Tricot2012; Rapp et al., Reference Rapp, Epstein and Tainturier2002). Modifying the phonological representation leads to improved pronunciation accuracy in L2 speech production. Conversely, in oral conditions, activation of the orthographic representation is not mandatory, as orthography is not relevant to the task, there being no written input. Both repetition tasks can be performed solely via the activation of phonological representations. Nevertheless, a number of L1 studies have shown that orthography affects the recognition of spoken words and that orthographic codes are automatically activated during the processing of spoken language (for a review, see Frost & Ziegler, Reference Frost, Ziegler and Gaskell2007). These studies examined the effect of orthographic consistency on speech recognition, but yielded conflicting results. Some concluded that orthographic influence requires lexical access (e.g., Ventura, Morais, Pattamadilok, & Kolinsky, Reference Ventura, Morais, Pattamadilok and Kolinsky2004), as the effect was only observed in a lexical decision task. Others, however, claimed that lexical access is not mandatory (Pattamadilok, Morais, Ventura, & Kolinsky, Reference Pattamadilok, Morais, Ventura and Kolinsky2007). The authors did, however, agree that orthographic influence is stronger when lexical representations are more involved in performing the task, as no consistency effect was found in shadowing tasks (Pattamadilok et al., Reference Pattamadilok, Morais, Ventura and Kolinsky2007; Ventura et al., Reference Ventura, Morais, Pattamadilok and Kolinsky2004). Studies of the influence of orthography on L2 speech recognition have also produced mixed results, with an orthographic effect only appearing when orthographic input is provided (e.g., Escudero, Reference Escudero2015; Showalter & Hayes-Harb, Reference Showalter and Hayes-Harb2013). All in all, results on the influence of orthography in L1 and L2 could explain why the activation of orthographic representations is not mandatory in repetition tasks, and why the orthographic effect is only observed when written input is provided. Thus, it seems that in the present study, the interaction between orthographic and phonological information in the written conditions allowed the phonological representations to be modified, thereby improving posttest pronunciation accuracy. We explained earlier that studies have shown a negative influence of orthography on L2 speech production when L1 and L2 do not share the same degree of orthographic depth. Conversely, the positive influence of orthography was demonstrated to be stronger when L1 and L2 share the same degree of orthographic depth. However, these studies have not used written production tasks. It seems that the same orthographic depth in L1 and L2 (Arabic and French; opaque) promotes a positive effect on L2 speech production. Nevertheless, further research should replicate our study with other couples of languages (transparent vs. transparent; opaque vs. opaque; opaque vs. transparent). Moreover, it should be noted that the question of the orthographic depth of Arabic has not yet been resolved. Evidence from different studies (Abu-Rabia, 1995, Reference Abu-Rabia2019; Asadi, Ibrahim, & Khateb, Reference Asadi, Ibrahim and Khateb2017; Hermena, Drieghe, Hellmuth, & Liversedge, Reference Hermena, Drieghe, Hellmuth and Liversedge2015; Ibrahim, Reference Ibrahim2013; Taha, Reference Taha2016; Ziegler, Jacobs, & Stone, Reference Ziegler, Jacobs and Stone1996) failed to provide concrete conclusion concerning this issue.
Contrast 2 refined this result, showing that the COP task was more efficient than the DIC task at improving posttest pronunciation accuracy. The fact that performances on the COP task were better than those on the DIC task suggests that it is not strictly speaking the activation of the orthographic representations that modifies the phonological representations. Rather, it is the processing and the availability of the visual orthographic information. Once the acoustic input has been analyzed in a dictation task, the lexical and sublexical routes are activated in parallel (Rapp et al., Reference Rapp, Epstein and Tainturier2002). The lexical route activates the phonological representation of the word to be written in the phonological input lexicon and, in turn, activates the orthographic representation. The two representations are then delivered to orthographic working memory. At the same time, the sublexical route activates the phoneme-to-grapheme conversion process and the result is also delivered to orthographic working memory. As the routes call on two different processes, a conflict arises between the two outputs. This conflict can be resolved by the information that is available (i.e., acoustic input). Nevertheless, as L2 perception is strongly influenced by the L1 phonological system (Best & Tyler, Reference Best, Tyler, Munro and Bohn2007; Flege, Reference Flege and Strange1995; van Leussen & Escudero, Reference van Leussen and Escudero2015), unless the word to be written is a known word, the written response will probably be erroneous. In dictation, the interaction between orthographic and phonological representations occurs through the phoneme-to-grapheme conversion process. The conversion process is guided solely by recognition of the phonemes making up the auditory input. If these phonemes are not correctly perceived and recognized, the phoneme-to-grapheme conversion and the written response will be wrong. In other words, a dictation task does not allow orthographic representations to modify phonological representations, as the former flow from the latter. In a copy task (Kandel et al., Reference Kandel, Lassus-Sangosse, Grosjacques and Perret2017; Pérez et al., Reference Pérez, Giraudo and Tricot2012), the lexical and sublexical routes are also activated in parallel. The lexical route activates orthographic representations in the orthographic input lexicon and, in turn, the phonological representations, which are then delivered to orthographic working memory. The sublexical route activates the grapheme-to-phoneme conversion process, following the reading of the word, and then the phoneme-to-grapheme conversion process in preparation for copying the word. Just as in a dictation task, a conflict arises between the two routes’ outputs that can be solved by the information that is available (i.e., written input). However, in a copy task, this information is the model of the word to be copied, which remains available throughout the task and is not subject to variation, allowing it to serve as an external memory. Moreover, the treatment of the orthographic configuration of the word to be copied acts like a magnifying glass that allows the analysis of lexical orthography. Hence, the processing of the visual orthographic information during the reading of the word to be copied reinforces the interaction between the phonological and orthographical representations (Lambert et al., Reference Lambert, Alamargot, Larocque and Caporossi2011). The back and forth between stable orthographic information and phonological representations allows the phonological representations to be modified, thus improving pronunciation accuracy in L2 speech production.
Although we explained that reading tasks have been criticized, copy tasks also involve reading the words to be copied. Nonetheless, it is important to note that reading strategies differ according to the nature of the ensuing task (Lambert et al., Reference Lambert, Alamargot, Larocque and Caporossi2011). For instance, in reading aloud tasks, an oral response is expected after the process of reading per se, whereas in copy tasks, a written response is expected after the word has been read. The processes required for copying a word imply an interaction between the orthographic and phonological representations, as the reading of the word relies not only on grapheme-to-phoneme conversion (as is the case in reading tasks) but also on the analysis of the word to be produced. Participants have to process all the information contained in the word (e.g., geminate consonants or silent letters in French), which requires a considerable amount of attention. As a result, the focus on orthography means that phonological information plays a less decisive role in copy tasks than in reading aloud tasks.
Moreover, we can establish a parallel between reading tasks and dictation tasks. The conversion process entailed in reading tasks, namely, grapheme-to-phoneme conversion, mirrors the one in dictation tasks, namely, phoneme-to-grapheme conversion. This parallel emphasizes the fact that reading and dictation tasks above all assess participants’ knowledge of grapheme-to-phoneme or phoneme-to-grapheme conversion rules, whereas copy tasks provide an opportunity to correct and reinforce conversion procedures (Pérez & Giraudo, Reference Pérez and Giraudo2016).
Thus, results clearly indicate that posttest pronunciation accuracy was affected by the presence of orthographic information in the training task. As suggested by Contrasts 3 and 4, the COP training condition, in which the stable visual orthographic trace remained available, was the most efficient at improving posttest pronunciation accuracy. We showed that it is the interaction between stable orthographic information and the phonological representation that allows the latter to be modified, leading to correct pronunciation.
Before concluding, it is important to note the limitations of our study concerning participants and stimuli, as well as the time aspect of the experimental design. The results discussed above only apply to the population we studied, namely, Moroccan beginning learners of French, and cannot be generalized to other L2 learners. Furthermore, our results are restricted to the four target vowels we chose as well as the word-final position. It is highly likely that results would have been different for other French phonemes. More research is needed in order to determine if our results can be extended to different vowels and to different word positions. In addition, the experimental design was affected by the time factor in two ways. First, the training tasks were of different durations. As it takes more time to write than to speak, the oral training tasks (MP and VTM) lasted shorter time than the written ones (COP, VCOP, and DIC). Hence, posttest pronunciation performances may have been influenced by the amount of time devoted to the training task. Participants spent more time on the written production training tasks than on the oral ones. Second, all the training tasks were administered in a single experimental session. Results would probably have been different if the training phase had taken place over several days or weeks.
All in all, the results of the present study highlight the need to include orthography as a key variable in speech recognition, perception, production, and acquisition models. Moreover, they demonstrate that orthographic effects have a particular importance and obvious implications for language learning and teaching. Orthography and written production tasks are potentially powerful tools for improving L2 pronunciation. Although the role of orthography has long been neglected in didactics of French as a foreign language (Billières, Reference Billières and Berré2005), our results suggest that we need to go beyond the split between oral and written language. Rather, oral and written language should be regarded as complementing each other.
Conclusion
To conclude, the current results show that written training tasks are more efficient than oral training tasks at improving L2 learners’ speech production. With a language pair rarely studied (Arabic L1; French L2), our results showed that orthography can modify phonological representations and, consequently, L2 pronunciation. More precisely, we demonstrated that the phonological representation modified by the orthographic representation is beneficial for L2 speech production when it is performed via a copy task. Thereby, the results provide further evidence of the need to include orthography as a variable in psycholinguistics models, but also to reconsider oral didactics, as copy tasks may enhance L2 learners’ pronunciation. More specifically, the present study provides evidence that copy tasks may help L2 learners improve pronunciation accuracy more efficiently than the traditional method of phonetic correction as the minimal pair method or verbotonal method of phonetic correction.
Acknowledgments
We are very grateful to Magali Boureux for accepting to apply the verbotonal method of phonetic correction in Rabat. This research did not receive any specific grant from funding agencies in the public, commercial, or not-for-profit sectors.
Appendix A
Experimental stimuli
Appendix B
Context sentences
Appendix C
Example of instructions for the pretest word repetition task
“You are going to perform a word repetition activity. You are going to hear a sentence in French, and then you will hear the last word of this sentence. You will only be asked to repeat the last word of the sentence. You will hear this word once, you will repeat it, you will hear it a second time, you will repeat it again, and you will hear it a third time, and will repeat it again. You will then hear numbers that you will have to repeat. After the numbers, you will have to recall the last word of the sentence.”
Appendix D
Mean of pronunciation accuracy (%) in pretest and posttest. the errors bars represent standard error. (Color online)