INTRODUCTION
Understanding how pathogen diversity and evolution interact with epidemiology is crucial to improve the control of infectious diseases. Multi-disciplinary approaches, combining microbiology and genetics with mathematical and statistical modelling, have allowed rapid progress in this field over the last decade (Grenfell et al. Reference Grenfell, Pybus, Gog, Wood, Daly, Mumford and Holmes2004). A key objective is to determine in what measure the (re-) emergence of a disease (whether it has already occurred or it is anticipated) is caused by changes in the host population or by evolution of the pathogen. Antimicrobial resistance and antigenic variation are certainly two of the most serious threats to sustained control of infectious diseases. Here we will focus on the latter. Antigenic diversity enables infectious agents to evade host's acquired immunity. It can occur within a single host, allowing the infection to persist (see review by Frank and Barbour, Reference Frank and Barbour2006), or at the population level, causing recurrent epidemics such as seen in human influenza (Gog and Grenfell, Reference Gog and Grenfell2002; Ferguson, Galvani and Bush, Reference Ferguson, Galvani and Bush2003; Koelle et al. Reference Koelle, Cobey, Grenfell and Pascual2006), cholera (Koelle et al. Reference Koelle, Cobey, Grenfell and Pascual2006) or dengue (Wearing and Rohani, Reference Wearing and Rohani2006). In all those examples, mathematical models have been used to decipher the role of ecological and evolutionary dynamics, based on experimental and epidemiological data.
In this paper we demonstrate how a simple model can be derived and analysed to explore the potential implications at the population level of experimental findings at the individual level. The starting point is a recent experimental study (Wolfe et al. Reference Wolfe, Goebel, Bjørnstad, Restif and Harvill2007) that showed asymmetric cross-immunity between two closely-related bacterial species: Bordetella pertussis and B. parapertussis. These two pathogens are the main agents of whooping cough (Mattoo and Cherry, Reference Mattoo and Cherry2005) and are specific to humans. However, infections of mice have proven a useful assay to study pathology (Sato et al. Reference Sato, Izumiya, Sato, Cowell and Manclark1980), immunity (Sato and Sato, Reference Sato and Sato1984) and vaccine protection (Redhead et al. Reference Redhead, Watkins, Barnard and Mills1993; Willems et al. Reference Willems, Kamerbeek, Geuijen, Top, Gielen, Gaastra and Mooi1998). The relationship between B. pertussis and B. parapertussis has been debated since the latter was isolated in 1937 (Eldering and Kendrick, Reference Eldering and Kendrick1938, Reference Eldering and Kendrick1952; Granström and Askelöf, Reference Granström and Askelöf1982). Clinically, B. parapertussis produces similar but typically milder symptoms than B. pertussis (Lautrop, Reference Lautrop1958; Mastrantonio et al. Reference Mastrantonio, Stefanelli, Giuliano, Herrera Rojas, Ciofi Degli Atti, Anemona and Tozzi1998; Bergfors et al. Reference Bergfors, Trollfors, Taranger, Lagergard, Sundh and Zackrisson1999; He et al. Reference He, Arvilommi, Viljanen and Mertsola1999; Liese et al. Reference Liese, Renner, Stojanov and Belohradsky2003). Genetically, the two human pathogens now appear to have emerged independently from different animal strains of B. bronchiseptica (Diavatopoulos et al. Reference Diavatopoulos, Cummings, Schouls, Brinig, Relman and Mooi2005). More controversial is the level of cross-protective immunity conferred by B. pertussis and B. parapertussis. Lautrop (Reference Lautrop1958) reported 73 children who became infected with both B. pertussis and B. parapertussis over a 17-year period, and concluded that “preventive cross-immunity […] does not exist”. Khelef et al. (Reference Khelef, Danve, Quentin-Millet and Guiso1993) showed that purified proteins from either B. pertussis or B. parapertussis do not provide mice with cross-protection in aerosol challenge experiments. This lack of cross-protection was supported by several studies from clinical trials that suggested poor efficacies of anti-pertussis vaccines against B. parapertussis (Mastrantonio et al. Reference Mastrantonio, Stefanelli, Giuliano, Herrera Rojas, Ciofi Degli Atti, Anemona and Tozzi1998; Stehr et al. Reference Stehr, Cherry, Heininger, Schmitt-Grohé, Überall, Laussucq, Eckhardt, Meyer, Engelhardt, Christenson and Group1998; Bergfors et al. Reference Bergfors, Trollfors, Taranger, Lagergard, Sundh and Zackrisson1999). In contrast, Watanabe and Nagai (Reference Watanabe and Nagai2001) found that mice previously infected with either of the two pathogens were able to clear both pathogens when challenged six weeks later. However, the use of B. pertussis strain 18-323, which presents a number of striking molecular differences with other B. pertussis strains (Musser et al. Reference Musser, Hewlett, Peppler and Selander1986; Stibitz and Yang, Reference Stibitz and Yang1997; Diavatopoulos et al. Reference Diavatopoulos, Cummings, Schouls, Brinig, Relman and Mooi2005), and the long delay (two weeks) before assessing clearance of infection, is a cause of concern regarding the relevance of the latter result. Using previously sequenced strains of B. pertussis and B. parapertussis, we recently performed challenge experiments in mice four weeks after the initial infection (Wolfe et al. Reference Wolfe, Goebel, Bjørnstad, Restif and Harvill2007). Bacterial counts three days post-challenge show that, compared to naïve mice, those immunised with B. pertussis were able to clear subsequent infection with B. pertussis but not B. parapertussis. Conversely, immunization with B. parapertussis elicited the clearance of both species. We then established, experimentally, the key role of O-antigen (which B. pertussis lacks) in enabling B. parapertussis to evade cross-immunity: in a similar experiment, an O-antigen-deficient B. parapertussis strain showed reduced ability to colonise hosts previously challenged with either species (Wolfe et al. Reference Wolfe, Goebel, Bjørnstad, Restif and Harvill2007).
These experimental results from the mouse model system suggest that B. parapertussis may have a competitive advantage over B. pertussis in human populations. By contrast, the observed incidence of B. parapertussis has consistently been lower than that of B. pertussis (Lautrop, Reference Lautrop1971; He et al. Reference He, Viljanen, Arvilommi, Aittanen and Mertsola1998; Mastrantonio et al. Reference Mastrantonio, Stefanelli, Giuliano, Herrera Rojas, Ciofi Degli Atti, Anemona and Tozzi1998; Bergfors et al. Reference Bergfors, Trollfors, Taranger, Lagergard, Sundh and Zackrisson1999; Cimolai and Trombley, Reference Cimolai and Trombley2001; Frühwirth et al. Reference Frühwirth, Neher, Schmidt-Schläpfer and Allerberger2002; Liese et al. Reference Liese, Renner, Stojanov and Belohradsky2003; Dragsted et al. Reference Dragsted, Dohn, Madsen and Jensen2004; Letowska and Hryniewicz, Reference Letowska and Hryniewicz2004). However, most of these surveys are likely to underestimate the circulation of B. parapertussis as it tends to cause milder symptoms – and therefore is more likely to go unreported – than B. pertussis. In addition, in some countries like the United States, B. pertussis infections are notifiable while B. parapertussis infections are not (Centers for Disease Control and Prevention, 2007). Lautrop (Reference Lautrop1971), who produced the most detailed epidemiological study of B. parapertussis available, went so far as to assert that “as an infectious entity parapertussis is as widespread as pertussis.” Besides, there have been no recent longitudinal studies that could show trends in B. parapertussis circulation. In view of the shortcomings of current epidemiological data, we designed a mathematical model to investigate the potential effects of asymmetric cross-immunity on the coexistence, incidence and dynamics of B. pertussis and B. parapertussis within a human population. Although many aspects of pathogen strain dynamics have already been modelled, asymmetric cross-immunity has been widely overlooked. To our knowledge the only two exceptions are studies by White, Cox and Medley (Reference White, Cox and Medley1998) who considered the possibility from a theoretical point of view, and Lipsitch et al. (Reference Lipsitch, Dykes, Johnson, Ades, King, Briles and Carlone2000) who measured experimentally and modelled mathematically asymmetric cross-immunity among strains of Streptococcus pneumoniae. This paper will address the following questions. Assuming asymmetrical cross-immunity and fitness difference, what conditions allow the coexistence of the two pathogens? How do the parameters of the model affect their prevalence? How does the introduction of anti-pertussis vaccination affect the dynamics of the two species? Beyond the particular case of B. pertussis and B. parapertussis, we suspect that careful experimental studies could reveal similar patterns in other systems, so that our model could be applied more broadly.
METHODS
The model
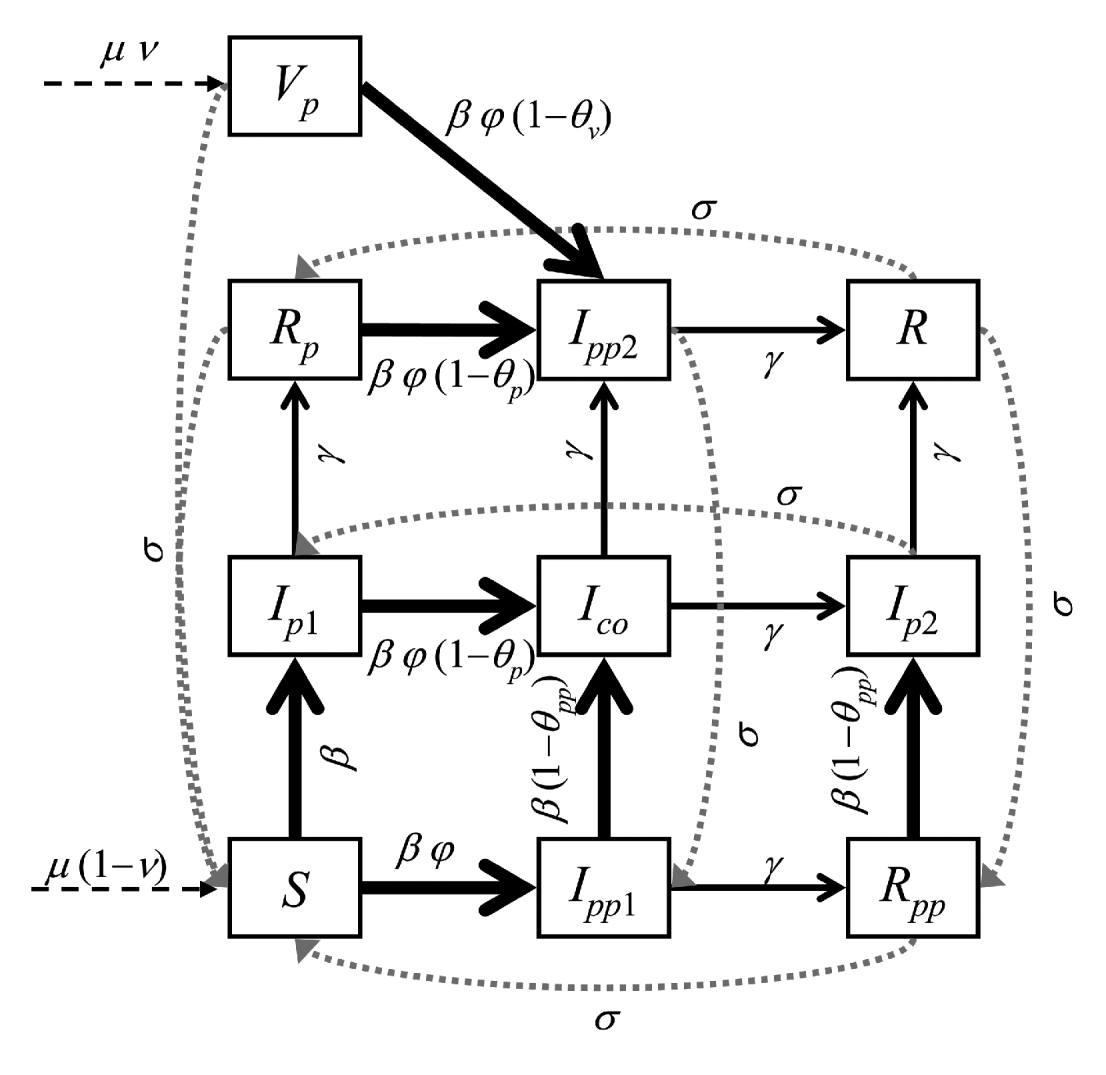
Our model is an extension of the classical SIR framework (for Susceptible-Infectious-Recovered) to two pathogenic entities, similar to that used by Kamo and Sasaki (Reference Kamo and Sasaki2002) with the addition of a vaccinated compartment. As shown in Fig. 1, the host population falls into 10 non-overlapping compartments, defined by their levels of infectivity and susceptibility with respect to the two pathogens. Their dynamics are described by the following system of ordinary differential equations:

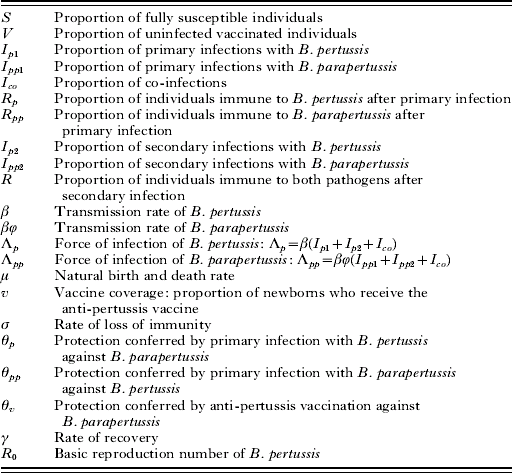
Table 1 defines the symbols used in the model. In line with empirical observations (e.g. Lautrop, Reference Lautrop1971), we allow for the possibility of co-infection by the two pathogens. We make the following assumptions about immunity: upon infection with one pathogen, individuals are fully protected against re-infection with the same pathogen, but only partially protected against secondary infection with the other pathogen. Similarly, vaccination of newborns protects them against infection with B. pertussis and reduces their susceptibility to B. parapertussis. All immunity wanes at a constant rate σ, i.e. individuals lose their immunity against that pathogen on average 1/σ years after recovering from an infection (or after vaccination). To our knowledge there is no empirical indication on how measures of bacterial growth in challenge experiments, as performed by Wolfe et al. (Reference Wolfe, Goebel, Bjørnstad, Restif and Harvill2007), can be used to quantify variations in susceptibility or infectiousness in an epidemiological context. We decided to represent partial cross-immunity by a reduction in susceptibility to secondary infection, represented by parameters θp, the level of cross-protection conferred by infection with B. pertussis, and θpp, that conferred by infection with B. parapertussis. To account for asymmetric cross-immunity, we impose the following inequalities: 0⩽θp<θpp⩽1. We found no empirical indication on the level of cross-protection (against B. parapertussis) conferred by anti-pertussis vaccination, θv, compared to cross-protection from infection with B. pertussis, θp. By default, we assume that the two parameters are equal, but we also consider other possibilities.
Diagram of the dynamic model described by equations (1). Boxes represent the ten compartments into which the population is divided, and arrows show transfers of individuals between them. Solid thick arrows: infections; solid thin arrows: recoveries; dotted grey arrows: loss of immunity; dashed arrows: births. Deaths (occurring at equal rates in all compartments) are not shown.

List of symbols used in the model

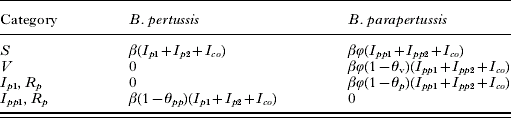
In addition, to account for the alleged lower incidence of B. parapertussis, we allow for the possibility of a fitness cost which would balance its immunity-based competitive advantage. Compared to the baseline transmission rate β of B. pertussis, we therefore assume that the transmission rate of B. parapertussis is βϕ, with 0<ϕ⩽1. Alternatively, we considered an increase in the recovery rate of B. parapertussis, γ/ϕ, which led to very similar results, so we will not present this scenario here. Although we are not aware of any direct evidence of such a fitness difference between B. pertussis and B. parapertussis, the fact that the latter tends to exhibit milder or shorter symptoms could account for lower or shorter-lived infectivity. The previous assumptions are summarised in Table 2, which shows the infection rates of the two pathogens on the different classes of susceptible hosts. We wish to emphasize that these assumptions represent one possible interpretation of the implications of experimental observations at the individual level for population dynamics.
Per capita forces of infection for the different categories of susceptible hosts by B. pertussis and B. parapertussis

Analyses
Due to the high dimensionality of the system, little algebraic analysis is feasible, so we resorted mainly to numerical analysis. First, we studied single pathogen equilibrium states to derive criteria for the persistence of B. pertussis and B. parapertussis. We then investigated the relative incidence of the two pathogens and certain aspects of their endemic dynamics. Analyses were carried out with Mathematica 6.0 (Wolfram, Reference Wolfram2007).
We chose the numerical values of certain parameters based on the limited available information from clinical studies and previous modelling works. The average infectious period for both pathogens, 1/γ, was set to 21 days (Anderson and May, Reference Anderson and May1982). Published data suggests that loss of immunity appears within 6 to 10 years of primary infection or vaccination (Olin et al. Reference Olin, Gustafsson, Barreto, Hessel, Mast, Van Rie, Bogaerts and Storsaeter2003; Broutin et al. Reference Broutin, Rohani, Guégan, Grenfell and Simondon2004), although there is no indication on the distribution of the duration of immunity in populations. Following Wearing and Rohani (unpublished manuscript), we set the average duration of immunity 1/σ to 50 years, which enabled them to successfully reproduce the dynamical features of B. pertussis incidence in England and Wales. Note that, because loss of immunity in our model is assumed to be exponentially-distributed, this value amounts to nearly 10% of people losing their immunity within a five year period. The value of the transmission rate of B. pertussis, β, is derived from the basic reproduction number R 0, which can be estimated using empirical estimates of the average age at first infection A and the mean life-span L. Anderson and May (Reference Anderson and May1991) proposed the approximate relation R 0≈L/A (assuming age-independent mortality), which lead them to an estimated value of around 17 for whooping cough in pre-vaccine era England and Wales as well as the USA. However, that formula needs to be amended when waning of immunity is taken into account (Wearing and Rohani, unpublished manuscript). In our model, the basic reproduction number of B. pertussis can be expressed as an approximate function of the average age at first infection A and the rate of waning immunity σ (see Appendix for an exact expression):

Using 1/μ=70 years, A=4·5 years (Anderson and May, Reference Anderson and May1982) and 1/σ=50 years, we get R 0≈7 for B. pertussis. The transmission rate β is then given by R 0 (μ+γ) and the basic reproduction number of B. parapertussis by R 0 ϕ. The numerical values of parameters ϕ, θp, θpp and θv, which are specific to this model and for which no empirical estimate is available, were varied extensively between 0 and 1. We also explored the effects of wide variations in immune period 1/σ and vaccine coverage v. Although not shown here, we checked that the patterns presented in this paper were not affected qualitatively by variations in other parameters (A, μ or γ).
RESULTS
Persistence of pertussis and parapertussis
The system has four possible equilibrium points: no pathogen, B. pertussis alone, B. parapertussis alone and both pathogens present. Only the first two can be expressed analytically. To determine their stability, we assessed the ability of each pathogen to invade equilibria from which it is absent. Further details about the following expressions are given in the Appendix.
In the absence of B. parapertussis, elimination of B. pertussis by vaccination is feasible if immunity lasts long enough. The critical vaccine coverage, above which B. pertussis cannot persist, is given by

which only holds if the right-hand term is equal to or less than one. Using equation (2), this condition can be re-written as: σ⩽(Aμ2)/(1−2Aμ) Using the exact expression for R 0 derived in the Appendix instead of equation (2) leads to a more complicated expression but we checked that the numerical values were very close. Numerically, with A=4·5 years and 1/μ=70 years, our model predicts that B. pertussis cannot be controlled by single dose vaccination if the average duration of immunity 1/σ is shorter than 948 years. In the following, we will assume that this is the case, so that B. pertussis remains endemic with any level of vaccine coverage in the absence of B. parapertussis. Note that the feasibility of B. pertussis control would be further reduced if we considered limited efficacy of the vaccine, i.e. partial susceptibility to B. pertussis despite immunization. On the other hand, such pessimistic estimates are in part caused by the simplistic structure of the model: factors such as spatial structure, age structure or stochasticity would probably make vaccination more likely to control infection, but we leave those considerations for further studies. Nevertheless, our results highlight the proposition that more consideration should be given to protocols of booster vaccination if eradication is to be successful.
In the absence of B. pertussis, B. parapertussis can theoretically be controlled through anti-pertussis vaccination, depending on the balance between vaccine efficacy against B. parapertussis θv and B. parapertussis relative fitness ϕ. The critical vaccine coverage is given by:

which can only be achieved if the right-hand term is equal to or less than one, i.e.

When B. pertussis is endemic, B. parapertussis can spread and persist in the population if:

The dependence on v of the right-hand expression shows that anti-pertussis vaccination can hinder the spread of B. parapertussis only if the vaccine confers more cross-protection than natural infection with B. pertussis (θv>θp).
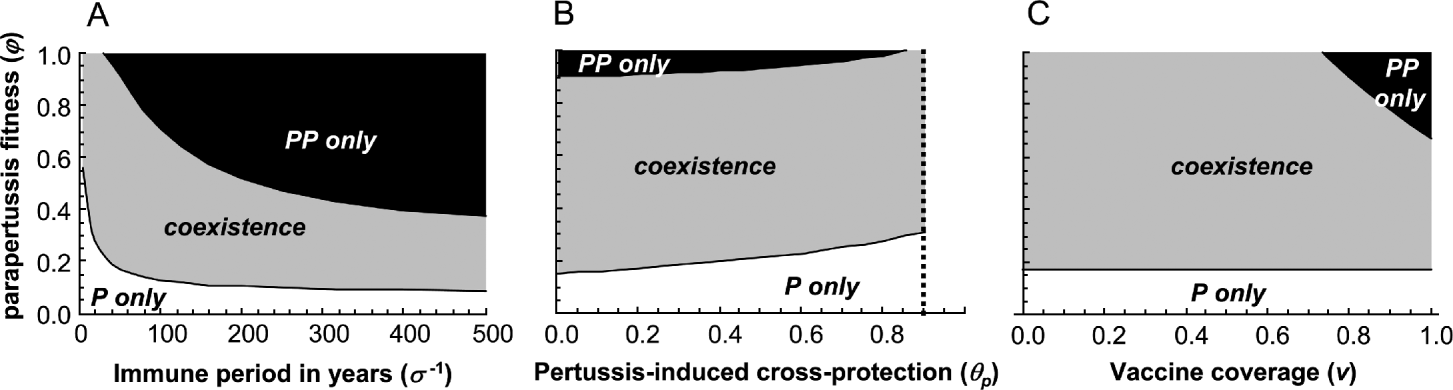
When B. parapertussis is endemic, the condition for B. pertussis invasion cannot be expressed algebraically. Numerical analysis shows that, with high enough values of ϕ (i.e. the fitness of B. parapertussis being comparable to B. pertussis), B. parapertussis can stop B. pertussis from invading in the presence of anti-pertussis vaccination (Fig. 2).
Stable equilibria (B. pertussis [P] only, B. parapertussis [PP] only, or coexistence) for different ranges of parameter values (see axes legends). Default values for the three panels: lifespan 1/μ=70 years, infectious period 1/γ=21 days, immune period 1/σ=50 years, R 0=(1/4·5+σ)/(μ+σ)≈7·1 with default values (but note that R 0 varies with σ in panel A), vaccine coverage v=0·8, B. pertussis-induced cross-protection θp=θv=0·2, B. parapertussis-induced cross-protection θpp=0·9.

Coexistence is possible when both pathogens can invade each other's endemic equilibrium. This can be checked numerically by calculating the eigenvalues of the jacobian matrix of system (1).
Fig. 2 illustrates the effects of the key parameters of the model on the persistence of the two pathogens. There are wide areas of realistic parameter values that allow for the coexistence of B. pertussis and B. parapertussis. One of the main predictions is that, in the presence of anti-pertussis vaccination, the advantage to B. parapertussis conferred by immune evasion must be balanced by a fitness cost (modelled here as lower infectivity) – otherwise B. pertussis would be eliminated in the face of the asymmetric immunity. The only condition that allows coexistence without such a cost to B. parapertussis is a combination of low anti-pertussis vaccine coverage and short-lasting immunity. Surprisingly, the scope of B. parapertussis immune evasion (measured by θp and θv compared to θpp) has limited impact on coexistence. These parameters affect only the relative fitness of each pathogen, which depends on the prevalence of its competitor. As we will show next, the effect of cross-immunity parameters is most visible on relative prevalences. We emphasize the fact that the criterion for persistence considered here is based on a deterministic model with an infinite population size. In a stochastic model with a finite population size, persistence would critically depend on variations in prevalence.
Relative prevalence
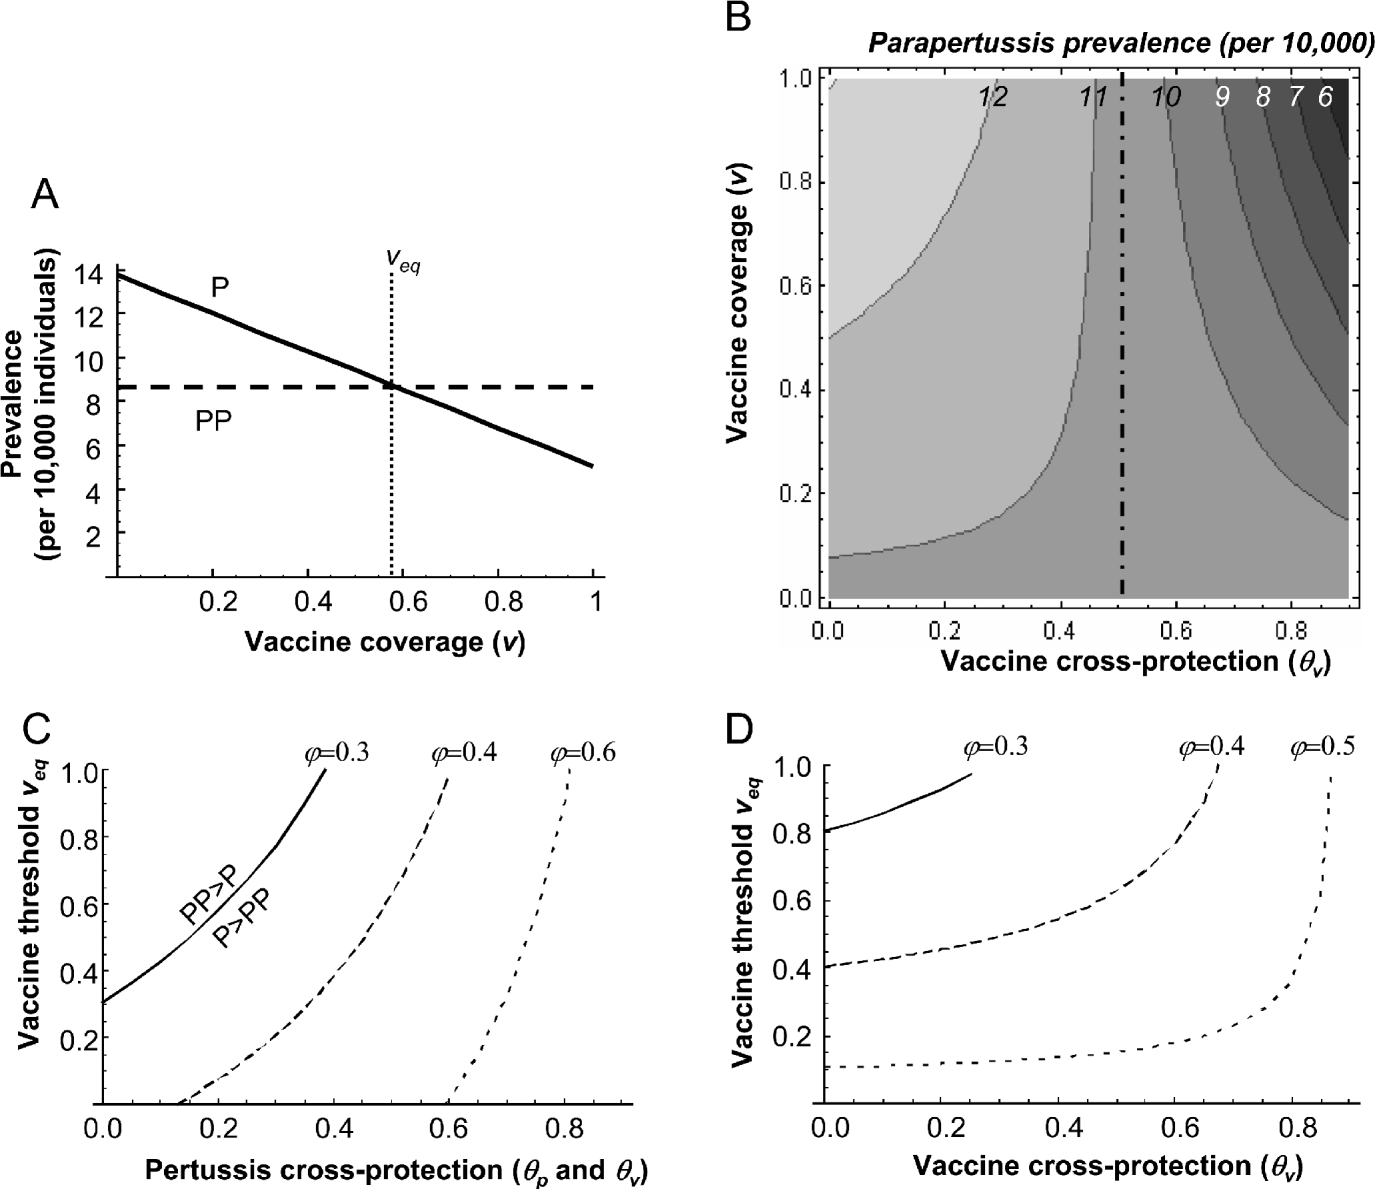
Under the scenario of stable coexistence of B. pertussis and B. parapertussis, we estimated their relative prevalences at the endemic equilibrium and assessed the effect of anti-pertussis vaccination. Broadly speaking, increasing the vaccine coverage reduces B. pertussis but not B. parapertussis prevalence, thus giving the latter a relative competitive advantage (Fig. 3A). We then investigated in more detail how vaccination affects the absolute and relative incidence of B. parapertussis. A key factor is the cross-protection conferred by vaccination θv compared to that conferred by primary infection with B. pertussis θp. Only if the two parameters are significantly different can vaccination modify the absolute prevalence of B. parapertussis (Fig. 3B). As mentioned in the introduction, the relative prevalence of B. pertussis and B. parapertussis has been the subject of much debate, notably because of differences in rates of reporting. As illustrated on Fig. 3A, it is possible to estimate, for a given set of parameter values, a theoretical vaccine coverage v eq that results in equal prevalences of the two infections. The sensitivity of that threshold to B. parapertussis parameters is shown on Fig. 3C and 3D. The relative fitness of B. parapertussis and its ability to evade B. pertussis-specific immunity are naturally very important factors determining the ratio of B. pertussis to B. parapertussis. Typically, a fitness cost for B. parapertussis of at least 40% (i.e. ϕ<0·6) is needed to allow the dominance of B. pertussis. Interestingly, if infection-induced cross-immunity θp is fixed, the threshold vaccine coverage v eq (above which B. parapertussis dominates) is relatively insensitive to vaccine induced cross-protection θv. In other words, for a given vaccine coverage, the ratio of B. pertussis to B. parapertussis incidence would not be much affected by a drop in vaccine efficacy against B. parapertussis.
(A) Prevalence at steady state of B. pertussis (solid line) and B. parapertussis (dashed line) against vaccine coverage; the vertical dotted line shows the position of v eq, the vaccine coverage that results in equal prevalences of the two pathogens (numerical values as in Figure 2, and ϕ=0·3). (B) B. parapertussis prevalence at steady state (shades of grey; numbers on isoclines are prevalence per 10 000) against vaccine cross-protection θv (horizontal scale) and vaccine coverage v (vertical scale); the vertical dashed line shows the position of θp (numerical values as in Fig. 2, except θp=0·5). (C) Vaccine threshold v eq (above which B. parapertussis prevalence is higher than that of B. pertussis) against B. pertussis-induced cross-protection θp=θv for different values of B. parapertussis fitness ϕ. (D) As in (C), except that θp is set to 0·5.

Endemic dynamics
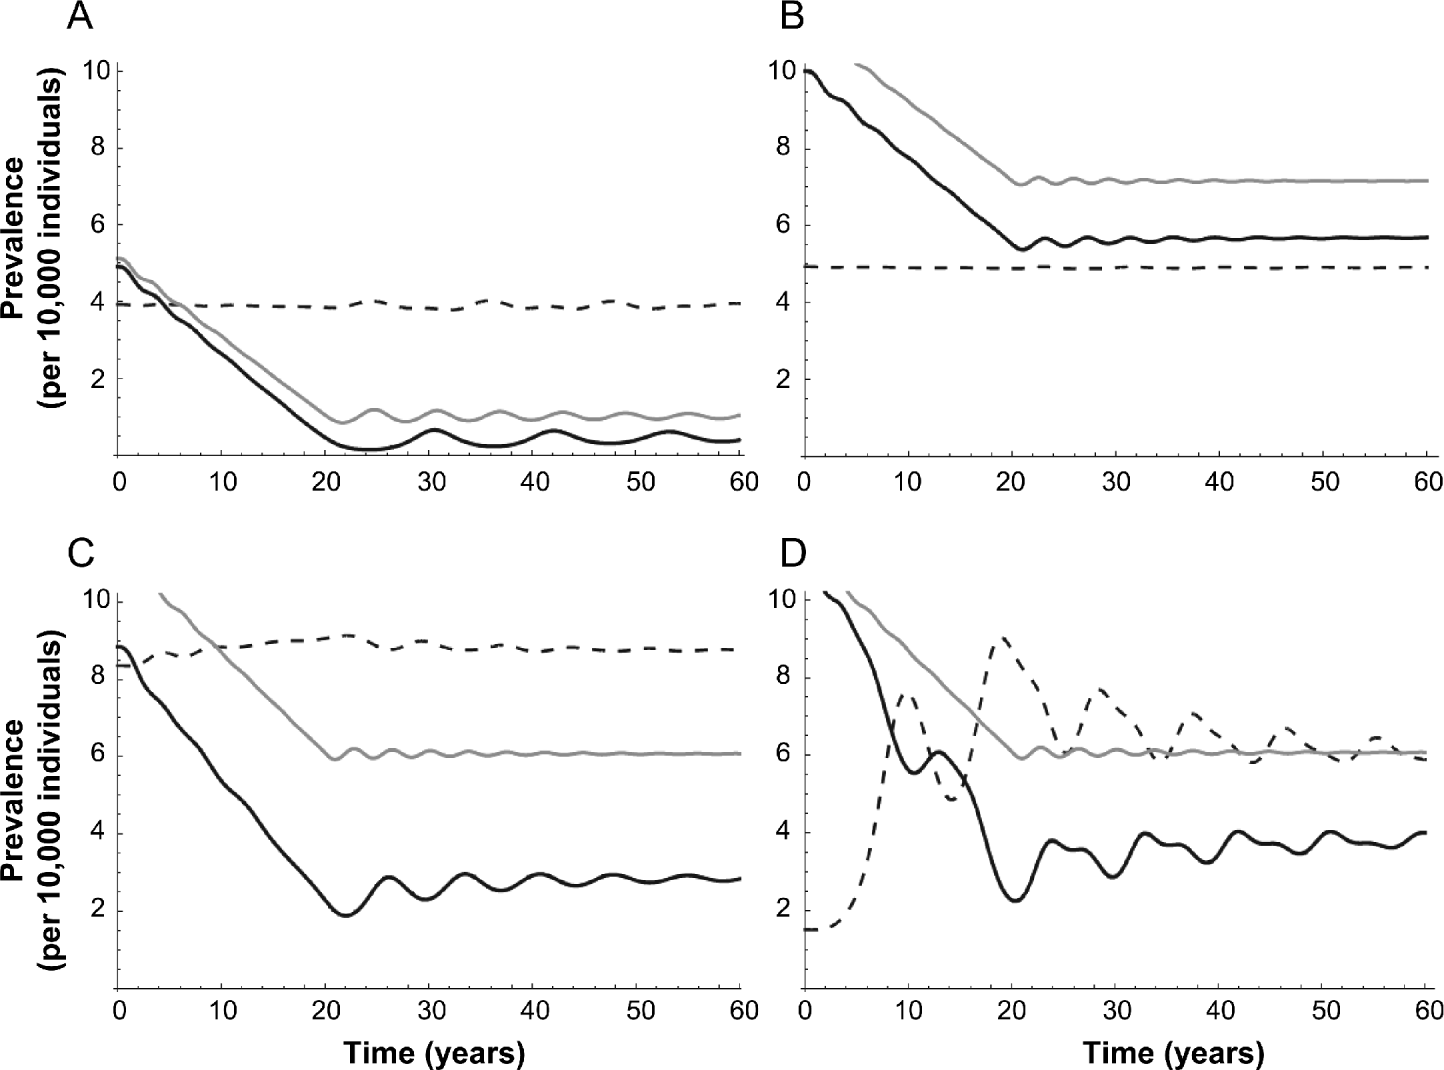
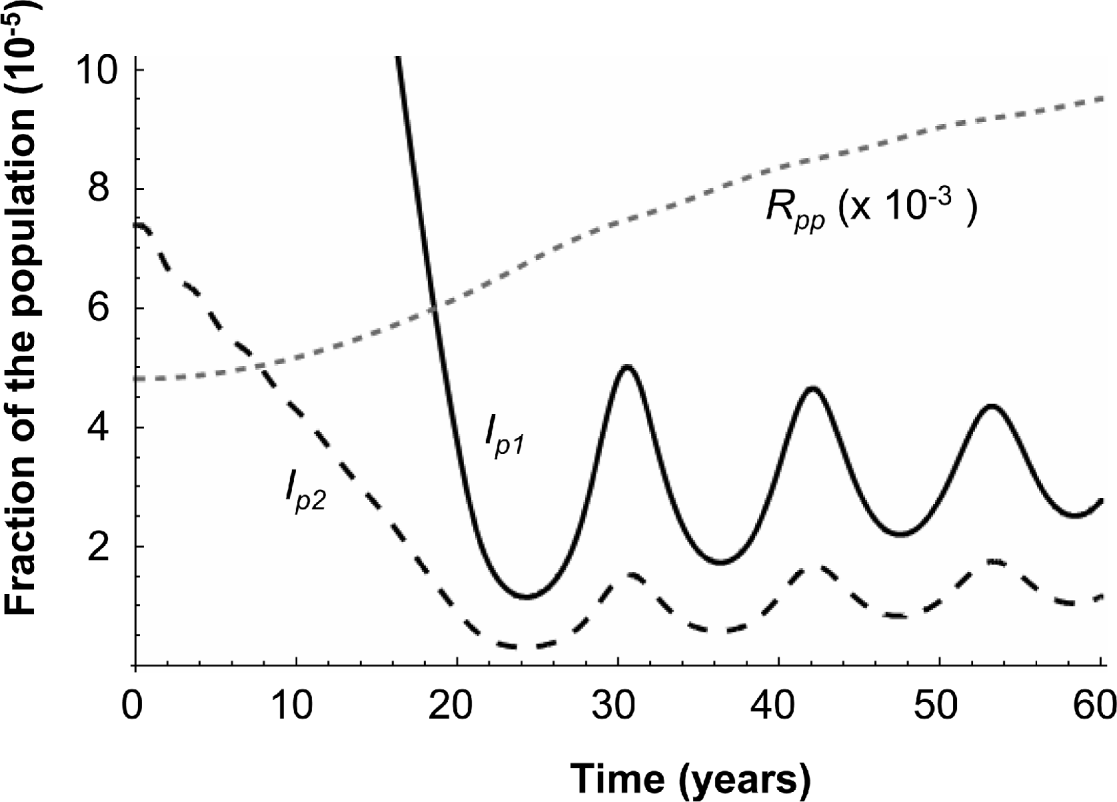
Although the study of equilibrium states can help predict the long-term effects of changes in vaccine coverage or efficacy, they ignore transient dynamics of potentially great importance (Rohani, Keeling and Grenfell, Reference Rohani, Keeling and Grenfell2002; Restif and Grenfell, Reference Restif and Grenfell2007). We performed numerical integration of system (1) using various sets of parameter values (Fig. 4). Simulations were started at the coexistence endemic equilibrium in the absence of vaccine, and vaccine coverage was increased linearly over 20 years up to a given value. In the years that follow the initiation of the vaccination campaign, B. pertussis tends to exhibit a pattern previously described as the ‘honeymoon period’ (McLean, Reference Mclean1995): prevalence drops to low levels, followed by a series of small outbreaks which converge towards a steady state. This pattern is amplified by the presence of B. parapertussis, but is attenuated if immunity is not life-long (Fig. 4). The increase in B. pertussis prevalence after stabilisation of vaccine coverage can be understood by tracking the dynamics of the whole system. Following the drop in B. pertussis prevalence caused by vaccination, the number of individuals immune to B. parapertussis only (R pp) increases and eventually boosts the number of secondary infections with B. pertussis (Fig. 5). The increase is therefore weaker when immunity is shorter-lived, as this depletes the pool of individuals susceptible to B. pertussis only (R pp).
Dynamics of B. pertussis (solid black line) and B. parapertussis prevalence (black dashed line), plotted together with B. pertussis prevalence (grey line) in the absence of B. parapertussis. Initially, the system is at equilibrium without vaccination. Vaccine coverage increases linearly from v=0 at time 0 to v=0·75 (panels A and B) or to v=0·95 (panels C and D) at time 20 years; then v remains constant. Numerical values: 1/μ=70 years, 1/γ=21 days, θpp=0·8, R 0=(1/4·5+σ)/(μ+σ) (so R 0≈15·6 in panel A and 7·1 elsewhere); (A) σ=0, ϕ=0·3, θp=θv=0·3; (B) σ=0·02 years−1, ϕ=0·3, θp=θv=0·3; (C) σ=0·02 years−1, ϕ=0·5, θp=0·3, θv=0·1; (D) σ=0·02 years−1, ϕ=0·5, θp=0·8, θv=0·3.

Dynamics of primary cases of B. pertussis I p 1 (black solid line), secondary cases of B. pertussis I p 2 (dashed black line) and individuals immune to B. parapertussis only after primary infection R pp (dotted grey line). Same conditions as in Fig. 4A.

In contrast, B. parapertussis shows only small perturbations during the same period. As documented by Lautrop (Reference Lautrop1971), the oscillations of the two pathogens are out of phase (i.e. B. parapertussis peaks coincide with B. pertussis troughs). Only if vaccine-induced cross-protection is weaker than the protection caused by B. pertussis infection (i.e. θv<θp), do we predict higher peaks of B. parapertussis when vaccine coverage reaches its plateau (year 20 on Fig. 4C). However, the perturbations of B. parapertussis dynamics do not mirror those of B. pertussis unless we assume symmetric cross-protection from infection (θp=θpp) and weaker vaccine cross-protection (θv<θp) (Fig. 4D).
DISCUSSION
In this paper we have investigated the coexistence of two related pathogens in a host population. Because of cross-immunity, they are in competition for access to hosts and they use different strategies to cope: evade cross-immunity (and gain access to a wider pool of hosts) or invest in higher infectivity (and cause more cases among naïve hosts). We used fresh experimental results to apply this model to the dynamics of Bordetella pertussis and B. parapertussis. Beyond this specific example, our work highlights promising trends in the field of infectious diseases dynamics of co-circulating strains.
Parapertussis dynamics
The basis for this study was the recent finding that B. parapertussis can colonise mice immunized against B. pertussis, whereas immunisation with B. parapertussis is protective against both pathogens (Wolfe et al. Reference Wolfe, Goebel, Bjørnstad, Restif and Harvill2007). This was unexpected as it implies a strong competitive advantage to B. parapertussis, at odds with the general view that B. pertussis is much more prevalent than its relative in human populations. We therefore explored the additional assumption that B. parapertussis may pay a cost, through reduced infectivity. Given the lack of conclusive data on the relative fitness of the two pathogens, we allowed for extensive variations in the cost paid by B. parapertussis. Depending on the trade-off between fitness and immune evasion, our model predicts the conditions for coexistence. As illustrated on Fig. 2, we found that B. parapertussis relative fitness (ϕ) was one of the main determinants of coexistence. Cross-protection parameters had limited effects on the ability of either pathogen to invade but had substantial effects on relative prevalence (Figs 3 and 4). Such variations in prevalence can actually make the difference between persistence and extinction in a population with finite size. Although detailed quantitative investigations are beyond the scope of this study, we expect the precise effects of asymmetric cross-protection on pertussis and parapertussis dynamics to vary locally with population size and structure. Regarding our assumption of fitness reduction, it is of course possible to imagine other possible sources of competitive advantage for B. pertussis, such as preferential access to certain categories of hosts (based on age or immunocompetence for example) or spatial spread (based on differential persistence in given environments for example); but these assumptions remain speculative in the absence of any empirical support.
Anti-pertussis vaccination gives a further advantage to B. parapertussis because of weak cross-protection. Our main conclusion regarding immunisation is that, because of the asymmetry in cross-immunity, the introduction of anti-pertussis vaccination should have little effect on the absolute prevalence of B. parapertussis, while that of B. pertussis should drop. Should the vaccine be more or less cross-protective than B. pertussis infection, then the prevalence of B. parapertussis would slightly decrease or increase. But unless we ignore asymmetric cross-immunity (Fig. 4D), we do not expect a major rise of B. parapertussis following anti-pertussis vaccination. Despite the limited information available on B. parapertussis incidence, two studies appear to corroborate our qualitative insights. First, Lautrop (Reference Lautrop1971) reported a decrease in the incidences of both B. pertussis and B. parapertussis in the ten years that followed the start of mass vaccination in 1959 in Denmark. Interestingly, because he expected the vaccine to confer no cross-protection, he stated that “the reduced size of the B. parapertussis peaks after 1958–59 poses a problem.” More recently, following the reintroduction of anti-pertussis vaccination in Germany in 1994, Liese et al. (Reference Liese, Renner, Stojanov and Belohradsky2003) observed a drop in B. pertussis incidence (from 21·7 per 1000 person-years during 1993–95 to 4·8 per 1000 person-years during 1997–99) together with a slight increase in B. parapertussis (from 1·6 per 1000 person-years in 1993–95 to 2·8 per 1000 person-years in 1997–99). Although the latter two studies are difficult to compare due to the different methods used, the contrasted trends in B. parapertussis incidence in the two countries might have been caused by differences in cross-protection conferred by whole cell B. pertussis (in the Danish study) and acellular vaccine (in the German study). However, it is also conceivable that the drop in Danish B. parapertussis could be coincident due to concurrent secular decreases in birth rates, as discussed for measles by Earn et al. (Reference Earn, Rohani, Bolker and Grenfell2000). Clearly, more longitudinal surveys would be needed to assess the actual incidence of B. parapertussis and its response to vaccination.
Asymmetric cross-immunity
Cross-immunity between strains of pathogens has received particular attention in the context of vaccine development. Indeed, the emergence of antigenic variants that can infect immunized hosts threatens the efficacy of existing vaccines – e.g. human influenza A (Ferguson et al. Reference Ferguson, Galvani and Bush2003) or equine influenza (Grenfell et al. Reference Grenfell, Pybus, Gog, Wood, Daly, Mumford and Holmes2004) – as well as the development of new ones – e.g. HIV (McMichael, Mwau and Hanke, Reference McMichael, Mwau and Hanke2002) or malaria (Genton et al. Reference Genton, Betuela, Felger, Al-Yaman, Anders, Saul, Rare, Baisor, Lorry, Brown, Pye, Irving, Smith, Beck and Alpers2002). These concerns have motivated a growing literature on mathematical models for antigenically diverse pathogens in the presence of a vaccine (McLean, Reference Mclean1995; Gupta, Ferguson and Anderson, Reference Gupta, Ferguson and Anderson1997; Lipsitch, Reference Lipsitch1997; White et al. Reference White, Cox and Medley1998; Wilson, Nokes and Carman, Reference Wilson, Nokes and Carman1999; Park et al. Reference Park, Wood, Daly, Newton, Glass, Henley, Mumford and Grenfell2004; Zhang, Auranen and Eichner, Reference Zhang, Auranen and Eichner2004; Elbasha and Galvani, Reference Elbasha and Galvani2005; Gandon and Day, Reference Gandon and Day2007; Restif and Grenfell, Reference Restif and Grenfell2007). In all of these studies, the main argument is the emergence of a variant strain favoured by a vaccine targeting specifically an endemic strain, because of imperfect cross-immunity. Although we used a different framework in which the two pathogens coexist before the vaccine is introduced, the mechanisms at stake are the same. In some cases, the variant strain has a lower fitness than the resident strain, so that it can only spread if vaccine specificity outweighs this cost. With the exception of White et al. (Reference White, Cox and Medley1998), who briefly mention this scenario, asymmetric cross-immunity in the absence of vaccine has not been considered (see Lipsitch et al. Reference Lipsitch, Dykes, Johnson, Ades, King, Briles and Carlone2000 for asymmetric interactions between Streptococcus pneumoniae strains in the presence of vaccination). The reasons for this lack of interest are twofold. First, conceptually, asymmetric cross-immunity as considered in this study gives a further advantage to the strain not targeted by the vaccine – combining two benefits may not appeal to modellers unless they have a good reason to do so. This leads to the second reason: the lack of empirical evidence. As far as we know, the Bordetella case is a first. It will be interesting to learn if it is an exception, or whether, perhaps, the absence of other cases is due to a lack of investigation.
A recent analytical tool for multi-strain pathogens – antigenic cartography – may provide broader insights into the generality of asymmetric cross-immunity (Smith et al. Reference Smith, Lapedes, De Jong, Bestebroer, Rimmelzwaan, Osterhaus and Fouchier2004). Based on haemagglutination assay tables, this technique provides a graphical representation of virus isolates and immune sera in the ‘antigenic space’. The distance between a strain and a serum in that space indicates the ability of antibodies to bind virus particles. It is then possible to deduce an ‘antigenic distance’ between two viral strains based on their respective distances to a given set of sera. Conceptually, this is similar to the antigenic spaces used in mathematical models for multiple strain dynamics (e.g. Gog and Swinton, Reference Gog and Swinton2002; Gomes, Medley and Nokes, Reference Gomes, Medley and Nokes2002), except for their lack of explicit consideration of serology. If cross-immunity between two strains is described by a distance between these two strains, then symmetry is essentially assumed. However, if cross-immunity is described, more accurately, as the cross-reaction between strains and sera, then the significance of any asymmetries can be fully explored. The antigenic map of human influenza A produced by Smith et al. (Reference Smith, Lapedes, De Jong, Bestebroer, Rimmelzwaan, Osterhaus and Fouchier2004) in Fig. S3, which shows the respective locations of virus strains and their immune sera, suggests that asymmetric cross-immunity is common. Including empirical antigenic spaces in mathematical models would certainly be challenging but it may lead to a better understanding of multiple strain dynamics.
Combining models
More generally, this study illustrates the strength of multi-disciplinary approaches in the field of infectious diseases. Although epidemiological surveys are still needed to gain a full understanding of the spread of infection in natural populations, the combination of experimental and mathematical models is a quick and cost-effective tool to explore hypotheses and make specific predictions. Mathematical models inspired by experiments have flourished in life sciences over the last three decades, boosted by the advent of personal computers allowing numerical analysis and simulations of increasingly complex systems, and by a growing interest among mathematicians and physicists. However, those theoretical models are still quite often met with distrust from biologists, on the grounds of being too simplistic or relying on unproven hypotheses: see for example Smith's (Reference Smith2002) comment on Gandon et al.'s (Reference Gandon, Mackinnon, Nee and Read2001), or Kitching et al.'s (Reference Kitching, Taylor and Thrusfield2007) criticism of Tildesley et al. (Reference Tildesley, Savill, Shaw, Deardon, Brooks, Woolhouse, Grenfell and Keeling2006). In this context, it is important to acknowledge that models, be they in silico, in vitro or in vivo, are only intended to help understand specific aspects of complex systems, and therefore the predictions they produce are always uncertain to some extent. The way forward is then to set up a dialogue between these different approaches, through which theoretical predictions can be tested in the lab and experimental results can help refine mathematical models.
In this paper, we have extrapolated the results of experiments on individual mice, to predict epidemiological consequences at the level of human populations. In building the model, we had to decide how measured reductions in bacterial colonisation should be translated in terms of susceptibility and infectiousness of individuals in a population. We explored one possible scenario which offers the advantage of an easy and flexible integration into well-studied mathematical frameworks. Further experimental work will obviously be needed to reconcile within- and between-host dynamics. Neither the murine model nor the simple theoretical framework used here can faithfully reproduce the complex mechanisms of B. pertussis and B. parapertussis infection dynamics in a real population. As suggested by the scarce data published on B. parapertussis, a detailed survey of the actual epidemiology of the pathogen would be difficult and expensive – though, we believe, very important to attempt. In contrast, our models effectively provide a first series of indications on some of the processes at stake, and offer new keys to interpret empirical observations. We are confident that further research initiated by this work will enable us to improve our models and make more accurate predictions on the circulation of these pathogens.
ACKNOWLEDGEMENTS
We thank B. Grenfell for helpful discussion and two anonymous referees for their comments on the manuscript. This study was supported by NIH grant AI 053075 (E. T. H.).
APPENDIX
Mean age at first infection in a model with waning immunity
We consider a simple extension of the SIR model with a fourth compartment S w for people becoming susceptible after losing their immunity. At steady state, the age structure in the population is described by the following system of equations (based on Anderson and May, Reference Anderson and May1991):

where a represents age as a continuous variable,  is the force of infection and the other parameters (which we assume to be age-independent) are as defined in Table 1. The age-distribution of naïve individuals therefore follows: S(a)=exp[−(Λ+μ)a]. Following Anderson and May (Reference Anderson and May1991), we then express the mean age at first expression A as the first moment of the ΛS(a) distribution:

Relation between R0 and mean age at first infection
In our model the basic reproduction number is given by R 0=β/(μ+γ), while the mean age at first infection in a model with age-independent death rate is given by

where I* is the proportion infected at the endemic equilibrium:

We combined those three equations to obtain, after some algebra:

For pertussis γ>>(μ, σ,1/A), hence, by re-writing:

we finally obtain:

Vaccine thresholds
The critical vaccine coverage is defined for each disease as the minimum coverage preventing the invasion or persistence of infection. Its expression can be obtained either by setting the steady state fraction of infected individuals (endemic equilibrium) to zero or by setting the invasion rate of infection from the disease-free steady state to zero, and solving for the vaccine coverage v. Both methods are equivalent and we shall use the latter.
For pertussis alone, the rate of invasion from disease-free state (Ŝ,  ) is given by:

Hence the corresponding critical vaccine coverage:

For parapertussis alone, the rate of invasion from disease-free state (Ŝ, ) is given by:

Hence the corresponding critical vaccine coverage:

Last, the vaccine threshold that prevents the spread of parapertussis in the presence of pertussis is obtained by setting to zero the following invasion rate of parapertussis from the pertussis-endemic steady state (S*, V*, I p*, R p*):

which leads to the following threshold:

The condition v>v p pp can also be written in terms of B. parapertussis fitness as: