Introduction
Buffalo meat is acquiring more interest regarding the past both for motivations of economic order and for improving knowledge to obtain products of good quality (Ferrara et al., 1994; Gigli et al., 2001).
The main characteristics of buffalo meat are small contents of intramuscular fat (Gigli et al., 2001), a low level of cholesterol and high contents of micro- and macro-elements. Moreover, buffalo meat is adapted to endure various processes of transformation and, in this way, its products are able to find a market for human nutrition utilization.
Ferrell and Cornelius (Reference Ferrell and Cornelius1984) stated that the ideal technique for measurement of body composition should be accurate, easily accomplished, inexpensive, applicable to a wide range of ages and compositions, and capable of being applied to the live animal with minimal perturbation of subsequent performance. Various procedures such as the Fat-O-Meater (Kempster et al., Reference Kempster, Chadwick and Jones1985; Sather et al., Reference Sather, Jones and Robertson1989), the electrical meat measuring equipment (Domermuth et al., Reference Domermuth, Veum, Alexander, Hedrick, Clark and Eklund1976; Fredeen et al., Reference Fredeen, Martin and Sather1979) or total body electrical conductivity (Keim et al., Reference Keim, Mayclin, Taylor and Brown1988; Forrest et al., Reference Forrest, Kuei, Orcutt, Schinckel, Stouffer and Judge1989) have found acceptable results in the estimation of composition of pork carcasses, with similar or better predictive capability compared with direct measurements (R 2 = 0.81) of the longissimus dorsi muscle area, fat depth and carcass weight (Forrest et al., Reference Forrest, Kuei, Orcutt, Schinckel, Stouffer and Judge1989).
An alternative procedure using the bioelectrical impedance analyzer (BIA) has been proposed for humans (Miyatani et al., Reference Miyatani, Kanehisa, Masuo, Ito and Fukunaga2001; Salinari et al., Reference Salinari, Bertuzzi, Mingrone, Capristo, Scarfone, Greco and Heymsfield2003; Stahn et al., Reference Stahn, Terblanche and Strobel2007). This technology, because of its accuracy, simplicity and portability, has been conveniently applied for pig (Swantek et al., Reference Swantek, Crenshaw and Berg1991 and Reference Swantek, Crenshaw, Marchello and Lukaski1992), sheep (Jenkins et al., Reference Jenkins, Leymaster and Turlington1988; Berg et al., Reference Berg, Neary, Forrest, Thomas and Kauffman1996), beef cattle (Marchello and Slanger, Reference Marchello and Slanger1992; Marchello et al., Reference Marchello, McLennan, Dhuyvetter and Slanger1999; Velazco et al., Reference Velazco, Morrill and Grunewald1999) and horse (Forro et al., Reference Forro, Cieslar, Ecker, Walzak, Hahn and Lindinger2000).
These initial findings indicate that BIA has excellent potential as a means of predicting lean and fat-free mass (FFM) and body mass in commercial situations, given its precision, simplicity and portability (Kushner and Schoeller, Reference Kushner and Schoeller1986; Berg et al., Reference Berg, Neary, Forrest, Thomas and Kauffman1996). FFM, also called lean body mass, is the total amount of non-fat (lean) corresponding also to skeletal muscle; therefore an increase in FFM equals an increase in skeletal muscle.
Impedance of a geometric system depends on the conductor length, cross-sectional area and signal frequency. The repeatability of impedance measurements can be improved by using a fixed signal frequency and a constant conductor configuration. The impedance of a biological tissue comprises two components, resistance and reactance. The conductive characteristics of body fluids provide the resistive component, whereas the cell membranes, acting as imperfect capacitors, contribute a frequency-dependent reactive component. Impedance measurements made over a range of low to high (1 MHz) frequencies allow the development of prediction equations; this is known as multi-frequency bioelectrical impedance analysis.
Several authors reported results at 50 kHz in farm animals (Berg et al., Reference Berg, Neary, Forrest, Thomas and Kauffman1996; Swantek et al., Reference Swantek, Marchello, Tilton and Crenshaw1999; Velazco et al., Reference Velazco, Morrill and Grunewald1999). Schoeller (Reference Schoeller2000) assumed that the impedance at 50 kHz is overwhelmed by the extracellular water, and the high correlation between impedance and total body water, as well as the FFM, was due to the close relation of these compartments to the extracellular water.
Bioelectrical impedance methodology utilizing transdermal attachment of electrodes at various frequencies has not been reported in live buffaloes. Because the impedance is frequency dependent, it is favorable to extend the frequency range for greater accuracy. Research on humans at various frequencies suggested confounding frequencies for the best prediction of body composition (Pietrobelli et al., Reference Pietrobelli, Morini, Battistini, Chiumello, Nunez and Heymsfield1998; Tagliabue et al., Reference Tagliabue, Andreoli, Comelli, Bertoli, Testolin, Oriani and De Lorenzo2001). Considering that an increase in FFM corresponds to an increase in skeletal muscle, we have placed attention on the study for the development of a procedure to determine the FFM in buffalo via the measurement of BIA at various frequencies in live animals.
Material and methods
Twenty young buffalo bulls, born and bred in a farm located in the province of Salerno (Italy), after colostrum administration, received a milk replace until weaning. Animals had ad libitum access to a unifeed (49% mais silage, 32% lolium, 7% alfalfa hay, 6% barley flakes and 5% soybean meal). The ration was calculated assigning 0.87 milk forage unit, 15% crude protein (CP) and 50% NDF, supplemented with vitamin–mineral integration. The animals were kept in experimental conditions for 14 months.
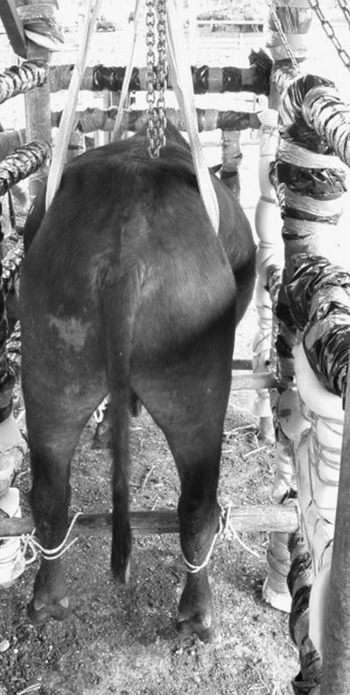
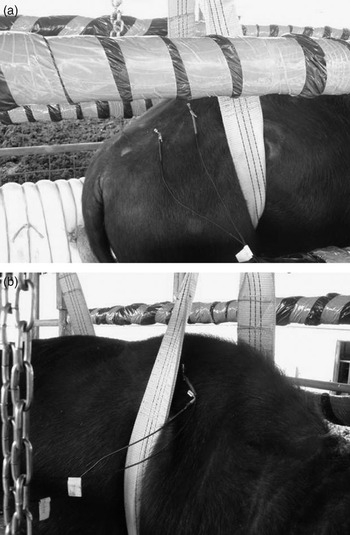
For BIA measurements the buffaloes were sedated using Rompum® with a dose of 0.25 mg/100 kg live weight (LW), enough to immobilize the animals (Figure 1). Two electrodes were placed approximately 1 cm from the dorsal midline, 10–15 cm caudal from the last cervical vertebra and approximately 5 and 10 cm cranial from the first sacral vertebra. The impedenzometric measurements of resistance (Rs) and reactance (Xc) were expressed in kHz (5 to 1000) and was made using electrodes, composed of 20-gauge Vacuteiner needles (Becton Dickinson, Rutherford, NJ), placed in specific locations on the trunk (Figure 2).
Immobilization of the animal.

Specific locations for impedance measurements of Rs and Xc (a) and (b).

The impedenzometric method has been carried out by the Human Im Plus II® instrument. Buffaloes were weighed and BIA measurements were collected 7 days before slaughtering.
The measurements were collected by the same operator in the same environmental conditions. Slaughtering and dissection were according to the ASPA Commission (1991). The sample cut was taken from the left side of sides at the 10th thoracic vertebra level, according to Lanari’s indication (Reference Lanari1973). On the longissimus dorsi section, located between the skull margin of the 9th vertebra and the caudal margin of the last thoracic vertebra of the right side, the chemical–nutritional characteristics of meat were determined according to the ASPA Commission (1991). These measures have not been taken into consideration in the present study, except for fat content, but they will be studied in future work.
The FFM of the subject was calculated by subtracting the product of live body mass and percentage of fat from the live body mass (FFM = live weight − [live weight × % fat/100]) (Lukaski et al., Reference Lukaski, Johnson, Bolonchuk and Lykkenn1985). Jenkins et al. (Reference Jenkins, Leymaster and Turlington1988) defined the non-fat component of carcass composition as the sum of a carcass’s water and chemical CP.
The data analyzed were LW, live volume (Lvol), resistance (Rs) and reactance (Xc) at any frequency.
The data were analyzed by multiple linear regressions (SPSS 12.0, 2003) to evaluate the relationship between FFM and various predictor variables.
Stepwise regression was used to eliminate variables that did not influence variation in the model. The adjusted R 2 selection method, Durbin Watson statistics and Akaike Information Criterion (AIC) statistic were used to make the final decision about the best models. Simple coefficients of correlation were examined for data obtained in live buffaloes.
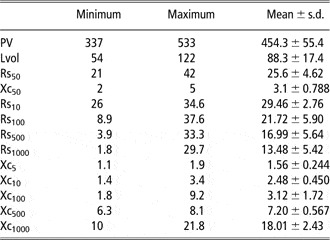
The descriptive statistics of the data analyzed are listed in Table 1.
Descriptive statistics of the data analyzed

Lvol = length2/resistance.
Results and discussion
Table 1 shows the variability of Rs values obtained. Perhaps the increase of kHz induces trouble on signal transmission inside the cellular membrane, which in this case has generated variability of Rs measurements. The table shows also that the value of Rs decreases when the frequency increases, while the values of reactance increase. This is caused, probably, by the fact that electrical impedance is a measure of the resistance of an electrical current through muscle tissue, which is related to the amount of free water in the muscle. This free water, at higher frequency, caused the current dispersion.
Subcutaneous fat content measurement in the buffalo ranged from 14% to 26% with a mean ± s.d. of 17.27 ± 2.86%; intramuscular fat ranged from 2.45% to 6.60% with a mean ± s.d. of 5.11 ± 1.21%.
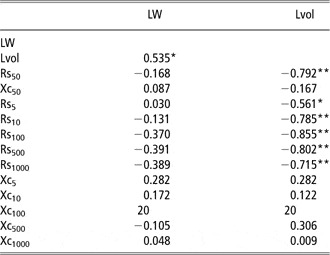
Table 2 shows that Rs and Xc, at any frequency, were not significantly correlated with LW. But resistance measurements decreased as LW increased. This trend is justified by the fact that subcutaneous fat interferes with the transmission of electrical signals. Rs and Xc, at any frequency, were negatively correlated with Lvol. This is justified by the fact that impedance is a geometric system and depends on the physical characteristics of the conductor, than on physical animal characteristics, and on frequency signal.
Correlation between LW, Lvol and values of Rs and Xc at any frequency

*Correlation is significant at 0.05.
**Correlation is significant at 0.01.
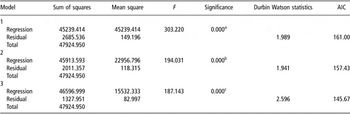
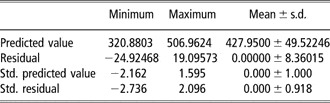
From the examination of regression, it is obvious that it is possible, using LW, Xc500 and Xc1000 as independent variables, to obtain a good prediction model for FFM, even if such a forecast is possible with one or two single parameters (Table 3). Table 3 shows also that the low residual values define the goodness of predicting FFM models in live animal.
Characteristic of model to predicted fat-free mass

aPredictors: (constant), PV.
bPredictors: (constant), PV, Xc500.
cPredictors: (constant), PV, Xc500, Xc1000.
Table 4 shows that the best predicting model was the last one, because when using LW, Xc500 and Xc1000 as independent variables, we obtained the best R 2 Adj, Durbin Watson statistic, AIC and significant level of independent variable.
Regression models for predicting the fat-free mass

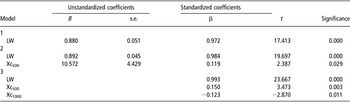
The regression coefficients and standard errors for estimating FFM are presented in Table 5. Although LW accounted for 95% of the variation in FFM, the addition of LW, Xc500 and Xc1000 accounted for 97% of the variation in FFM. LW, Xc500 and Xc1000 were positively related to FFM. These results were similar to those reported by Swantek et al. (Reference Swantek, Marchello, Tilton and Crenshaw1999) to predict FFM in pigs. They are reported in Table 6 in the analysis of residuals for a better understanding of the model studied.
Statistics of unstandardized and standardized coefficients

Residual statistics of the best model considerate

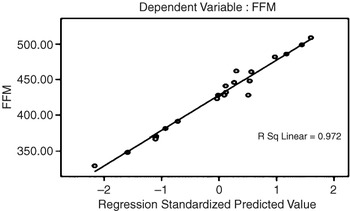
Figure 3 shows the height correlation between the actual and predicting FFM obtained with the 3rd statistical model.
The relationship between fat-free mass (FFM) observed and FFM predicted for the 3rd statistical model. The height correlation between the actual and predicting FFM obtained with the 3rd statistical model is shown. These results indicate that the use of bioelectrical impedance has excellent potential as a rapid, non-destructive procedure and is capable of being applied to the live animal with minimal perturbation on subsequent performance in the buffalo species too.

These results indicate that the use of bioelectrical impedance has excellent potential as a rapid, non-destructive procedure and is capable of being applied to the live animal with minimal perturbation on subsequent performance in the buffalo species too.
Conclusions
The goodness of BIA forecasting depends on homogeneity of parameters, dimension/volume of the studied species and significant sampling. Slanger et al. (Reference Slanger, Marchello, Busboom, Meyer, Mitchell, Hendrix, Mills and Warnock1994) provided, in lambs, excellent correlations (R 2 = 0.97) between FFM and LW, Rs and Xc. BIA may be more precise when larger volumes are measured (Thomson et al., Reference Thomson, Thomas, Ward and Sillence1997). The BIA measurements are lower in cattle, higher in pigs and highest in sheep (Marchello et al., Reference Marchello, McLennan, Dhuyvetter and Slanger1999). Thomson et al. (Reference Thomson, Thomas, Ward and Sillence1997) showed good BIA results from animals in wide ranges of body condition and weight. Our studies indicate that BIA can be used for evaluating FFM in buffalo calf and can be used to indicate the best moment to slaughter animals.
Acknowledgment
We are grateful to Novi Gianfranco, Vito Vitale and Agostino Navarro for technical assistance.