Introduction
In the troposphere, ozone (O3) is one of the most active gases involved in photochemical reactions. In fact, being the precursor of important oxidizing radicals (i.e. OH and NO3), O3 is one of the key agents influencing the oxidizing capacity of the troposphere. In Antarctica, several processes can influence tropospheric O3 concentrations, e.g. photochemical processes involving reactive halogen atoms (Barrie et al. Reference Barrie, Bottenheim, Schnell, Crutzen and Rasmussen1988, Roscoe et al. Reference Roscoe, Kreher and Friess2001, Tarasick & Bottenheim Reference Tarasick and Bottenheim2002) and NOx (Crawford et al. Reference Crawford, Davis, Chen, Buhr, Oltmans, Weller, Mauldin, Eisele, Shetter, Lefer, Arimoto and Hogan2001) as well as transport of air masses from lower latitudes (Murayama et al. Reference Murayama, Nakazawa, Tanaka, Aoki and Kawaguchi1992, Gruzdev & Stinov Reference Gruzdev and Stinov1992) or vertical transport (Grudzev et al. Reference Gruzdev, Elokov, Makarov and Mokhov1993). During the summer season, the photochemical production of NOx (Jones et al. Reference Jones, Weller, Anderson, Jacobi, Wolff, Schrems and Miller2001, Davis et al. Reference Draxler and Rolph2001, Beine et al. Reference Beine, Honrath, Dominè, Simpson and Fuentes2002) due to the photolysis of NO3- in snowpack interstitial air, as well as the photolysis of atmospheric HONO (Yang et al. Reference Yang, Honrath, Peterson, Dibb, Sumner, Shepson, Frey, Jacobi, Swanson and Blake2002), can occur in the Polar Regions thus providing a surprisingly active photochemical environment.
Accurate knowledge of the latitudinal distribution of O3 is needed to improve global modelling of O3 and future levels of atmospheric greenhouse gases. That is why, within the framework of the Italian National Programme of Antarctic Researches (PNRA), continuous measurements of summer surface O3 concentrations have been carried out at the Italian Antarctic research station at Terra Nova Bay (TNB) (Mario Zucchelli Station - 74.7°S, 164.1°E, 41 m a.s.l.) since 2001. In this paper, these near-surface ozone measurements will be presented and analysed for the first time.
Measurement site and method
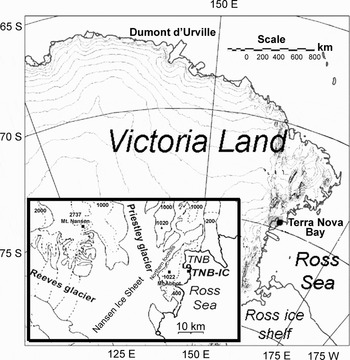
The TNB M. Zucchelli summer station is located on the western edge of the Ross Sea (Fig. 1). During the period 2001–2005, five summer campaigns for the determination of surface O3 concentrations were conducted at the clean-air facility of Icaro Camp (TNB-IC) located on the coast 2 km south from the main station. The O3 measurements were undertaken in a purpose designed shelter with an air intake 5 m above the surface composed of a 2 m long Pyrex stack (67 mm diameter) enclosed in a steel cover. Air is forced through this by a blower with a flux velocity ranging from 1–3 m s-1. Ozone measurements (at 1.8 l min-1) were made every minute and with a precision and accuracy of ± 1 ppbv. Zero and span checks were automatically performed every 24 hours. Moreover, after each experimental campaign the O3 analyser (DASIBI 1108 PC) was returned to the factory for ordinary maintenance and calibration. Standard meteorological parameters were continuously observed at 1 min intervals using an IRDAM WST7000 meteorological station at a height of 6 m above the ground. Surface measurements of shortwave incoming solar radiation (SWin) were obtained using a CNR-1 Kipp & Zonen radiometer with a sensitivity of 10–35 µV Wm-2 in the spectral range from 305–2800 nm.
Location of TNB and TNB-IC (map adapted by www.climantartide.it).

At TNB-IC, the seasonal behaviour of SWin is characterized by a seasonal cycle with a relatively flat maximum in December (not shown here). Because of this characteristic pattern O3 and meteorological parameters (on hourly basis) as well as SWin (daily average values) have been analysed only for December from 2001–2005 (see next section).
The mean temperature during the selected period was -1°C and ranged from -10°C to 9°C at TNB-IC. More than the 30% of the hourly temperature values were above freezing. As a result, the area around the O3 sampling site was not uniformly covered by snow during the summer season and rocky formations were often visible. As pointed out by Argentini & Mastrantonio (Reference Argentini and Mastrantonio1994) and Argentini et al. (Reference Argentini, Del Buono, Della Vedova and Mastrantonio1995), the wind regime at TNB is influenced by a nearby mountain barrier (i.e. the Northern Foothills) which interacts with the katabatic circulation from two glaciers (i.e. Reeves and Priestley glaciers see Fig. 1), by barrier flows moving parallel to the Trans-Antarctic Mountains and finally by southerly winds related to meso- or synoptic scale lows in the western Ross Sea. This was also the case for TNB-IC where wind speeds higher than 6 m s-1 (a threshold value suggested by Argentini et al. (Reference Argentini, Del Buono, Della Vedova and Mastrantonio1995) to identify katabatic flows at TNB during summer) were mostly from the SW–NW sector and to a lesser extent from the south (not shown here).
Results and discussion
Environmental data analysis
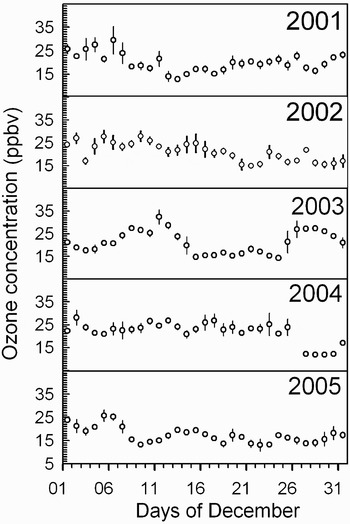
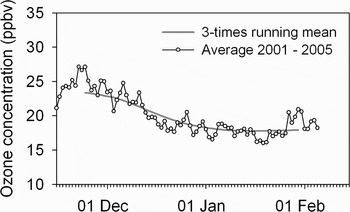
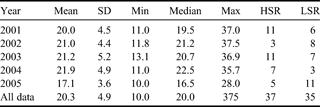
The O3 data recorded for December 2001–2005 are shown in Fig. 2, while a statistical overview is provided in Table I. We considered hourly O3 deviations (O3RES) from a smoothed seasonal curve. This curve was obtained by computing, for each year, the average daily O3 values. Then we averaged all the available years of data, thus obtaining the mean O3 value for each given day (Fig. 3). Finally, we applied a three-time repeated 19-day moving average to obtain the seasonal fluctuation in the O3 time series (Sebald et al. Reference Sebald, Treffeisen, Reimer and Hies2000, Tarasova & Karpetchko Reference Tarasova and Karpetchko2003). The resulting seasonal O3 cycle is characterized by a declining trend from November–January, in agreement with data from other coastal sites in Antarctica (Helmig et al. Reference Helmig, Oltmans, Carlson, Lamarque, Jones, Labuschagne, Anlauf and Hayden2007).
Mean daily O3 values at TNB-IC during December 2001–2005. The vertical lines mark the daily standard deviation values.

Calculated average O3 behaviour at TNB-IC for summer seasons 2001–2005 (open circles). The grey line represents the smoothed behaviour obtained by applying recursive (19-day) running mean.

Basic statistical parameters (expressed as ppbv) for O3 at TNB-IC as well as the number of “high solar radiation” (HSR) or “low solar radiation” (LSR) days selected during December from 2001–2005.
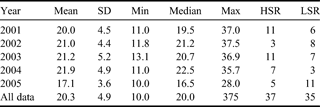
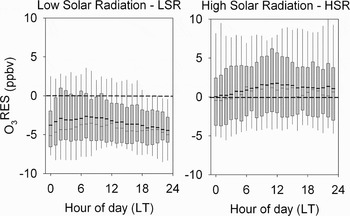
We identified days characterized by high solar radiation fluxes (HSR days) when the daily SWin was greater than the 75th percentile over the period 2001–2005 (i.e. 406.6 W m-2). In the same way, we identified low solar radiation days (LSR days) when the daily SWin was lesser than the 25th percentile over the period 2001–2005 (i.e. 299.3 W m-2). This allowed us to select 37 HSR days and 35 LSR days at TNB-IC (see Table I). On average, hourly O3 concentrations recorded during HSR days were 4.5 ppbv (+ 27%) higher than for LSR days. This difference is significant at the 95% confidence level, using a Student t-test. During LSR days on average no diurnal variation was present, while for the HSR days an O3 increase was detected around noon (Fig. 4). This diurnal variation with an amplitude of 1.7 ppbv (6.5 ppbv, considering the 75th percentile of hourly O3 values), suggests that photochemical O3 production processes are active in this Antarctic environment.
Diurnal variation of O3RES at TNB-IC during LSR and HSR days (December 2001–05). The lowest box boundary indicates the 25th percentile, the thin (dashed) line within the box marks the median (mean value), and the highest box boundary indicates the 75th percentile. Whiskers (error bars) above and below the box indicate the 90th and 10th percentiles.

Ozone data analysis
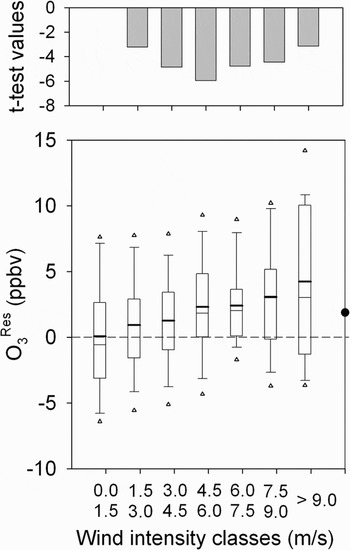
To identify the processes leading to the high O3 values recorded at TNB-IC during HSR days, O3RES data were firstly related to local wind intensity using a box-and-whiskers plot. The boxes and whiskers denote the 10, 25, 50, 75 and 90 percentiles, and the bold lines the mean values of the O3RES distributions for different classes of wind intensity (Fig. 5). The results show that O3RES values shift towards higher values with increasing wind intensity, thus suggesting that the observed O3 concentrations could be affected by non-local sources. Observations carried out at other Polar sites (Crawford et al. Reference Crawford, Davis, Chen, Buhr, Oltmans, Weller, Mauldin, Eisele, Shetter, Lefer, Arimoto and Hogan2001, Davis et al. Reference Draxler and Rolph2001, Beine et al. Reference Beine, Honrath, Dominè, Simpson and Fuentes2002) suggested that, under strong wind conditions, the O3 production efficiency related to local NOx emission from snow is low. Moreover, the low snow cover around TNB-IC rules out the possibility that local emissions of NOx from surface snow represent a significant contribution to the O3 increases during HSR days. To investigate what type of transport processes could affect the O3 concentrations, the O3RES data were successively sorted in two classes according to a hypothetical separation value of wind intensity ranging from 1.5–9 m s-1. Following Gerasopoulos et al. (Reference Gerasopoulos, Zanis, Stohl, Papastefanou, Ringer, Tobler, Hubener, Gaggler, Kanter, Tositti and Sandrini2001), we compared the overall mean of O3RES calculated above and below each wind intensity threshold value reported in the x-axis of Fig. 5. The results indicate a transition class at about 4.5–6 m s-1, where the difference between the two means is maximized in absolute terms. In fact, it is for this wind speed that the t-test parameter achieved the greatest absolute value (Fig. 5. upper section). A separation value of 4.5–6 m s-1 is comparable with the threshold identified by Argentini et al. (Reference Argentini, Del Buono, Della Vedova and Mastrantonio1995) to determine the onset of katabatic flows at TNB. Moreover, 92% of wind speeds higher than 6 m s-1 (which account for 15% of the HSR days) were from the SW–NW, confirming the influence of katabatic flows (Argentini et al. Reference Argentini, Del Buono, Della Vedova and Mastrantonio1995). During summer, katabatic winds are less frequent than during winter. In summer, downslope flows are usually related to synoptic forcing (Bromwich et al. Reference Bromwich, Parish, Pellegrini, Stearns and Weidner1993) or nocturnal katabatic breezes (Cava et al. Reference Cava, Schipa, Tagliazucca, Giostra and Colacino2004). Summer katabatic events can also be triggered by synoptic disturbances. For instance, Carrasco & Bromwich (Reference Carrasco and Bromwich1995) observed a cyclonic circulation supporting a katabatic event (with north-westerly wind direction) at the Reeves Glacier. Nevertheless, once established, these summer katabatic flows transport negatively buoyant air from the Antarctic plateau through narrow glaciated valleys (e.g. Priestly and Reeves glaciers) and finally over the steep coastal slopes. Here, these katabatic outflows favour the presence of clear sky conditions (Bromwich et al. Reference Bromwich, Monaghan, Powers, Cassano, He-Lin, Ying-Hwa and Pellegrini2003) and consequently high solar radiation fluxes at the surface.
O3RES for HSR days as function of wind intensity classes. Box-and-whiskers are defined as Fig. 4, but the 5th and 95th percentiles are also reported (triangles). On the upper plate, the t-test values for the significance of the difference between the average of O3RES for when sorted according to a separation value of wind intensity are reported.

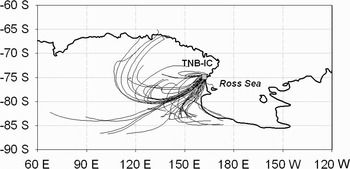
To support this hypothesis, for each of the HSR days, 72-hour back-trajectories have been calculated with a time step of three hours using the Hybrid Single Particle Lagrangian Integrated Trajectory model - HYSPLIT (Draxler & Rolph Reference Draxler and Rolph2003). It should be noted that both due to the coarse FNL meteorological data resolution and the complex topography around TNB areas, caution should be take in interpreting back-trajectory results. Nevertheless, these trajectories should identify the synoptic-scale circulation of air masses. The results show that for wind speeds greater than 6 m s-1 (Fig. 6), the air masses were mostly of continental origin. As observed by Crawford et al. (Reference Crawford, Davis, Chen, Buhr, Oltmans, Weller, Mauldin, Eisele, Shetter, Lefer, Arimoto and Hogan2001) and Davis et al. (Reference Davis, Nowak, Chen, Buhr, Arimoto, Hogan, Eisele, Mauldin, Tanner, Shetter, Lefer and McMurry2001), during summer the surface layer of the Antarctic plateau represents a net source of O3 and its precursors (i.e. NOx emitted by the snow surface). Moreover, Weller et al. (Reference Weller, Jones, Wille, Jacobi, McIntyre, Sturges, Huke and Wagenbach2002) suggested that for coastal sites with pronounced katabatic winds, a significant summertime contribution to the NOy chemistry might be due to air transport from the Antarctic plateau. The increase of O3 levels at TNB-IC recorded in connection with strong winds blowing from continental areas (from SW–NW), could thus also be a result of air mass transport from the Antarctic plateau. However, as the O3 mixing ratio in the Antarctic troposphere increases with altitude (Grudzev & Stinov 1992, Tarasick & Bottenheim Reference Tarasick and Bottenheim2002), contributions related to vertical transport cannot be excluded. Although it is well established that ozone increases systematically with altitude in the troposphere (Staehelin et al. Reference Staehelin, Thudium, Buelher, Volz-Thomas and Graber1994), Murayama et al. (Reference Murayama, Nakazawa, Tanaka, Aoki and Kawaguchi1992) found that during the period from late spring to summer O3 increases only gradually with height in the lower troposphere and only at altitudes higher than 4 km steeply increases, based on O3 concentrations reported from ozone soundings from Syowa station (69.0°S, 39.5°E).
72 hour back trajectories ending at TNB-IC and calculated during HSR days for local wind intensities greater than 6 m s-1.

To investigate the possibility that air transport from the upper troposphere/lower stratosphere could affect TNB-IC during the HSR days we considered the vertical displacement of the HYSPLIT 72-hour back-trajectories before reaching the measurement site. Only 15% of the trajectories start at altitudes above 4 km a.s.l. Moreover, about 75% (50%) of the trajectories remained at an altitude below 400 m above ground level during the last 180 km (350 km) before reaching TNB-IC. This supports the theory that O3 increases recorded at TNB-IC are caused by air masses originating from low altitudes above the Antarctic continent.
For wind speeds below 6 m s-1 an average O3RES of 1.0 ppbv was recorded, but the O3RES diurnal cycle amplitude increased to 2.3 ppbv suggesting the existence of local processes affecting O3 concentrations. Winds weaker than 6 m s-1 came from the following sectors: north (31%), north-east and south (both 21%). Highly significant enhanced O3 concentration was associated with winds from N (O3RES = 2.1 ppbv), which included the TNB main station facility, where diesel generators were operating. With no NOx or particle measurements at TNB-IC during the considered periods, we suspected that these enhanced O3 concentrations could be due to the emission of “local pollution” from the exhaust of the TNB main station facility. In fact, during previous measurements carried out during the summers 1997 and 1998, high levels of NO2 and NOy were identified and related with local pollution from the Italian station main facilities (Allegrini et al. Reference Allegrini, Ianniello, Vazzana, Montagnoli, Valentini, Colacino and Giovanelli2000). During HSR days, significantly enhanced O3 concentrations were also observed with winds from the east and south-east (O3RES = 1.0 ppbv). As these observations were mostly recorded under very low wind intensities (< 2 m s-1), they were also attributed to emissions from the main Italian station. Finally, O3 concentrations representative of the TNB-IC average conditions (i.e. O3RES = -0.1 ppbv) were recorded in connection with winds from the south. Usually, air masses from this direction have had no trajectory over the Antarctic continent, but were rather advected to TNB-IC by cyclonic areas situated over the western Ross Sea. This pathway provides photochemical processes little opportunity to add or remove O3 to/from the air masses before reaching the measurement site.
On LSR days, lower than average O3 concentrations (O3RES: -3.4 ppbv) were recorded at TNB-IC (Fig. 4). Probably, these low O3 values were related both to the origin of air masses reaching the measurement site and the weather conditions. In fact, LSR days were often related (about 40% of time) with humid air masses (average RH value: 79%) coming from sectors ranging from east to south, which includes the Ross Sea. Moreover, the METAR (METeorological Aerodrome Report; WMO 1995) available for the years 2001–2004 at the TNB aviation field (about 2 km away from our sampling site), indicated snow events or drifting snow for most of the LSR days (about the 85%). During LSR days, significantly lower than average O3 concentrations were recorded also in connection with northerly winds (averaged O3RES = -2.3 ppbv), suggesting a possible influence due to O3 titration by NOx from the main Italian station and/or lower photochemical O3 production under low SWin.
Calculation of PSS-derived O3 concentrations
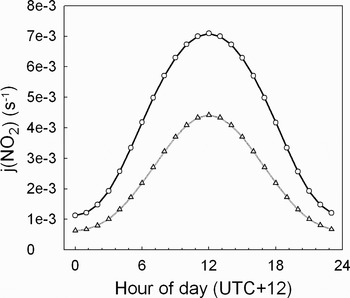
To investigate the possibility that local emissions from the TNB main facilities can lead to photochemical O3 production during HSR days, a simple steady-state kinetic scheme was applied to a representative HSR day (16 December 2004) during which O3 showed an evident diurnal cycle in conjunction with a weak northerly wind from the Italian station. The amount of visible and UV solar irradiance as well as the j(NO2) values were calculated using the Tropospheric Ultraviolet Visible (TUV) radiative transfer model (Madronich & Flocke Reference Madronich, Flocke and Boule1998). To evaluate the effect on solar irradiance as well as on the photolysis rate constant produced by realistic Cloud Optical Depth (COD) values (Barnard and Long Reference Barnard and Long2004), TUV was run both assuming clear sky (COD = 0, Fig. 7) and cloudy conditions (COD = 10, Fig. 7).
16 December 2004: diurnal cycles of j(NO2) simulated for TNB-IC by using the TUV model and assuming the following Cloud Optical Depth (COD): COD = 0 (open circles), COD = 10 (solid triangles).

Hourly O3 concentrations were calculated basing on the photochemical steady state (PSS) approximation for NOx and O3, which is assumed to be determined by the following reaction (Seinfeld & Pandis Reference Seinfeld and Pandis1998, Volz-Thomas et al. Reference Volz-Thomas, Paetz, Houben, Konrad, Mihelcic, Kluepfel and Perner2003):



Under this assumption, the O3 temporal evolution can be calculated by the following equation (Chudzyński et al. Reference Chudzynski, Czyzewski, Ernst, Pietruczuk, Skubiszak, Stacewicz, Stelmaszczyk, Szymanski, Sowka, Zwozdziak and Zwozdziak2001):

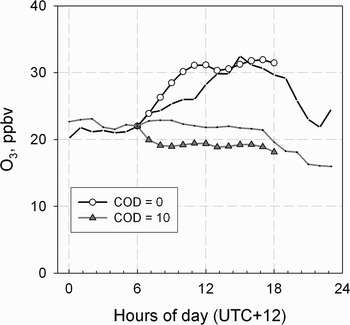
[NO]0 and [NO2]0 denote the initial values for the considered species, and for the rate constant k 3 the formula recommended by the NASA panel was applied (k = 3 × 10-12 exp(-1500/T) cm-3 s-1), as indicated by Sander et al. (Reference Sander2000). Because no [NO]x data were available from TNB-IC for this period, we used a value of 100 pptv for [NO2]0, as measured by Allegrini et al. (Reference Allegrini, Ianniello, Vazzana, Montagnoli, Valentini, Colacino and Giovanelli2000) in conjunction with local pollution episodes at TNB. [NO]0 was found using the best fit between the O3 calculation and the experimental data. Note that early morning and late afternoon O3 values were not calculated because solar intensity was too low and varied rapidly, preventing the PSS reaching equilibrium (Carpenter et al. Reference Carpenter, Clemitshaw, Burgess, Penkett, Cape and McFadyen1998). Figure 8 compares measured O3 data and PSS-derived O3 values for the different COD values. For clear sky conditions (COD = 0), a quite good agreement between measured and calculated O3 was found assuming a [NO]0 of 25 pptv, while for COD = 10 the O3 concentration inferred from the PSS equations strongly underestimated the experimental data. On the other hand, the results obtained for COD = 10 trace quite well the temporal evolution of O3 recorded during a representative LSR day (31 December 2003) characterized by air masses coming from the Italian station. In fact, during this LSR day the O3 concentrations systematically decreased at TNB-IC as is well reproduced by the PSS calculation (Fig. 8). The above results suggest that relatively high NOx values can be transported from the Italian station to the measurement site leading to O3 production in presence of sufficient solar radiation.
O3 concentrations recorded on the HSR days 16 December 2004 (black line) with O3 concentrations calculated assuming a PSS approximation for polluted NOX levels (Allegrini et al. Reference Allegrini, Ianniello, Vazzana, Montagnoli, Valentini, Colacino and Giovanelli2000) as well as for different Cloud Optical Depth (COD): COD = 0 (open circles), COD = 10 (solid triangles). For comparison, O3 concentrations recorded on a representative LSR day (31 December 2003) were also reported (solid lighter line).

Conclusions
Analysis of hourly O3 concentrations recorded for December over the five years 2001–2005, shows that for HSR days significantly higher O3 values (21.3 ppbv) were recorded compared to LSR days (16.8 ppbv). Transport processes during strong wind events from the Antarctic continental area (SW–NW) could explain part of the high O3 values recorded during HSR days. Three-dimensional back-trajectories confirm that air mass transport from the interior of the continent can significantly affect surface O3 at the measurement site. If we assume that TNB-IC is affected by katabatic flows when local wind speed exceeds 6 m s-1 from SW–NW directions, this contribution amounts to 17% (3.4 ppbv) of the December mean O3 concentration. Even if contributions from higher tropospheric levels cannot be ruled out, for coastal regions frequently affected by katabatic flows (i.e. TNB-IC) the contribution from the Antarctic plateau is probably more important, as these air masses can be enriched in photochemical O3 produced by the precursors emitted by the snow pack during summer (Crawford et al. Reference Crawford, Davis, Chen, Buhr, Oltmans, Weller, Mauldin, Eisele, Shetter, Lefer, Arimoto and Hogan2001, Oltmans et al. Reference Oltmans, Johnson and Helmig2007).
The data also suggest that under high solar radiation fluxes, the main facilities of the Italian station are a source for surface O3 at TNB-IC. In fact, during HSR days a significant (at the 95% confidence level) O3 increase (+7%, 1.5 ppbv) has been recorded in conjunction with air masses originating from the main Italian station. A simple O3 calculation based on NOx–O3 chemistry using the PSS approximation and driven by solar radiation fluxes provided by a TUV model was performed. During two representative HSR and LSR days, the daily evolution of the calculated O3 concentrations compares favourably with observed data, assuming NOx levels that are representative for local pollution. This further suggests that the emissions from the Italian station could affect O3 levels at TNB-IC, which should be carefully considered when estimating background O3 conditions at this measurement site.
Acknowledgements
We thank the Italian National Antarctic Programme (PNRA) for funding the activities at the “M. Zucchelli” station at Terra Nova Bay. Part of this work was supported by ACCENT (GOCE-CT-2003-505337). The authors gratefully acknowledge the NOAA Air Resources Laboratory (ARL) for the provision of the HYSPLIT transport and dispersion model and/or READY website (http://www.arl.noaa.gov/ready.html) used in this publication.