



No CrossRef data available.
Homer Gets a Tax Cut: Inequality and Public Policy in the American Mind
Published online by Cambridge University Press: 09 March 2005
Abstract
In 2001 and 2003, the Bush administration engineered two enormous tax cuts primarily benefiting very wealthy taxpayers. Most Americans supported these tax cuts. I argue that they did so not because they were indifferent to economic inequality, but because they largely failed to connect inequality and public policy. Three out of every four people polled said that the difference in incomes between rich people and poor people has increased in the past 20 years, and most of them added that that is a bad thing—but most of those people still supported the regressive 2001 Bush tax cut and the even more regressive repeal of the estate tax. Several manifestly relevant considerations had negligible or seemingly perverse effects on these policy views, including assessments of the wastefulness of government spending and desires for additional spending on a variety of government programs. Support for the Bush tax cuts was strongly shaped by people's attitudes about their own tax burdens, but virtually unaffected by their attitudes about the tax burden of the rich—even in the case of the estate tax, which only affects the wealthiest one or two percent of taxpayers. Public opinion in this instance was ill informed, insensitive to some of the most important implications of the tax cuts, and largely disconnected from (or misconnected to) a variety of relevant values and material interests.Larry M. Bartels is the Donald E. Stokes Professor of Public and International Affairs at Princeton University (bartels@princeton.edu). He directs the Center for the Study of Democratic Politics in Princeton's Woodrow Wilson School of Public and International Affairs. This article is a revised and abridged version of a paper originally presented at the 2003 annual meeting of the American Political Science Association and subsequently presented in seminars and conferences at the University of Michigan, the Center on Budget and Policy Priorities, the Brookings Institution, Harvard University, Demos, and Princeton University, and at the 2004 meeting of the Russell Sage Foundation's University Working Groups on the Social Dimensions of Inequality. The author is grateful to numerous seminar and conference participants, colleagues, students, and friends for their criticism and support. He is also grateful to the Russell Sage Foundation for generous financial support of his research through a grant to the Princeton Working Group on Inequality, and for additional support of the primary data collection on which the present report is based.
Information
- Type
- Research Article
- Information
- Copyright
- © 2005 American Political Science Association

For the past thirty years, the United States has been conducting what one observer has called “a massive social experiment” regarding the political and social consequences of increasing economic inequality.1
Samuelson 2001, 45.
Jencks 2002, 64.
In light of these developments, business writer Robert Samuelson argued, “If Americans couldn't abide rising inequality, we'd now be demonstrating in the streets.”5
Samuelson 2001, 45.
The $4.6 trillion figure includes additional interest payments stemming from the resulting increase in the federal budget deficit, and it assumes that a variety of nominally temporary rate reductions and credits will subsequently be made permanent. See Springer 2003.
This calculation assumes that major provisions scheduled to expire by 2010 will, in fact, be extended. Absent that assumption, the total tax cut for the richest one percent is reduced by about one-third and the total tax cut for the bottom 95 percent is reduced by about one-half. See Citizens for Tax Justice 2003.
What is most remarkable is that this massive upward transfer of wealth was broadly supported by ordinary Americans. For example, polls conducted by CBS News and Fox News shortly before the first big tax cut was passed found the public favoring President Bush's tax cut plan by 14- and 22-point margins, respectively.8
CBS News Poll, April 4–5, 2001: “Do you favor or oppose George W. Bush's $1.6 trillion tax cut for the country over the next 10 years?” (Favor, 51 percent; Oppose, 37 percent; Don't know, 12 percent.) Fox News/Opinion Dynamics Poll, March 28–29, 2001: “Based on what you know about it, do you favor or oppose President Bush's proposal for a 1.6 trillion dollar tax cut over the next 10 years?” (Favor, 55 percent; Oppose, 33 percent; Not sure, 12 percent.) These and other data from commercial opinion surveys cited in this article are reproduced from Polling Report.com (http:/www.pollingreport.com/budget.htm).
Gallup Poll, July 19–22, 2001: “Do you think that the new tax cut law will be a good thing for the country, will not make much difference, or will be a bad thing for the country?” (Good thing, 40 percent; Not much difference, 39 percent; Bad thing, 18 percent; No opinion, 3 percent.) ABC News/Washington Post Poll, July 26–30, 2001: “As you may know, Congress has approved a tax cut of nearly 1.4 trillion dollars over the next 10 years. In general, do you think this tax cut will be good for the economy, bad for the economy, or won't it make much difference?” (Good, 37 percent; Bad, 20 percent; Won't make much difference, 42 percent; No opinion, 1 percent.)
Harris Poll, June 10–15, 2003: “The Congress passed and the President has signed a new tax cut. Overall do you think this tax cut was a good or bad thing?” (Good thing, 50 percent; Bad thing, 35 percent; Not sure/Refused, 14 percent.) Pew Research Center of the People and the Press, July 14–August 5, 2003: “In recent years, President Bush and Congress have made two major cuts in federal income tax rates. Do you approve or disapprove of these tax cuts?” (Approve, 54 percent; Disapprove, 37 percent; Don't know, 9 percent.)
These high levels of public support are especially impressive in light of the fact that many people seem to have recognized the class bias of the Bush tax cuts. For example, the CBS News poll conducted just before the passage of the 2001 tax cut found 55 percent saying that “rich people” would benefit most from it, while the Harris poll conducted just after the passage of the 2003 tax cut found 54 percent saying the division of benefits between the rich, the middle class, and the poor was “generally unfair” and 85 percent saying that their own family would benefit “only a little” or “not at all.”11
CBS News Poll, April 4–5, 2001: “From what you've heard so far, who do you think would benefit most from George W. Bush's tax cut plan: rich people, poor people, or middle-income people?” (Rich people, 55 percent; Poor people, 4 percent; Middle-income people, 26 percent; Other, Don't know, 13 percent.) Harris Poll, June 10–15, 2003: “Do you think the tax cut is generally fair as to how it is divided between the rich, middle class or poor, or is it generally unfair?” (Generally fair, 34 percent; Generally unfair, 54 percent; Not sure, 13 percent.) “How much do you think you and your family will benefit from the tax cut: a lot, only a little or not at all?” (A lot, 8 percent; Only a little, 51 percent; Not at all, 34 percent; Not sure, 7 percent.)
My aim here is to explore the bases of this strong public support for the Bush tax cuts. The primary data for my analysis come from the 2002 American National Election Studies (NES) survey.12
National Election Studies 2002. The data, codebooks, and more detailed information about the study design are publicly available from the NES Web site, www.umich.edu/∼nes. The survey included 1,511 respondents interviewed by telephone in the six weeks before the 2002 midterm election; 1,346 of these respondents (89 percent) were reinterviewed in the month after the election. Some of the questions analyzed here were included in the preelection survey, some appeared in the postelection survey, and some were randomized (asked of half the respondents in the preelection wave and of the other half in the postelection wave). The NES staff produced two sets of sampling weights, one for the preelection data (V020101) and the other for the postelection data (V020102). Most of my analyses include data from the postelection survey (whether as dependent variables, explanatory variables, or instrumental variables), and so employ the postelection weights. However, in a few cases (for example, in reporting distributions of responses for preelection questions) I am able to include respondents who were not reinterviewed after the election, and in those cases I employ the preelection weights.
The inequality module in the 2002 NES survey was funded by a grant from the Russell Sage Foundation to Larry M. Bartels, Nancy Burns, and Donald R. Kinder, and was designed by Bartels, Burns, and Kinder in collaboration with the NES Board of Overseers, with helpful advice from participants in the Russell Sage Foundation Social Inequality Summer Workshop, Madison, Wisconsin, June 2002.
The results of my analysis suggest that most Americans supported tax cuts not because they were indifferent to economic inequality, but because they largely failed to connect inequality and public policy. Three out of every four people in the NES survey said that the difference in incomes between rich people and poor people has increased in the past 20 years, and most of them added that that is a bad thing—but most of these people still supported President Bush's tax cuts and the repeal of the estate tax. People who wanted to spend more money on a variety of specific government programs were, if anything, more likely to support tax cuts than those who did not, other things being equal, while those who said that “people in the government waste a lot of money we pay in taxes” were markedly less supportive of the Bush tax cut than those with more optimistic views about government efficiency. Finally, and perhaps most strikingly, people's opinions about tax cuts were strongly shaped by their attitudes about their own tax burdens, but virtually unaffected by their attitudes about the tax burden of the rich—even in the case of the estate tax, which only affects the wealthiest one or two percent of taxpayers.
Americans' Attitudes about Economic Inequality
Why do millions of ordinary Americans support massive tax breaks for the rich in an era of accelerating economic inequality? One common hypothesis is that they do so because they embrace an American ideology of opportunity in which economic inequality is natural and unobjectionable. Samuelson's explanation for the fact that we are not “demonstrating in the streets” is that, “On the whole, Americans care less about inequality—the precise gap between the rich and the poor—than about opportunity and achievement: are people getting ahead?”14
In the same vein, Nathan Glazer has argued that “Americans, unlike the citizens of other prosperous democracies, not to mention those of poor countries, do not seem to care much about inequality.”15Glazer 2003, 111.
Analysts of American ideology have often emphasized the potential for conflict and contradiction between the core values of economic opportunity and political equality. For example, Jennifer Hochschild reported that her rich and poor respondents alike “define political freedom as strict equality, but economic freedom as an equal chance to become unequal.”16
Hochschild 1981, 111, 278.
Verba and Orren 1985, 251.
In light of these conflicts and complexities, it should not be surprising that analysts have also noted important exceptions to the general pattern of acceptance of economic inequality. For example, Hochschild found that “almost everyone, rich and poor, is incensed that the very wealthy do not pay their fair share of taxes. They argue that loopholes are too large and that the tax structure itself is insufficiently progressive.” 20
Hochschild 1981, 280.
McClosky and Zaller 1984, 177–78. Some evidence suggests that Americans' attitudes about inequality have shifted in recent years. For example, in a 1987 survey conducted as part of the International Social Survey Program, Americans who agreed that “income differences are too large” outnumbered those who disagreed by 38 percentage points, while the corresponding figure in 2000 was 54 percentage points (McCall 2003). Over the same period, the average coefficient of variation in the salaries respondents said people should earn in a variety of specific jobs declined by almost 25 percent, while Americans' acceptance of the proposition that “large income differences are unnecessary for a country's prosperity” rose to a level virtually identical to those prevailing in the United Kingdom, Germany, Spain, Sweden, and Norway (Osberg and Smeeding 2003).
The 2002 NES survey included questions probing respondents' perceptions of economic inequality, its causes, and its consequences. Here too is a good deal of evidence contradicting the notion that Americans are indifferent to growing economic inequality. For example, table 1 presents the distribution of responses to a sequence of questions assessing respondents' recognition of and reaction to the marked increase in income inequality over the past two decades. The first question asked whether “the difference in incomes between rich people and poor people in the United States today is larger, smaller, or about the same as it was 20 years ago”; those who said “larger” or “smaller” were asked whether the difference is much larger or smaller or only somewhat larger or smaller, and were also asked whether the change is a good thing or a bad thing.
Table 1: Perceptions of economic inequality

The distribution of responses in table 1 demonstrates widespread public recognition of the sheer fact of growing economic inequality in contemporary America. Almost 75 percent of respondents said the difference in incomes between rich and poor people was larger than 20 years ago, and more than 40 percent said it was much larger; only about 8 percent said it was smaller. Moreover, a majority of those who recognized that income inequality has increased thought that was “a bad thing”; most of the rest “haven't thought about” whether it is good or bad, while only about 5 percent said it was a good thing.
If we ask, in the spirit of Hochschild, whether there is potential political support for egalitarian redistribution in these responses, the obvious place to begin is with the 30 percent of the public who said that the difference in incomes between rich and poor is much larger than it was and that that is a bad thing. These people are at the core of a somewhat larger group, consisting of a little more than 40 percent of the public, which both recognized and regretted the fact that economic inequality has increased. In contrast, outright supporters of economic inequality—those who applauded the fact that inequality has increased or believed with regret that inequality has declined—constituted only about 6 percent of the public.
The remainder of the public can be thought of as divided into two broad groups. One group, 25 percent of the total population, did not recognize that economic inequality has increased. These people lacked, but could conceivably acquire, a factual basis for seeing growing economic inequality as a public policy problem. The other group, almost 30 percent of the public, recognized that inequality has increased but had not thought about whether that is good or bad. These people seem to have lacked a moral or pragmatic basis for seeing growing economic inequality as a public policy problem. Perhaps, like a few of the people in Hochschild's much more detailed conversations about distributive justice, they “do not seek redistribution because they do not care one way or the other about it.” But if her respondents are indicative, it is more likely that they simply “are not forced to face the question of redistribution” in their day-to-day lives.22
Hochschild 1981, 279, 278.
The NES survey also included both open-ended and fixed-choice questions inviting respondents to explain why, “in America today, some people have better jobs and higher incomes than others do.”23
Half the respondents got the open-ended questions in the preelection survey and the fixed-choice questions in the postelection survey; the other half got the fixed-choice questions in the preelection survey and the open-ended questions in the postelection survey. My analysis here is limited to the fixed-choice questions, regardless of whether they were asked before or after the election. The responses from the two random half-samples were similar, except that those who responded in the preelection survey attached somewhat more importance to “government policies”—despite the fact that subsequent portions of the pre- and postelection interviews called attention to a variety of relevant government tax and spending policies.
Table 2: Explanations for economic inequality

The quintessential American belief that economic success is a matter of hard work fares well in table 2, with about 45 percent of the public saying unequal effort is a “very important” cause of economic inequality. However, there is even more support (about 55 percent) for the notion that unequal access to a good education is very important; and two other structural factors, discrimination and government policies, also loom fairly large as explanations for economic inequality. It does not seem that most Americans view economic inequality as a merely natural phenomenon, even if it is attributable in part to in-born or God-given differences in ability or character.
In addition to exploring public views about economic inequality as a general phenomenon, the NES survey probed respondents' more specific views about inequality in the domain of tax policy with questions about the perceived tax burdens borne by the respondents themselves, “rich people,” and “poor people.” The distributions of responses to these questions are presented in figure 1.24
The tax burden questions were each asked twice, once before and again after the election. The preelection and postelection responses were similar, and are combined in figure 1.

Figure 1: Perceived tax burdens
Perhaps unsurprisingly, almost half of the NES respondents said they are asked to pay more than they should in federal income taxes; but a similar proportion said they are asked to pay “about the right amount.” (Fewer than 4 percent said they are asked to pay less than they should.) The distribution of responses is similar for the question about the tax burden of “poor people.” Almost 45 percent of respondents said that poor people are asked to pay more than they should, while a similar percentage said that poor people are asked to pay about the right amount, and fewer than 10 percent said that poor people are asked to pay less than they should. In striking contrast, more than half the respondents said that rich people are asked to pay less than they should, while fewer than 15 percent said that rich people are asked to pay more than they should. If there is any coherent public demand for tax burden-shifting evident in these responses, it is for an upward shift from the poor and middle class to the rich rather than the reverse.
Taken as a whole, the data from the 2002 NES survey reveal very little popular enthusiasm for economic inequality. Americans may cling to their unrealistic beliefs that they too can become wealthy; but in the meantime they do not seem to cherish those who already are. Fewer than 7 percent say that a larger income gap between the rich and the poor is a good thing (or that a smaller gap is a bad thing). Fewer than 15 percent say the rich are asked to pay too much in taxes, while three times that many say the poor are asked to pay too much in taxes. And the public as a whole likes “big business” even less than it likes people on welfare, liberals, feminists, the news media, and the Catholic Church.25
Respondents in the 2002 NES survey were asked to rate a wide variety of public figures, institutions, and social groups on a “feeling thermometer” ranging from 0 to 100. “Big business” got an average rating of 48.8, as compared with 52.8 for “people on welfare,” 51.1 for “liberals,” 53.0 for “feminists,” 52.3 for “the news media,” and 51.6 for “the Catholic Church.” The only group with a lower average score was “gay men and lesbians,” at 46.2. The average rating for “poor people” was 65.6.
Public Support for the 2001 Tax Cut
Tax cutting was the centerpiece of George W. Bush's 2000 presidential campaign platform. Less than five months after President Bush took office, and at his urging, Congress passed a major package of tax cuts, including phased reductions in federal income tax rates, increased child credits, higher limits on contributions to tax-free retirement and educational savings accounts, and a gradual elimination of the federal estate tax. According to the Joint Committee on Taxation, the total package will cost the federal treasury more than $1.3 trillion (plus interest) through 2010.26
At that point all of the changes are scheduled to expire, returning the whole tax system to the status quo ante; however, most observers seem to agree that future Congresses will feel compelled to make the cuts permanent, at an additional cost to the Treasury of more than $200 billion per year.The 2001 tax cut was widely criticized for providing too much tax relief to the wealthy and too little to the middle class and the working poor. For example, a study released by Citizens for Tax Justice estimated that the top 1 percent of households will receive a total of $477 billion in tax breaks over the ten-year period (an average of $342,472 each), while the bottom 60 percent will receive a total of $268 billion (an average of $3,251 each). Moreover, because most of the broad-based tax cuts in the law took effect immediately, while most of the benefits for very wealthy taxpayers were back-loaded, “the distribution of the tax cuts changes remarkably over time,” with the estimated share of benefits going to the top 1 percent of households increasing gradually from 7.3 percent in 2001 to 51.8 percent in 2010.27
Anyone looking at the data presented in figure 1 regarding public attitudes about the tax burden borne by rich people would have good grounds to imagine that a tax cut aimed so disproportionately at very wealthy people would generate substantial public opposition. However, the same NES survey that showed majority support for the proposition that rich people pay less than they should in federal income taxes also demonstrated a remarkable degree of public support for policies designed in large part to reduce the tax burden on the rich.
The 2002 NES survey included two sets of questions about tax cuts, one (in the preelection wave of the survey) specifically on the 2001 tax cut and the other (in the postelection wave) on the ongoing controversy about “doing away with the tax on large inheritances.” Having reported elsewhere on the bases of public support for estate tax repeal,28
I focus here on respondents' views regarding the “big tax cut” passed in 2001. The question was asked in two forms: half of the respondents were asked about the tax cut “Congress passed,” while the other half were asked about the tax cut “President Bush signed.” The distributions of opinion for both versions of the question are shown in figure 2.
Figure 2: Public support for a big tax cut
Both versions of the tax cut question invited respondents to say that they “haven't thought about” whether they favored or opposed the 2001 tax cut. Remarkably, in view of the fiscal and political significance of the tax cut, more than 40 percent of the respondents availed themselves of that opportunity. Even associating the tax cut with President Bush only reduced that proportion to about 35 percent, while asking about the tax cut “Congress passed” left more than 45 percent of the sample unable to say whether they favored or opposed it.29
The proportion of the NES sample who said they “haven't thought about” whether they favored or opposed the tax cut in the fall of 2002 is quite similar to the proportions who said it would “not make much difference” in the 2001 Gallup and ABC News/Washington Post polls cited in note 9. This similarity suggests that the apparent shallowness of public opinion evident in the NES data is not simply the result of temporal distance from the policy debate or distraction due to intervening events.
Among those who did express an opinion for or against the tax cut, supporters outnumbered opponents by more than 2 to 1, regardless of which version of the question they answered.30
Here too the results from the NES survey are consistent with those from the summer of 2001 cited in note 9.
Still, the fact that more than 40 percent of the respondents in the NES survey admitted that the 2001 tax cut was something they “haven't thought about” suggests that public opinion in this domain probably should not be taken wholly at face value. Notwithstanding the vastness of the stakes, public thinking about this issue seems to have been remarkably superficial. A good deal of further evidence of public inattention and ignorance in the general domain of tax policy appeared in a 2003 survey of Americans' views on taxes sponsored by National Public Radio, the Kaiser Family Foundation, and Harvard's John F. Kennedy School of Government.31
Asked whether they pay more in federal income tax or Social Security and Medicare tax, 34 percent of respondents said they didn't know (and most of the rest were wrong). Asked whether they were eligible for the Earned Income Tax Credit, 28 percent said they didn't know. Asked whether Americans pay more or less of their income in taxes than Western Europeans, 42 percent said they didn't know. Asked whether they had heard about a proposal in Washington to do away with taxes on corporate dividends—the centerpiece of President Bush's new tax proposal and a prominent feature of political debate in the month before the survey—61 percent said no. Asked whether the 2001 tax cuts should be sped up, 48 percent said they didn't know. Asked whether the cuts should be made permanent rather than being allowed to expire in 2011, 60 percent said they didn't know. Asked whether speeding up the cuts and making them permanent would mainly help high-income, middle-income, or lower-income people, 41 percent said they didn't know. Asked whether “most families have to pay the federal estate tax when someone dies or only a few families have to pay it,” half of the respondents mistakenly said that “most families have to pay,” while an additional 18 percent said they didn't know. And more than two-thirds of those who favored repealing the inheritance tax endorsed as a reason for doing so that “It might affect you someday”—a wildly optimistic assessment for all but the very wealthiest survey respondents.Survey results like these make it clear that most ordinary citizens are remarkably ignorant and uncertain about the workings of the tax system and the policy options under consideration, or actually adopted, in Washington. They are unclear about many basic facts in the realm of tax policy, and a fair amount of what they “know” is patently false. In that light, perhaps it should not be surprising that so many of them, when offered the chance, admit that they “haven't thought about” whether they favored or opposed a policy whose consequences are reckoned by experts in trillions of dollars. “Public opinion” about tax policy is a very fragile construct. Nevertheless, to the extent that it exists at all, it seems to have been highly supportive of tax cuts along the lines pursued by President Bush.
Both of these conclusions are at striking variance with the claim of Jacob Hacker and Paul Pierson that the 2001 tax cut was “directly at odds with majority views.”32
They ground that claim in survey data of two sorts. First, they observe—as I have observed here—that many people want the rich to pay more, not less, in taxes and objected to the upper-class tilt of President Bush's tax-cut package. Second, they cite the results of surveys in which respondents were offered various specific choices between tax cuts and other possible uses of the short-lived federal budget surplus, including “preserving” Medicare and Social Security, spending more on health, education, and other domestic programs, and paying down the national debt. Given these choices, support for tax cuts dropped considerably, ranging from 16 percent to 36 percent depending upon the specific menu of options and on question wording.33If one shares Hacker and Pierson's view that “the crucial issue in gauging public preferences is … how voters weighed the tradeoff between tax cuts and other governing priorities,” their evidence suggests that the Bush tax cuts were, as they put it, “unsettling” to “those committed to core principles of democratic governance.”34
Ibid., 38, 49.
Schattschneider 1942, 52.
The remainder of my analysis attempts to account for that response. However, to do so I must also dispense with Hacker and Pierson's notion that there was any “clear” or “consistent” public opinion, one way or the other, about the Bush tax cuts.36
Even among the three-fifths or so of the public who claimed to have “thought about” whether they favored or opposed President Bush's policy initiative, opinion was neither clear nor consistent. Indeed, the most important features of that opinion, in my account, are that it was ill informed, insensitive to some of the most important implications of the tax cuts, and oddly disconnected from (or misconnected to) a variety of relevant values and material interests.Unenlightened Self-Interest
How can ordinary people in a state of ignorance and uncertainty orient themselves with respect to complex issues of public policy? The hypothesis explored here is that they do so, in large part, on the basis of simple-minded and sometimes misguided considerations of self-interest. On its face, this hypothesis seems at odds with the fact that so many supporters of the Bush tax cuts said they thought their own families would benefit “only a little” or “not at all.”37
The marginal distributions of responses from the June 2003 Harris Poll cited in notes 10 and 11 above imply that at least 70 percent of those who said the new tax cut was a good thing must also have said that they and their family would benefit “only a little” or “not at all,” while fewer than 20 percent could have said that they would benefit “a lot.”
Respondents in the 2002 NES survey were not asked directly whether they thought they would benefit personally from the Bush tax cut or from repealing the inheritance tax. However, the question about respondents' perceptions of their own tax burdens can shed significant indirect light on the impact of perceived self-interest among other potential influences on their policy preferences. To the extent that respondents who believe that they are asked to pay too much in taxes are also more likely to support tax cuts, it seems plausible to infer that the additional support has something to do with their subjective sense of their own tax burden, and thus with their perceived self-interest. The parallel questions in the NES survey about the tax burdens of the rich and the poor provide a valuable check on reasoning of this sort, since more general antipathy to taxes would presumably be reflected in one or both of those questions as well as in the question about respondents' own tax burden.
Table 3 presents the results of a series of regression analyses relating NES respondents' views about the 2001 tax cut to various measures of perceived self-interest and political values, including these perceived tax burdens.38
The parameter estimates reported in table 3 are from instrumental variables regressions with perceived tax burdens in the postelection survey used as instruments for the corresponding perceived tax burdens in the preelection survey. (Since the tax cut questions appeared in the preelection wave of the survey, using perceived tax burdens in the postelection wave as instruments for perceived tax burdens in the preelection wave rather than vice versa guards against the possibility that survey context or question ordering effects inflate the relationship between perceived tax burdens and views about the tax cut.) The instrumental variables estimator produces less efficient parameter estimates than ordinary regression analysis, but avoids substantial biases due to measurement error in the perceived tax burdens. The correlations between perceived tax burdens in the preelection and postelection surveys were 0.55 for respondents' own taxes, 0.55 for the rich, and 0.44 for the poor. Even with some allowance for genuine change in respondents' views between surveys, correlations of this magnitude suggest that the responses are subject to substantial measurement error. As a result, ordinary regression parameter estimates corresponding to the instrumental variables parameter estimates in table 3 are greatly attenuated; for example, the ordinary regression estimate for the effect of Rich Tax Burden in the simplest model reported in table 3 is about 40 percent smaller than the corresponding instrumental variables estimate.
A more complex estimation strategy designed to guard against potential selection bias due to this censoring of the sample (Heckman 1979) generally produced very similar results.
Table 3: Self-interest, political values, and support for the 2001 tax cut

Given the extent to which the actual benefits of the 2001 tax cut were skewed toward the rich, one might expect principled support or opposition to the tax cut to track closely with attitudes about the tax burden of the rich. The results presented in the first column of table 3 suggest that those attitudes were strongly related to support for the Bush tax cut—that is, people who thought the rich pay too much in federal income taxes were more likely to favor the tax cut, while those who thought the rich pay too little were less likely to support it.40
The results reported in table 3 are from simply combining the data for respondents who were asked about the tax cut “Congress passed” and those who were asked about the tax cut “President Bush signed.” Results for these two half-samples considered separately (not shown) suggest that the impact of respondents' own perceived tax burdens was much greater for the tax cut “Congress passed” than for the tax cut “President Bush signed.” In the absence of any clear cues about where the tax cut came from or whose interests it served, respondents seem to have relied even more heavily on simple-minded self-interest in deciding what (if anything) they thought about it. The half of the public who thought their own tax burdens were about right were roughly equally likely to favor or oppose the tax cut, while the half who thought their own taxes were too high were virtually certain to support it. In contrast, those who were asked about the tax cut “President Bush signed” seem to have weighed their own tax burdens less heavily in deciding what they thought about it. Associating the tax cut with President Bush produced a higher level of across-the-board support and probably also emphasized the relevance of views about the tax burdens born by the rich (though this difference between the two half-samples is rather imprecisely estimated).
The sensitivity of respondents' policy views to their own perceived tax burdens provides strong indirect evidence of the effect of perceived self-interest. But what makes this perceived self-interest “unenlightened”? Any reasonably sophisticated calculation of self-interest would have to take account of the net effect of the tax cut on the respondent's future well-being, which would require some assumptions about second-order effects in the form of future tax increases, budget deficits, and government spending cuts. One calculation, based on the simple assumption that these indirect costs associated with the tax cut would be distributed in proportion to household income, suggests that 79 percent of all households are likely to be net losers, with average losses in the bottom four-fifths of the income distribution averaging about $240 per year and average gains in the upper fifth of the income distribution averaging about $950 per year.41
While the assumptions underlying this calculation are obviously debatable, any plausible accounting would confirm that the vast majority of families outside the top income quintile will see their share of the federal tax burden increase as a result of the Bush tax cuts. It seems almost as clear that most of these families will see their absolute tax burdens increase as well, once compensating increases in state and local taxes and future increases in federal taxes are accounted for. Thus the notion that support for the tax cuts was a sensible assertion of material self-interest on the part of (most) respondents who were bothered by the unfairness of their own tax burdens is dubious, at best.
The second column of table 3 presents the results of a slightly more elaborate version of the analysis, with family income and party identification included as additional explanatory factors.42
I used respondents' reported votes in the 2000 presidential election as an instrument for Republican Party Identification; the correlation between party identification and reported presidential votes was 0.60.
It is also worth noting that, while partisanship has a strong and predictable relationship to policy views, with Republicans much more likely than Democrats to favor the Bush tax cut, income has a much less predictable, and negative, impact: respondents with higher family incomes were significantly less supportive of the tax cut than those with lower incomes, other things being equal. Given the strong connection between income and net benefits from the tax cut, this result suggests that real material interests cannot have been a very important determinant of respondents' policy preferences.
The analysis presented in the third column of table 3 adds two more explanatory factors—conservative ideology and government spending preferences.43
Respondents who were interviewed in both waves of the 2002 NES survey were asked whether federal spending in each of 17 specific areas should be increased, decreased, or kept about the same. The 17 spending items focused on “building and repairing highways,” “AIDS research,” “welfare programs,” “public schools” (or “big-city schools”), “dealing with crime,” “child care,” “homeland security” (or “the war on terrorism”), “unemployment insurance,” “defense,” “environmental protection,” “aid to poor people” (or “aid to the working poor”), “foreign aid,” “Social Security,” “tightening border security to prevent illegal immigration,” “aid to blacks,” “preventing infant mortality,” and “pre-school and early education for poor children” (or “pre-school and early education for black children”). Half the respondents were asked the first eight items in this list in the preelection wave of the survey and the last eight items in the postelection wave, while the other half were asked the last eight items in the preelection wave and the first eight items in the postelection wave. Since the distributions of responses for the two sets of items were similar I treated them as interchangeable, using a simple average of the eight spending items included in each respondent's postelection interview as instruments for a similar index composed of the eight items in the preelection wave (with each items coded +1 for “increased,” –1 for “decreased,” and 0 for “kept about the same”). The correlation between the preelection and postelection indexes of Government Spending Preferences was 0.55. I also constructed an instrument for Conservative Ideology based on the difference in “feeling thermometer” ratings assigned to “conservatives” and “liberals”; the correlation between these thermometer differences and respondents' self-placements on the 7-point liberal-conservative scale was 0.58.
The fourth column of table 3 tests one further potential explanation for tax-cut preferences—perceptions of government waste.44
I used responses to questions about trust in government, the political influence of “big interests,” and the extent to which “the people running the government are crooked” to construct an instrument for Perceptions of Government Waste; the multiple correlation between responses to these questions and responses to the government waste question was 0.36.
Taken as a whole, the analyses presented in table 3 suggest four important conclusions. First, opinions about tax policy are shaped by broad political values such as partisanship and ideology. As in the case of the state-level “tax revolt” of the late 1970s,45
liberals and Democrats were much less susceptible than conservatives and Republicans were to the simple allure of lower taxes.Second, it is striking that, once these broad political values are accounted for, perceptions about the tax burden of the rich had no apparent impact on views about the 2001 tax cut. Thus the one question in the NES survey that seems objectively most relevant to whether people should favor or oppose tax cuts targeted very disproportionately to wealthy taxpayers turns out to contribute nothing at all to explaining their policy preferences.
Third, objective material self-interest fares equally badly as an explanation of public support for tax cutting. Respondents with higher family incomes were consistently less enthusiastic about the Bush tax cuts than those with lower incomes, despite the fact that they were much more likely to be net beneficiaries.46
In addition to the linear effects of family income reported in table 3, I examined a variety of potential nonlinear effects. All of these analyses suggested that, ceteris paribus, support for the 2001 tax cut peaked among respondents with incomes well below the median level and declined at an accelerating rate among those with higher incomes. Including a simple indicator variable for respondents with incomes in the upper quintile—a good proxy for net beneficiaries from the tax cut by the calculation of Gale, Orszag, and Shapiro 2004—produced a parameter estimate of −0.223 (with a standard error of 0.091), again suggesting a pattern of support precisely opposite to what we would expect if respondents' policy preferences accurately reflected their own economic interests.
Finally, and most importantly, respondents' subjective perceptions of their own tax burdens had a consistent and very substantial effect on their views about the 2001 tax cuts, regardless of which general measures of political attitudes are included in the analysis. Indeed, in the most elaborate version of the regression analysis, respondents' attitudes about their own tax burdens had a bigger effect on their policy preferences than any of the other explanatory factors I have considered here, including party identification, conservative ideology, and perceptions of government waste. Moreover, since respondents were much more likely to say that their own tax burdens were too high than to say that they were too low, this effect of “unenlightened self-interest” is extremely consequential for the aggregate distribution of policy preferences, accounting for more than three-fourths of the substantial net support for the 2001 tax cut in the NES sample.47
The sample mean value for the (–1 to +1) tax cut variable (excluding respondents who said they “haven't thought about” whether they favored or opposed it) is 0.359. Multiplying the sample mean value for Own Tax Burden among these same respondents, 0.483, by the corresponding parameter estimate in the fourth column of table 3, 0.575, accounts for 77 percent of this net support.
The Impact of Political Information
So far, I have argued that public support for President Bush's tax policies derived in considerable part from “unenlightened” considerations of self-interest on the part of people who did not recognize the implications of Bush's tax cuts for their own economic well-being or their broader political values. Millions of citizens say that the federal government should spend more on a wide variety of programs, that the rich are asked to pay too little in taxes, and that growing economic inequality is a bad thing. Yet they simultaneously support policies whose main effects will be to reduce the tax burden of the rich, constrain funding for government programs, and exacerbate growing economic inequality. One is left to wonder how these people would resolve the contradictions implied by their simultaneous antipathies toward inequality and taxation—if they recognized those contradictions.
Elsewhere, I have proposed a way to explore admittedly hypothetical questions of this sort by observing how the political preferences of well-informed citizens differ from those of less informed citizens who are similar in politically relevant ways.48
Bartels 1990. Along related lines see Bartels 1996; Delli Carpini and Keeter 1996; Fishkin 1997; Gilens 2001.
Here, I examine the effect of political information by comparing the views of better- and worse-informed respondents in the NES survey using a measure of political information based on interviewers' ratings of respondents' “general level of information about politics and public affairs.”49
The 2002 NES survey did not include the battery of political information “quiz” items included in most recent NES surveys. Thus I rely on the subjective rating of respondents' “general level of information about politics and public affairs” (on a five-point scale ranging from “very low” to “very high”) provided by the interviewer at the end of the preelection interview. For evidence regarding the validity of the interviewers' assessments of respondents' political information, see Zaller 1985.
As in table 3, the parameter estimates are from an instrumental variables regression analysis with reported 2000 presidential votes used as an instrument for party identification. In addition, I use the interviewer rating provided (almost always by a different interviewer) at the end of the postelection interview as an instrument for the preelection rating; the correlation between the two measures is 0.35.
Table 4: Political information, perceptions of inequality, and opinions about the 2001 tax cut

Well-informed citizens in the NES survey had systematically different views about the extent and implications of economic inequality in American society. For example, they were a good deal more likely to perceive that “the difference in incomes between rich people and poor people in the United States today” is larger than it was 20 years ago; the predicted response for a political independent with average family income ranges from 0.284 (about halfway between “about the same” and “somewhat larger”) at the lowest information level to 0.752 (halfway between “somewhat larger” and “much larger”) at the highest information level.51
It is natural to wonder whether this apparent effect of political information simply reflects the fact that interviewers assigned higher information scores to respondents who knew how the difference in incomes between rich people and poor people had changed over the past 20 years. However, my use of the postelection information rating as an instrumental variable has the beneficial side effect of purging the interview-specific variance in the preelection information rating, including any variance attributable to responses to the income gap question itself.
Political information also seems to have made people who recognized that incomes have become more unequal a great deal more likely to say that that is “a bad thing”; here, the predicted response for a political independent with average family income ranges from −0.015 (i.e., “haven't thought about it”) at the lowest information level to 0.922 (virtually certain to say that growing economic inequality is “a bad thing”) at the highest information level. Better-informed respondents were also much more likely to recognize the broader social implications of economic inequality. For example, when asked whether “a poor person has the same chance of getting a fair trial as a wealthy person does,” even the least informed respondents were more likely to disagree than to agree, but the most informed respondents were almost certain to disagree.52
The parameter estimate for political information in an instrumental variables regression model paralleling those reported in table 4 is 0.542 (with a standard error of 0.237). In this case, the predicted response for a political independent with average family income ranges from 0.342 at the lowest information level to 0.884 at the highest information level (on a scale where −1 represents agreement with the proposition that “a poor person has the same chance of getting a fair trial” and +1 represents disagreement).
Better-informed people also provided systematically different explanations for economic inequality, stressing social causes (inequality in educational opportunities, discrimination, and government policies) more heavily than less informed people did. They were also somewhat less likely to say that rich people are asked to pay too much in taxes—but no more or less likely to say that poor people are asked to pay too much, or that they are asked to pay too much. Nor were they more or less likely to think that corporate accounting scandals are widespread. As for perceptions of the partisan politics of inequality, they were much more likely to recognize the differences in positions of the Democratic and Republican parties on specific tax policies, and much more likely to say that the Republicans are “generally better for rich people” and that the Democrats are “generally better for poor people.”
Better-informed respondents in the NES sample were also much more likely to say they had “thought about” whether they favored or opposed the “big tax cut” passed in 2001. The direction of this difference is hardly surprising, but its magnitude is impressive. Respondents at the top of the political information scale were virtually certain to express an opinion one way or the other, while those at the bottom of the political information scale were virtually certain to say that they “haven't thought about” the tax cut.54
As with the estimated effects of information on perceptions of inequality, this relationship cannot be the result of interviewers basing their ratings of respondents' political information on whether the respondents claimed to have “thought about” the tax cut, since the assessment of political information that is doing the work in the instrumental variables regression analysis is derived from a separate interview conducted weeks later, almost always by a different interviewer.
Finally, and most importantly, better-informed respondents were much more likely to express negative views about the 2001 tax cut. The predicted response for a political independent with average family income (on a scale with −1 corresponding to “strongly opposing” the tax cut and +1 corresponding to “strongly favoring” it) ranges from 0.84 for the least informed respondents, indicating almost certain support, to −0.06 for the most informed respondents, indicating that they were at least as likely to oppose the tax cut as to favor it. If we take this cross-sectional difference in views as indicative of the effect of information on political preferences, it appears that the strong plurality support for Bush's tax cut in figure 2 is entirely attributable to simple ignorance.
Lest this conclusion seem too simple, note that the apparent effect of political information on support for repealing the inheritance tax is a good deal more subtle. Unlike support for the 2001 tax cut, which declined markedly with increasing information, support for repealing the inheritance tax was virtually constant across information levels, controlling for partisanship and family income. Thus, there is no reason to imagine that a general increase in political information would, by itself, make the American public any less enthusiastic about the idea of repealing the inheritance tax.
Political information did produce markedly less support for repealing the inheritance tax among the subset of survey respondents (about 40 percent) who both recognized and regretted the fact that the difference in incomes between rich people and poor people in the United States today is larger than it was 20 years ago. But among the remaining respondents—those who lacked either a factual basis or a moral basis (or both) for thinking of growing economic inequality as a problem that might be exacerbated by repealing the inheritance tax—political information was associated with a marked increase in support for repeal.55
In an instrumental variables regression analysis paralleling the analysis in the last column of table 4, the parameter estimate for political information was 0.043 (with a standard error of 0.233). For the subsample of respondents who said that income differences have grown and that that is a bad thing the corresponding parameter estimate was −0.828 (with a standard error of 0.356). For the subsample of respondents who didn't know or didn't mind that income differences have grown, the parameter estimate for political information was 0.820 (with a standard error of 0.353).
Chump Change
In January 2003, several weeks after the completion of the 2002 NES survey, President Bush proposed an “economic growth” package including more than $700 billion in further tax cuts (and $4 billion for personal reemployment accounts).56
The Joint Committee on Taxation put the 10-year total price tag at $726 billion, including $396 billion for the dividend tax repeal.
Critics called attention to the apparent mismatch between the upper-class tilt of the new round of proposed tax cuts and the putative goal of short-term economic stimulus.57
Critics were not alone in noting this apparent mismatch. According to one sympathetic political columnist, George F. Will (2003), “When critics say the plan the president proposed Tuesday will have negligible short-term stimulative effects, the right responses are: Of course. And: good” (p. A19).
Sloan 2003, 53.
Andrews 2003, BU 15.
In late March, three pivotal moderate Republican senators concerned about the budget deficit and the cost of the war in Iraq sided with Democrats in moving to limit the new tax cut to $350 billion—less than half of what President Bush had proposed. Republicans in the House and Senate bargained, postured, and traded accusations of “arrogance and broken promises” for two more months before settling on a compromise bill brokered by Vice President Richard Cheney.60
The bill succeeded in fitting much of what President Bush had asked for into a $318 billion ten-year plan by making the most popular elements—tax breaks for married couples and an increased child credit—expire in two years, and the more expensive cuts in taxes on dividends and capital gains expire in five years. The revised package was passed by the House (231–200) and by the Senate (51–50, with Vice President Cheney casting the tie-breaking vote).This new round of tax cuts was subjected to scathing criticism, not only from the political left but also from the center. According to political columnist David Broder, “The Republicans in Congress cobbled together one of the strangest, least plausible tax bills in history and sent it off to President Bush, who discovered hidden virtues in a measure whose provisions he had repeatedly called woefully inadequate for the task of stimulating a sickly economy.”61
A former Republican cabinet official complained in equally strong terms about “Republicans' irresponsible obsession with tax cutting.”62Peterson 2003, 18.
Criticism of the tax cut was heightened when it became clear that a “last-minute revision by House and Senate leaders” would prevent millions of families with incomes between $10,500 and $26,625 from receiving $400 checks that reflected the increased child credit in the new bill.63
Firestone 2003, A1.
Despite a good deal of elite criticism of the magnitude, rationale, and distributional consequences of the 2003 tax cut, it too garnered substantial public support. In a Harris Poll conducted shortly after it passed, 50 percent of the respondents said it was a good thing, while only 35 percent said it was a bad thing. Several weeks later, a Pew Research Center survey that reminded respondents that “President Bush and Congress have made two major cuts in federal income tax rates” found 54 percent approving of those cuts and only 37 percent disapproving.64
The dates and question wordings for these surveys appear in note 11 above.
The only surveys I have seen in which pluralities of the public opposed the 2003 tax cut were those in which the question wording called attention to formidable counterarguments such as the cost of the war in Iraq or the escalating federal budget deficit. For example, an April 2003 Los Angeles Times poll found a majority agreeing that the United States “cannot afford a 350 billion dollar tax cut” that “would increase the deficit at a time when Bush is requesting an additional 75 billion dollars in immediate funding to finance the war in Iraq,” and an even larger majority agreeing that “the tax cuts should not go through” if “that means money will have to be taken out of Social Security funds to pay for other government programs.”
One possible response to this sequence of events is to conclude that, once again, ordinary people were simply confused about what is in their own interests. For example, in the course of describing presidential candidate Richard Gephardt's proposal to repeal President Bush's tax cuts and spend the money on universal health care, Princeton economist and New York Times columnist Paul Krugman wrote, “If American families knew what was good for them, then most of them—all but a small, affluent minority—would cheerfully give up their tax cuts in return for a guarantee that health care would be there when needed.”66
Other observers, while a bit more circumspect about stipulating what people would do if they knew what was good for them, have still raised significant doubts about the capacity of the American public to reason effectively about tax policy. For example, in the course of reflecting on the Bush era of “‘Let Them Eat Cake’ economics,” Newsweek columnist Jonathan Alter worried that “even if the tax cuts help stimulate a modest recovery, we have dug ourselves a deep hole.” He added that
Explaining all this politically is a “bank shot,” to use a billiards term. It requires trusting the voters with complexity. Will they see that their new $400 child credits are chump change compared with all the new fee hikes and service cuts? Will they understand that they're paying more in state and local taxes so that a guy with a Jaguar putting up a McMansion down the block can pay less in federal taxes? Will they connect those 30 kids cramming their child's classroom to decisions in far-away Washington?67
The answer to these questions suggested by my analysis is: Not likely.
References
Alter, Jonathan.
2003.
“Let them eat cake” economics.
Newsweek, July 28.
Andrews, Edmund L.
2003.
Your taxes: Too many pennies from heaven?
New York Times, February 16.
Bartels, Larry M.
1990.
Public opinion and political interests.
Paper presented at the annual meeting of the Midwest Political
Science Association, Chicago.
Bartels, Larry M.
1996.
Uninformed votes: Information effects in presidential
elections.
American Journal of Political Science
40 (1):
194–230.Google Scholar
Bartels, Larry M.
2004.
Unenlightened self-interest: The strange appeal of estate tax
repeal.
American Prospect, June.
Broder, David.
2003.
The tax-cut skeptics back home.
Washington Post, May 28.
Citizens for Tax Justice.
2002.
Year-by-year analysis of the Bush tax cuts shows growing tilt to the
very rich.
June 12.
http://www.ctj.org/html/gwb0602.htm.
Citizens for Tax Justice.
2003.
Effects of first three Bush tax cuts charted.
June 4.
http://www.ctj.org/pdf/allbushcut.pdf.
Delli Carpini, Michael X., and
Scott Keeter.
1996.
What Americans know about politics and why it matters.
New Haven:
Yale University Press.
Feldman, Stanley.
2003.
A conflicted public? Equality, fairness, and redistribution.
Paper presented at the conference Inequality and American
Democracy, Princeton University, November
7–8.
Firestone, David.
2003.
Tax law omits $400 child credit for millions.
New York Times, May 29.
Fishkin, James S.
1997.
The voice of the people: Public opinion and democracy.
New Haven:
Yale University Press.
Gale, William G.,
Peter Orszag, and
Isaac Shapiro.
2004.
Distributional effects of the 2001 and 2003 tax cuts and their
financing.
Washington, DC:
Tax Policy Center,
June 3.
Gilens, Martin.
2001.
Political ignorance and collective policy preferences.
American Political Science Review
95 (2):
379–96.Google Scholar
Hacker, Jacob S., and
Paul Pierson.
2005.
Abandoning the middle: The Bush tax cuts and the limits of
democratic control.
Perspectives on Politics
3 (1):
33–53.Google Scholar
Heckman, James.
1979.
Sample selection bias as a specification error.
Econometrica
47 (1):
153–61.Google Scholar
Hochschild, Jennifer L.
1981.
What's fair? American beliefs about distributive
justice.
Cambridge:
Harvard University Press.
Joint Committee on Taxation.
2001.
Estimated revenue effects of the president's fiscal year 2002
budget proposal, JCX-31-01,
May 4.
Krugman, Paul.
2002.
For richer: How the permissive capitalism of the boom destroyed
American equality.
New York Times Magazine, October 20.
Krugman, Paul.
2003.
Roads not taken.
New York Times, April 25.
Lowery, David, and
Lee Sigelman.
1981.
Understanding the tax revolt: Eight explanations.
American Political Science Review
75 (4):
963–74.Google Scholar
McCall, Leslie.
2003.
Do they know and do they care? Americans' awareness of rising
inequality.
Presented at the conference on Inequality and American
Democracy, Princeton University, November 7–8.
McClosky, Herbert, and
John Zaller.
1984.
The American ethos: Public attitudes toward capitalism and
democracy.
Cambridge:
Harvard University Press.
Mishel, Lawrence,
Jared Bernstein, and
Heather Boushey.
2003.
The state of working America 2002/2003.
Ithaca, NY:
Cornell University Press.
National Election Studies.
2002.
The 2002 national election study [dataset].
Ann Arbor, MI:
University of Michigan, Center for Political Studies.
www.umich.edu/∼nes.
National Public Radio/Kaiser Family Foundation/Kennedy
School of Government.
2003.
National survey of Americans' views on taxes.
April.
http://www.kff.org/kaiserpolls/3340-index.cfm.
Osberg, Lars, and
Timothy Smeeding.
2003.
An international comparison of preferences for leveling.
Unpublished manuscript,
Dalhousie University and Syracuse University;
version 2.1.
Peterson, Peter G.
2003.
Deficits and dysfunction.
New York Times Magazine, June 8.
Pew Research Center for the People, and the Press.
2003.
Democrats frustrated with party even as candidates gain visibility:
Bush approval slips—Fix economy, say voters.
Survey Report. August 7.
http://people-press.org/reports/pdf/190.pdf.
Rosenbaum, David E., and
David Firestone.
2003.
$318 billion deal is set in Congress for cutting taxes.
New York Times, May 22.
Samuelson, Robert J.
2001.
Indifferent to inequality?
Newsweek, May 7.
Schattschneider, E. E.
1942.
Party government.
New York:
Holt, Rinehart and Winston.
Sloan, Allan.
2003.
The tax cut: Whose is bigger?
Newsweek, May 5.
Springer, John.
2003.
Administration tax cut proposals would cost $2.7 trillion through
2013.
Center on Budget and Policy Priorities.
March 10, 2003.
http://www.cbpp.org/1-24-03tax-fact.htm.
Verba, Sidney, and
Gary R. Orren.
1985.
Equality in America: The view from the top.
Cambridge:
Harvard University Press.
Will, George F.
2003.
The long and short of the “stimulus package.”
Washington Post, January 8.
Zaller, John.
1985.
Pre-testing information items on the 1986 NES pilot survey.
Report to the National Election Study Board of Overseers.
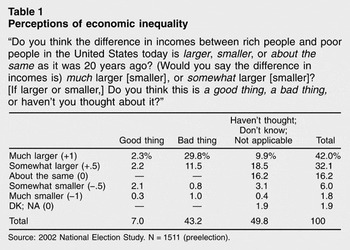
Table 1: Perceptions of economic inequality
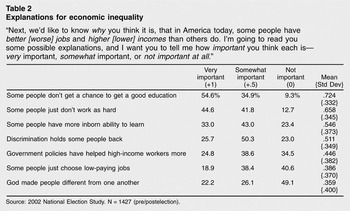
Table 2: Explanations for economic inequality
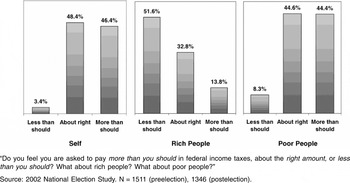
Figure 1: Perceived tax burdens
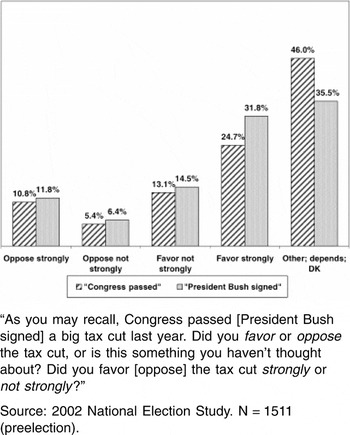
Figure 2: Public support for a big tax cut
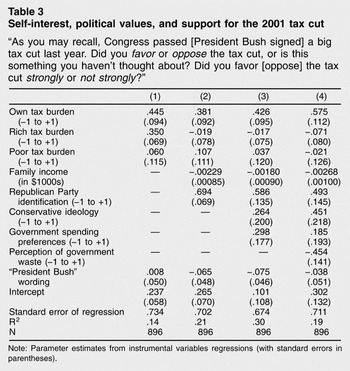
Table 3: Self-interest, political values, and support for the 2001 tax cut
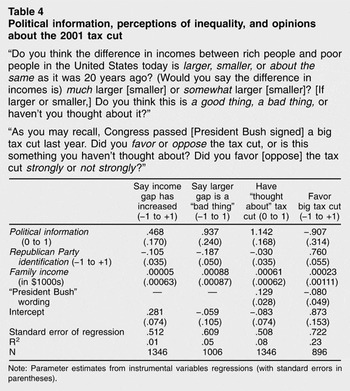
Table 4: Political information, perceptions of inequality, and opinions about the 2001 tax cut
 You have
Access
- 353
- Cited by