Introduction
Motion constitutes one of the most salient cues for both vertebrate and invertebrate visual systems. Indeed, multiple distinct circuits at various levels of the visual system are sensitive to the presence of moving objects. Perhaps, the best understood circuit addressing the extraction of motion is that of the ON–OFF direction selective ganglion cell (DSGC) in the mammalian retina. These DSGCs respond strongly to an image moving in the preferred direction and weakly to an image moving in the opposite, or null, direction (Barlow & Hill, Reference Barlow and Hill1963). They project to several distinct vision centers in the brain (Huberman et al., Reference Huberman, Wei, Elstrott, Stafford, Feller and Barres2009; Kay et al., Reference Kay, De la Huerta, Kim, Zhang, Yamagata, Chu, Meister and Sanes2011; Rivlin-Etzion et al., Reference Rivlin-Etzion, Zhou, Wei, Elstrott, Nguyen, Barres, Huberman and Feller2011) where motion is encoded in postsynaptic targets (Marshel et al., Reference Marshel, Kaye, Nauhaus and Callaway2012; Piscopo et al., Reference Piscopo, El-Danaf, Huberman and Niell2013). Though the cellular and synaptic bases of this computation are reasonably well understood, the wiring up of this circuit during development is mostly a mystery (Borst & Euler, Reference Borst and Euler2011; Wei & Feller, Reference Wei and Feller2011).
The development of direction selective circuits does not require visual experience because direction selectivity was already established at eye opening (Chan & Chiao, Reference Chan and Chiao2008; Elstrott et al., Reference Elstrott, Anishchenko, Greschner, Sher, Litke, Chichilnisky and Feller2008; Chen et al., Reference Chen, Weng, Deng, Xu and He2009; Wei et al., Reference Wei, Hamby, Zhou and Feller2011; Chen et al., Reference Chen, Liu and Tian2014), though several features of DSGCs are immature at these early ages (Chan & Chiao, Reference Chan and Chiao2008, Reference Chan and Chiao2013; Chen et al., Reference Chen, Liu and Tian2014). However, spontaneous activity may play a role. Prior to the onset of vision, the retina is not silent but rather exhibits highly correlated propagating spontaneous activity termed retinal waves (Galli & Maffei, Reference Galli and Maffei1988; Meister et al., Reference Meister, Wong, Baylor and Shatz1991; Wong, Reference Wong1999; Blankenship & Feller, Reference Blankenship and Feller2010). These waves initiate in random locations and propagate from one cell to another, causing neighboring cells, including DSGCs, to fire correlated bursts of action potentials (Elstrott & Feller, Reference Elstrott and Feller2010).
In mice, retinal waves are first detected a few days before birth and persist for approximately two weeks after birth, disappearing around the time of eye-opening (Maccione et al., Reference Maccione, Hennig, Gandolfo, Muthmann, van Coppenhagen, Eglen, Berdondini and Sernagor2014). During this extended developmental period, the retinal circuits undergo significant changes in organization and hence the circuits mediating waves also change. The two most well-studied stages of retinal wave generation are from P1–P10, when waves are mediated by a transient cholinergic circuit (Ford & Feller, Reference Ford and Feller2012) and P11–P14, when waves are mediated by a glutamatergic circuit (Akrouh & Kerschensteiner, Reference Akrouh and Kerschensteiner2013; Maccione et al., Reference Maccione, Hennig, Gandolfo, Muthmann, van Coppenhagen, Eglen, Berdondini and Sernagor2014).
Retinal waves have been implicated in several aspects of visual development. In the retina, they are thought to influence the segregation of retinal ganglion cell (RGC) dendrites into distinct synaptic layers that determine their functional output (Sernagor et al., Reference Sernagor, Eglen and Wong2001; Tian, Reference Tian2008). Outside the retina, they are thought to provide the structured activity critical for refining the initially coarse RGC projections to the thalamus and superior colliculus (for reviews, see Huberman et al., Reference Huberman, Feller and Chapman2008; Kirkby et al., Reference Kirkby, Sack, Firl and Feller2013). Waves also exhibit a bias in their propagation direction, with more waves propagating toward the nasal direction (Stafford et al., Reference Stafford, Sher, Litke and Feldheim2009), an effect enhanced in the second postnatal week (Elstrott & Feller, Reference Elstrott and Feller2010). Hence, the retinal waves provide a robust source of directional information prior to the onset of vision.
Several studies have addressed the role of glutamatergic retinal waves in the development of direction selectivity. These studies are based on intraocular injections of activity blockers and have demonstrated that the direction selective responses are still detected at eye-opening (Sun et al., Reference Sun, Han and He2011; Wei et al., Reference Wei, Hamby, Zhou and Feller2011). However, with intraocular injections, it is difficult to verify that the activity is being blocked during the entire duration of the manipulation. In addition, these injection studies were based on manipulating nonglutamatergic circuits. Finally, these studies were often based on recordings from individual DSGCs and therefore do not represent a broad sampling across the population.
Here, we use a genetic approach to test whether disrupting glutamatergic retinal waves alters the development of direction selectivity with both targeted recording from genetically identified DSGCs and multielectrode array (MEA) recording from a broader population. A critical component of the network mediating waves and a primary source of the depolarizing input to RGCs is glutamate release from bipolar cells (Akrouh & Kerschensteiner, Reference Akrouh and Kerschensteiner2013; Firl et al., Reference Firl, Sack, Newman, Tani and Feller2013). In the adult retina, bipolar cells exhibit unstable membrane potentials and their spontaneous depolarizations are mediated by low-voltage activated T-type calcium channels (Ma & Pan, Reference Ma and Pan2003; Cueni et al., Reference Cueni, Canepari, Adelman and Lüthi2009; Puthussery et al., Reference Puthussery, Percival, Venkataramani, Gayet-Primo, Grünert and Taylor2014; Sargoy et al., Reference Sargoy, Sun, Barnes and Brecha2014) that are expressed in the subsets of bipolar cells (Pan et al., Reference Pan, Hu, Perring and Andrade2001; Singer & Diamond, Reference Singer and Diamond2003) and of ganglion cells (Sargoy et al., Reference Sargoy, Sun, Barnes and Brecha2014). The isoform α1H (CaV3.2) of the T-type Ca2+ channel (Cueni et al., Reference Cueni, Canepari, Adelman and Lüthi2009) localizes to cone bipolar cells. Here, we studied retinal waves and direction selectivity of mice where CaV3.2 is deleted (Chen et al., Reference Chen, Lamping, Nuno, Barresi, Prouty, Lavoie, Cribbs, England, Sigmund, Weiss, Williamson, Hill and Campbell2003; Ma & Pan, Reference Ma and Pan2003). We compared the spontaneous activity patterns during development and the direction selective responses in the adult of CaV3.2 knockout (KO) mice to those of their littermate controls.
Materials and methods
Mice
CaV3.2−/− mice (Chen et al., Reference Chen, Lamping, Nuno, Barresi, Prouty, Lavoie, Cribbs, England, Sigmund, Weiss, Williamson, Hill and Campbell2003) were obtained from the Mutant Mouse Regional Resource Center (MMRRC line #9979) and crossed to C57BL/6 in our laboratory. P11–19 CaV3.2 KO mice and littermate controls were maintained on a C57bl/6 background, housed under constant day/night cycles, and provided food and water ad libitum. All animal procedures were approved by the University of California (UC) Berkeley Institutional Animal Care and Use Committees and conformed to the NIH Guide for the Care and Use of Laboratory Animals, the Public Health Service Policy, and the SFN Policy on the Use of Animals in Neuroscience Research. Littermates (CaV3.2+/+ mice) were used as control mice. CaV3.2+/− mice were not included in this study.
Multielectrode array recordings of spontaneous activity
Retinas were removed from CaV3.2 KO mice or CaV3.2+/+ littermates (referred to as control throughout the manuscript) at P11–12 in room light and perfused with oxygenated and pH buffered artificial cerebral spinal fluid (ACSF) and placed ganglion cell side down on a commercial 61 electrode array. Approximately, 1 h recordings of spontaneous activity were made and analyzed as described below.
Multielectrode array recordings of visual responses
Retinas were removed from CaV3.2 KO and CaV3.2+/+ mice P16-P19 in the dark under infrared illumination and placed ganglion cell side down on a commercial 61 electrode array. The presence or absence of direction selective responses was then characterized by stimulating the retina with square pulse drifting gratings presented on a small display placed in the camera port of the microscope. The photoreceptor layer of the isolated piece of retina will be stimulated from above with an optically reduced image of a OLED monitor focused with a microscope objective, centered on the array, and refreshing at 120 Hz (gray screen intensity = 1623 equivalent photons/μm2/s at 491 nm). For most experiments, the retina was stimulated with five repetitions of full-field square wave gratings moving in one of 12 randomly interleaved directions, with each presentation lasting 10 s, followed by 3 s of gray screen (800 μm/period, 1.066 s/period, velocity = 25 deg/s for the adult mouse). In some recordings, full-field sinusoidal gratings may be used (400 μm/period, 0.533 s/period, velocity = 25 deg/s for the adult mouse).
Spike-sorting
The voltage trace recorded on each electrode was sampled at 20 kHz and stored for offline analysis. Spikes that cross threshold were sorted according to the principal components of their voltage waveforms on neighboring electrodes. Spikes were first projected into the first five principal component dimensions where an expectation maximization algorithm was used to group spikes into a mixture of Gaussians' model. All spike clusters will be inspected manually in a principal component space. The overall direction selective response was characterized in each direction by computing the vector sum of these responses for each cell.
A direction selective index was then calculated for each cell, given by the following formula: D.S.I. = (pref − null)/(pref + null) where pref is the average response in the preferred direction, defined as the stimulus direction closest to the vector sum of all responses, and null is the average response in the stimulus direction 180 deg opposite pref. For a given cell, the width of the tuning curve, which is a measure of the strength of directional tuning and defines the preferred and null axis for each DSGC, is computed by fitting the response curve to a von Mises distribution, given by the following: R = R maxe kcos(x − µ) = e k, where R is the response to motion in a given stimulus direction x in radians, R max is the maximum response, µ is the preferred direction in radians, and k is the concentration parameter accounting for tuning width. The tuning width of each cell will be estimated as the full width at half height (fwhh) of the von Mises fit using the following equation: fwhh = 2(θ − µ), where θ = acos[ln(½e k + ½e −k)/k] + µ. Calculation of these values allows us to investigate the degree of tuning in nascent DSGCs that have experienced altered activity. The mean firing rates in the preferred and null directions were computed as previously described (Elstrott et al., Reference Elstrott, Anishchenko, Greschner, Sher, Litke, Chichilnisky and Feller2008). We did not keep track of the orientation of the retinas and therefore the distribution of the preferred directions in visual coordinates was not determined.
Data from images: Eye-specific segregation analysis
Animals were anesthetized with 3.5% isoflurane/2% O2. The eyelid was then opened with fine forceps to expose the eye, and 0.1–1 μl of Alexa-488 or Alexa-594 conjugated-cholera toxin was injected using a fine glass micropipette with a picospritzer (World Precision Instruments, Sarasota, FL) generating 20 psi, 3 ms long positive pressure. The cholera toxin was then allowed to transport for 24 h, which was sufficient time for a clear labeling of axons and terminals. Brains were removed, immersion fixed in 4% paraformaldehyde (24 h), cryo-protected in 30% sucrose (18 h), and sectioned coronally (100 µm) on a vibratome.
Images were analyzed as described previously (Torborg & Feller, Reference Torborg and Feller2004). Eight-bit tagged image file format images were acquired for Alexa488- or 594-labeled sections of the lateral geniculate nucleus (LGN) with a CCD camera (Optronics, Goleta, CA) attached to an upright microscope (Zeiss Axioscope 2; Thornwood, NY) with a 10x objective (numerical aperture, 0.45). The three sections that contained the largest ipsilateral projection, corresponding to the central third of the LGN, were selected. Background fluorescence was subtracted using a rolling ball filter (ImageJ) and the grayscale was renormalized so that the range of grayscale values was from 0 to 256. IgorPro Software (Wavemetrics, Lake Oswego, OR) was used to perform a segregation analysis. For each pixel, we computed the logarithm of the intensity ratio, R = log10(F I/F C), where F I is the ipsilateral channel fluorescence intensity and F C is the contralateral channel fluorescence intensity. We then calculated the variance of the distribution of the R-values for each section, which was used to compare the width of the distributions across animals. A higher variance is indicative of a wider distribution of the R-values, which is in turn indicative of more contra- and ipsi-dominant pixels, and therefore more segregation.
Two-photon targeted recordings from GFP+ RGCs and intracellular fillings
Filter paper-mounted retinas were placed under the microscope in oxygenated Ames' medium at 32–34 °C. Identification of and recording from GFP+ cells were described in Wei et al. (Reference Wei, Elstrott and Feller2010). In short, GFP+ cells were identified using a custom-modified two-photon microscope (Fluoview 300, Olympus America Inc.) tuned to 920 nm to minimize the bleaching of the photoreceptors. The average laser power at the sample was 10 mW. The inner limiting membrane above the targeted cell was dissected with the glass electrode, and loose-patch voltage-clamp recordings (holding voltage set to “OFF”) were performed with a new glass electrode (3–5 MΩ) filled with Ames' medium. Data were acquired through an Axopatch 200B (Molecular Devices) and digitized at a sampling rate of 20 kHz.
GFP+ RGCs were first stimulated with five repetitions of a 200 μm white spot for 2 s to test on and off responses. To test a directional response, we presented three repetitions of drifting square-waves gratings (spatial frequency = 225 mm/cycle, temporal frequency four cycles/s, 30°/s in eight pseudorandomly chosen directions spaced at 45° intervals, with each presentation lasting 3 s followed by 500 ms of gray screen). The directionality of the GFP+ cells was further analyzed as described above.
The dendritic morphology of GFP+ cells was determined by including 0.05 μM Alexa Fluor 488 (Invitrogen) in the intracellular solution following cell-attached recordings of the spike responses. The dendritic morphology of dye-injected GFP+ RGCs was reconstructed by a two-photon imaging with the laser tuned to 800 nm. Images were acquired at z intervals of 0.5 μm using a 60× objective (Olympus LUMPlanFl/IR 360/0.90W). GFP+ RGC processes were later reconstructed from image stacks with ImageJ.
Results
CaV3.2 KO mice display altered retinal waves
The T-type channels differ from most other members of the voltage-gated calcium channel (VGCC) family in that they activate at more hyperpolarized membrane potentials and they rapidly inactivate, giving rise to a transient current which contribute to pacemaking and bursting properties of several classes of neurons (Cueni et al., Reference Cueni, Canepari, Adelman and Lüthi2009; Cain & Snutch, Reference Cain and Snutch2013). There are three identified types of T-type channels, which are categorized both molecularly by their alpha subunit isoform (CaV3.1-3) and physiologically (Perez-Reyes, Reference Perez-Reyes2003). Recently, it was determined that the CaV3.2 subtype of T-type current is expressed in the axon terminals of cone bipolar cells (Cui et al., Reference Cui, Ivanova, Qi and Pan2012) and therefore we looked at glutamatergic waves in mice lacking the CaV3.2 subunit.
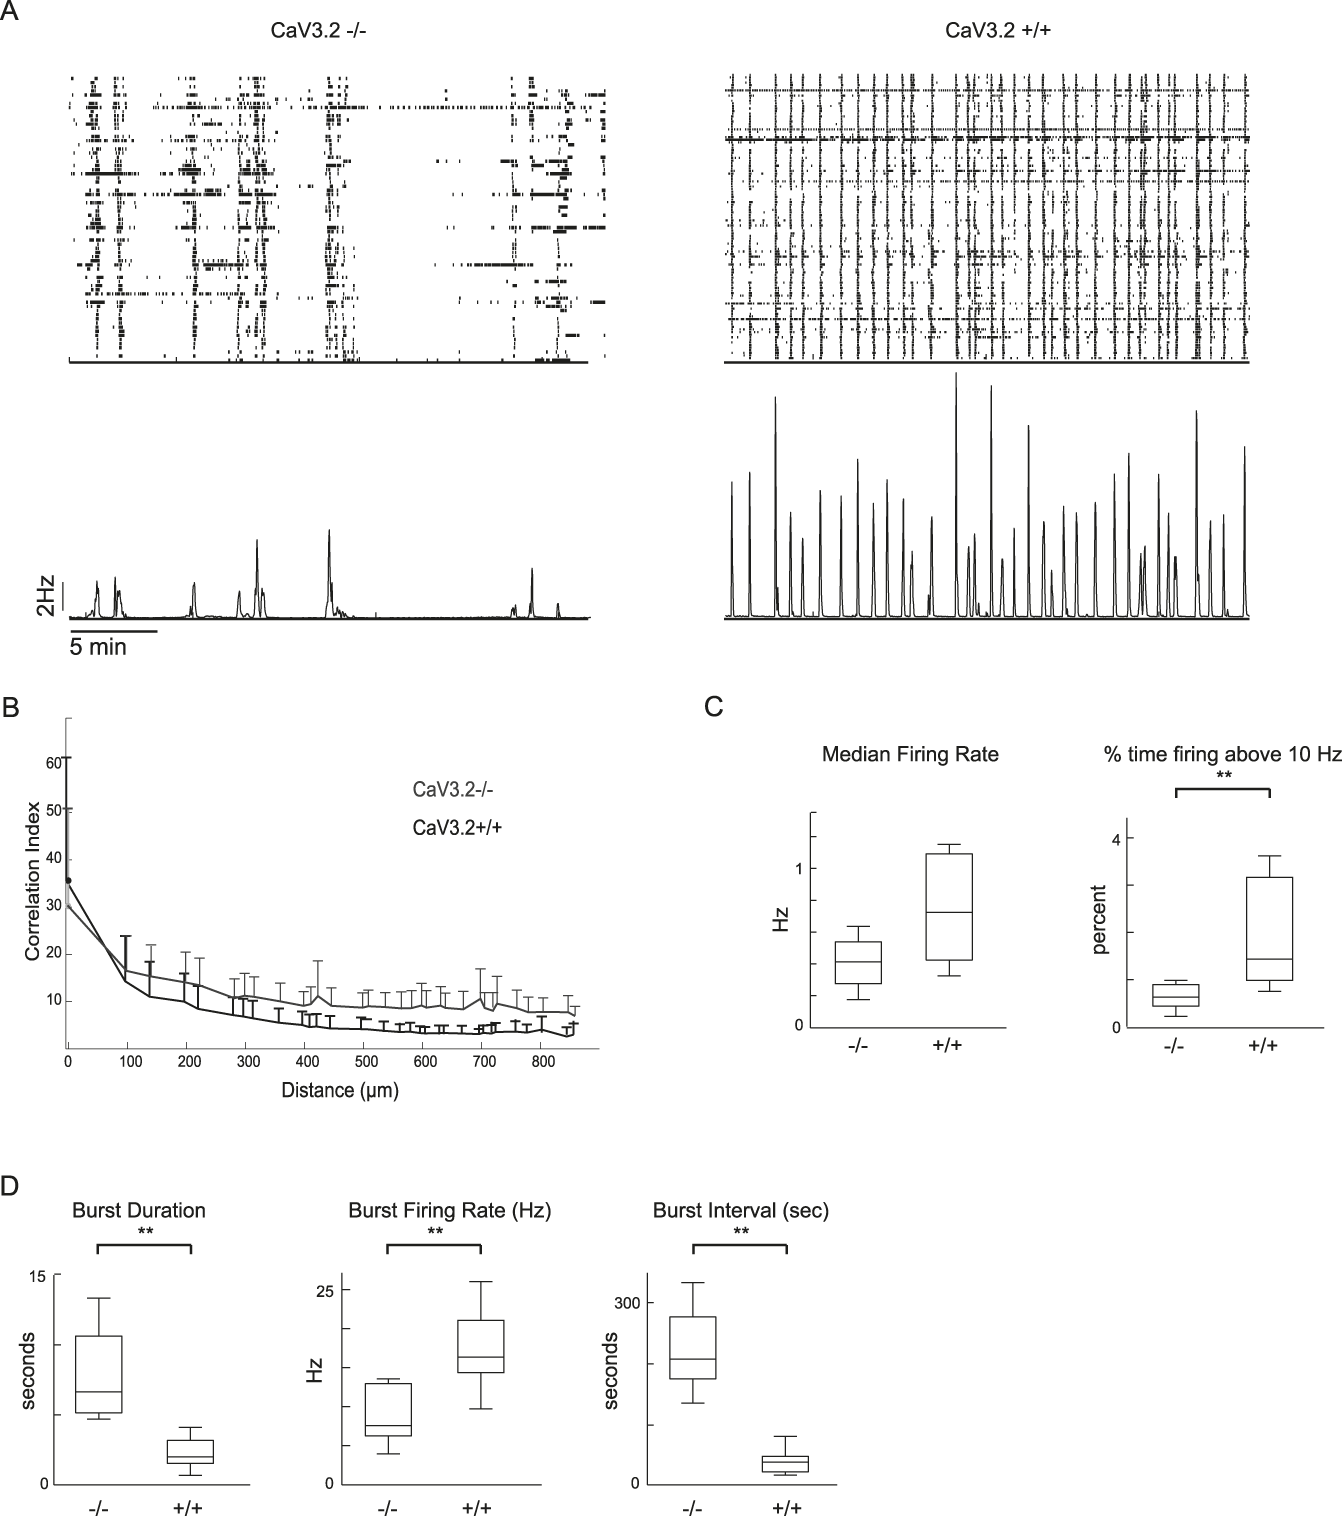
To characterize the firing patterns of CaV3.2 KO (KO) retinas, we used a MEA to record extracellularly from many RGCs simultaneously. From postnatal day 1 (P1) to P10, these waves are mediated by a cholinergic circuit, and from P11 to eye opening, they are mediated by a glutamatergic circuit. In this study, we focused on the glutamatergic circuit since this represents the period when direction selective circuits are established (Wei et al., Reference Wei, Hamby, Zhou and Feller2011). We compared the glutamatergic waves by recording from KO mice and their CaV3.2+/+ littermate controls at ages P11–12 (n = 11 KO and 10 control). In control mice, these waves consist of periodic correlated bursts of action potentials separated by interwave intervals with very few action potentials, similar to the firing patterns described previously for wild-type mice (Xu et al., Reference Xu, Chen, Ding, Xie, Chen, Diao, Wang, Gan, Crair and Tian2010; Blankenship et al., Reference Blankenship, Hamby, Firl, Vyas, Maxeiner, Willecke and Feller2011). In KO mice, these waves also display correlated bursts of action potentials, but these bursts last for longer durations and are separated from each other by longer interwave intervals that are completely quiescent (Fig. 1A).
Temporal pattern of spontaneous retinal waves is altered in CaV3.2 KO mice. (A) Top, Raster plot of single-unit spike trains from retinal ganglion cells recorded over a 60-minute period from P11 CaV3.2 KO (left) and CaV3.2+/+ (right) retina. Bottom, average firing rate of all units. (B) Pairwise correlation index as a function of intercellular distance for CaV3.2 KO (gray) and CaV3.2+/+ (black) retinas (averaged across all retinas per genotype). The data points correspond to the mean values of medians from individual datasets and the error bars represent s.e.m. The bottom error bars have been omitted for clarity. (C/D) Summary of the temporal properties of spontaneous firing patterns for CaV3.2 KO and CaV3.2+/+ retinas. We compute properties for all action potentials (C) and separately for bursts (D). Data are averaged over mean values for each cell of a given genotype.

To compare these firing patterns, we quantified several features. First, we computed the correlation index as a function of distance between the cells. Nearest-neighbor correlations are higher for nearby cells than for distant cells, confirming that the firing is due to propagating waves. These correlations are indistinguishable between KO and control retinas (Fig. 1B), indicating that the spatial correlations induced by waves in KO mice are similar to those in control mice. Second, we examined temporal features of the overall firing pattern. We found that the median firing rates (Fig. 1C) were not statistically different (median, Mdn of 0.44 Hz; interquartile range, IQR = 0.27–0.54 in KO vs. Mdn of 0.72 Hz; 0.44–1.09 in control P = 0.074), indicating that they exhibit similar levels of firing overall. In contrast, the time spent firing above 10 Hz (PC10), a feature reported to be critical for driving eye-specific segregation of retinogeniculate projections (Torborg et al., Reference Torborg, Hansen and Feller2005), is significantly reduced in KO (Mdn of 0.62%; 0.43–0.90 in KO vs. Mdn of 1.43%; 1.01–3.19 in control P = 0.002). Third, we characterized the features of the bursts where we observed pronounced differences between KO and control mice (Fig. 1D). KO retinas display significantly longer burst durations (Mdn of 5.8 s; 5.11–10.53 in KO vs. Mdn of 2.02 s; 1.49–3.19 in control P = 0.000502) and interburst intervals (Mdn of 202.27 s; 170.46–270.45 in KO vs. Mdn of 40.91 s; 24.64–50.00 in control P = 0.0000823) than control mice. However, within the bursts, the KO firing rate is significantly lower (Mdn of 7.33 Hz; 6.04–12.83 in KO vs. Mdn of 16.34 Hz; 14.33–21.17 in control P = 0.000576). Thus, mice lacking the CaV3.2 isoform of the T-type Ca2+ channel exhibit propagating bursts of action potentials during glutamatergic waves, but the periodicity and the properties of these spontaneous bursts are significantly altered from that of control mice.
CaV3.2 KO mice exhibit reduced eye-specific segregation of retinogeniculate projections
Retinal waves drive the segregation of ipsi- and contra-lateral retinal projections into their respective anatomical layers in the dorsal lateral geniculate nucleus (dLGN) (Chan & Chiao, Reference Chan and Chiao2008; Elstrott et al., Reference Elstrott, Anishchenko, Greschner, Sher, Litke, Chichilnisky and Feller2008; Guido, Reference Guido2008; Huberman et al., Reference Huberman, Feller and Chapman2008; Chen et al., Reference Chen, Weng, Deng, Xu and He2009; Wei et al., Reference Wei, Hamby, Zhou and Feller2011; Kirkby et al., Reference Kirkby, Sack, Firl and Feller2013). This eye-specific segregation is disrupted when correlated firing is reduced. Therefore, we investigated whether this segregation is impacted by the prolonged, lower frequency bursts during waves in CaV3.2 KO retina.
We labeled retinogeniculate projections in KO mice and their CaV3.2+/+ littermate controls at P16 by injecting anterograde tracer cholera-toxin B into both eyes (Alexa dye conjugate, 488 left eye, 568 right eye, Fig. 2). We then compared the segregation of ipsilateral-projecting and contralateral-projecting inputs for both hemispheres of the dLGN by calculating unbiased segregation indices that quantified the degree of eye-specific segregation in the two mouse groups. Both CaV3.2 KO and controls had well-defined ipsilateral eye termination zones but the control mice showed sharper segregation (Fig. 2A). We quantified the degree of segregation as the variance of the distribution of the R-values for all pixels (R = log10 (F I/F C)) with better segregated dLGNs having a wider distribution (higher variance) of the R-values than poorly segregated ones (Fig. 2B). We found that the degree of segregation for the KO group is significantly lower than that for the control littermates (mean ± SD of 0.3517 ± 0.0475 in KO vs. 0.4603 ± 0.0172 in control n = 4 KO and control P = 0.0051). Thus, the altered burst properties of CaV3.2 KO mice impact their eye-specific segregation. This highlights the important role that the bursting properties of retinal waves play in the driving activity-dependent developmental refinement of retinogeniculate projections (Sernagor et al., Reference Sernagor, Eglen and Wong2001; Butts, Reference Butts2002; Tian, Reference Tian2008; Blankenship & Feller, Reference Blankenship and Feller2010; Elstrott & Feller, Reference Elstrott and Feller2010; Xu et al., Reference Xu, Furman, Mineur, Chen, King, Zenisek, Zhou, Butts, Tian, Picciotto and Crair2011).
CaV3.2 KO mice have reduced eye-specific segregation. (A) Fluorescence images of dLGN sections in CaV3.2 KO (top) and CaV3.2+/+ (bottom) mice. Left, fluorescence of Alexa 488-labeled, contralateral-projecting retinogeniculate axons; middle, fluorescence of Alexa 594-labeled, ipsilateral-projecting retinogeniculate axons; and right, pseudocolor images based on the logarithm of the intensity ratio (R = log(F I/F C)) for each pixel. Scale bar, 200 µm. (B) Summary of the variance of the distribution of the R-values for all the pixels in the images of each brain. The broader the distribution of the R-values for a given dLGN, the greater the extent of segregation.

These data indicate that (1) CaV3.2 KO mice have altered glutamatergic waves and (2) this disrupted activity pattern altered activity-dependent eye-specific refinement of retinogeniculate axons. Therefore, the CaV3.2 KO mouse offers a robust model to test the contribution of various wave properties to the development of retinal direction selectivity.
ON–OFF DSGCs exhibit similar response properties in CaV3.2 KO and control mice
We analyzed the direction selectivity in CaV3.2 KO mice using two approaches. First, using MEA recordings, we compared the direction selective responses of DSGCs in P16–19 CaV3.2 KO and control mice. We recorded the responses of cell populations evoked by drifting gratings, and we quantified the direction selective index (DSI) of all isolated units (n = 1118 controls and 1012 KO, Fig. 3A). To selectively record from ON–OFF DSGCs, we used gratings moving at a velocity of 25 deg/s. This is above the maximum velocity for ON-DSGCs but within the tuning range for ON–OFF DSGCs (Sivyer et al., Reference Sivyer, van Wyk, Vaney and Taylor2010). All DSGCs were confirmed to have both on and off responses (Fig. 3A, inset). Using units that have a DSI greater than 0.4 to designate them as “direction selective”, we estimate that 11% of all recorded units in CaV3.2+/+ are DS (118/1012) and 13% of CaV3.2 KO (146/1118), similar to that described recently (Chen et al., Reference Chen, Liu and Tian2014). These DS units were used subsequently to calculate tuning widths and firing rates. It is important to note that using MEA to calculate percentages does not necessarily accurately reflect the true representation of different cell types since the MEA itself may be selective for different subtypes of RGCs.
CaV3.2 KO mice have distribution of directional responses that are indistinguishable from control. (A) Polar plot of mean spike rate response to motion in 12 directions across five repetitions from CaV3.2 KO and CaV3.2+/+ retinas. The tuning curve was obtained using the mean firing rate in response to each direction. The arrow indicates mean preferred direction of the example cell. (B) Summary of the distribution for DSI from all CaV3.2 KO and CaV3.2+/+ units. (C) Summary of the distribution for maximum firing rate in the preferred direction. (D) Summary of the distribution of tuning widths as based on fitting tuning curves to a von Mises distribution (see Materials and methods).
We compared the DSIs, firing rates, and tuning widths of ON–OFF DSGCs and found no statistically significant difference between the KO and control populations (Figs. 3B–3D). The DSI distributions of the two groups were almost identical. Both peaked near 0.0 (no tuning) and frequencies decreased uniformly as tuning approached 1.0 (perfect tuning). Notably, many ON–OFF DSGCs in both the CaV3.2 KO retina and controls had high DSIs, indicating strong tuning (DSI > 0.8). Along with similar DSI distributions, KO and control cells showed no difference in their firing rates neither for the preferred direction nor their tuning widths. Taken together, these data indicate that the altered bursting properties observed in CaV3.2 KO retinas do not affect the development of direction selectivity in ON–OFF DSGCs.
Our second approach was to use targeted cell-attached recordings from DSGCs expressing GFP in ON–OFF DSGCs. We crossed CaV3.2 KO mice with a line (TRHR-GFP) that selectively labels posterior preferring ON–OFF DSGCs (Huberman et al., Reference Huberman, Feller and Chapman2008; Rivlin-Etzion et al., Reference Rivlin-Etzion, Zhou, Wei, Elstrott, Nguyen, Barres, Huberman and Feller2011), thus allowing for unambiguous targeting of a known DSGC subtype (Fig. 4). To avoid the bleaching of the photoreceptors, we identified and targeted this DSGC using two-photon targeted recordings and IR illumination (Wei et al., Reference Wei, Elstrott and Feller2010). The overall stratification pattern of ON–OFF DSGCs was unaltered in CaV3.2 KO mice as shown by the dendritic reconstructions of filled GFP+ cells (Fig. 4A). To assay the degree of directional tuning, we used cell-attached recordings to determine the action potential generated in response to drifting gratings (Fig. 4B). Most cells recorded from KO animals (n = 7/10) display sharp directional tuning (DSI > 0.4) and a clear ON/OFF response to flashing spots (data not shown) with no significant difference in the average DSI (Fig. 4C). These data confirm that for an identified subtype of ON–OFF DSGCs, the emergence of mature direction selective responses is not affected by the changes in spontaneous activity in CaV3.2 KO mice.
Targeted cell-attached recordings from identified ON–OFF DSGCs have similar tuning in CaV3.2 KO and CaV3.2+/+ mice. (A) Maximal intensity projections of z-stack images of two ON–OFF DSGCs (filled with Alexa Fluor 488) and side views of the complete dendritic arborizations showing dendritic arbors in the on and off sublaminae from CaV3.2−/− and CaV3.2+/+ mouse. (B) Targeted two-photon recordings of light responses from GFP+ cells in transgenic mice in which GFP is expressed in subtype of DSGCs. Polar plots of mean spike rate response to motion in eight directions across three repetitions from CaV3.2−/− (top) and CaV3.2+/+ (bottom) retinas. The tuning curve was obtained using the mean firing rate in response to each direction. The radius scale is the normalization of the spike-count in each direction. The maximum response is the spike-count in the preferred direction, and it is written in the top right corner of the polar plots. The arrow indicates mean preferred direction of the example cell. (C) Summary data comparing DSIs in CaV3.2+/+ and CaV3.2−/−.
Discussion
We have identified a genetic model for studying the effects of altered waves on the development of retinal circuits. CaV3.2 KO retinas display normal spatial correlations during waves but their cells exhibited altered bursting properties with longer interburst intervals, prolonged burst durations, and lower burst firing rates. These changes disrupted eye-specific segregation of the retinogeniculate afferents. However, in both transgenically labeled posterior preferring ON–OFF DSGCs and whole retinal populations, these changes did not detectably affect the direction selective responses. Therefore, the precise pattern of high-frequency burst activity provided by glutamatergic retinal waves does not seem to play a role in the development of retinal direction selectivity.
The idea that retinal waves are involved in the development of direction selectivity is supported by three compelling observations. First, several cell types in the circuit that mediates retinal waves—including bipolar cells, starburst amacrine cells, and DSGCs—are depolarized during these waves (Zhou, Reference Zhou1998; Elstrott & Feller, Reference Elstrott and Feller2010; Ford et al., Reference Ford, Félix and Feller2012; Akrouh & Kerschensteiner, Reference Akrouh and Kerschensteiner2013; Firl et al., Reference Firl, Sack, Newman, Tani and Feller2013). Thus, they are robustly activated by spontaneous activity. Hence, these waves could act potentially as a proxy for moving visual stimuli that activate directional circuits. Second, the retinal waves exhibit a noticeable bias in their direction of wave propagation, with more waves traveling along the nasal axis than along the other three cardinal axes (Stafford et al., Reference Stafford, Sher, Litke and Feldheim2009; Elstrott & Feller, Reference Elstrott and Feller2010). Hence, the firing patterns induced by these waves contain information about the cardinal coordinates of the retina by encoding the nasal direction. Third, blocking synaptic release from bipolar cells during the second postnatal week reduces the rate of synapse formation leading to weaker connections between bipolar and ganglion cells (Ma & Pan, Reference Ma and Pan2003; Kerschensteiner et al., Reference Kerschensteiner, Morgan, Parker, Lewis and Wong2009). Hence, the retinal waves may provide a source of depolarization that is necessary for preserving the appropriate synapses and/or for pruning the inappropriate synapses in order to properly wire up directional circuits.
That direction selectivity develops independent of retinal waves also has support. First, though DSGCs are depolarized by the nasally biased retinal waves, their spiking is not influenced by this bias. In other words, nasal-preferring DSGCs fire the same number of action potentials regardless of the wave's direction of motion (Elstrott & Feller, Reference Elstrott and Feller2010), indicating that waves do not evoke the same responses in DSGCs that moving visual stimuli do. Second, pharmacological manipulations during the second postnatal week do not prevent the detection of DSGCs. For example, intraocular injections of muscimol, a GABA-A receptor agonist that silences neuronal firing (Wei et al., Reference Wei, Hamby, Zhou and Feller2011), do not prevent the development of the directional selective responses. Similarly, intraocular injections of GABA-A receptor antagonists (Sun et al., Reference Sun, Han and He2011; Wei et al., Reference Wei, Hamby, Zhou and Feller2011) blocking the inhibitory circuits mediating direction selectivity, and tetrodotoxin (TTX) (Sun et al., Reference Sun, Han and He2011) preventing DSGC spiking activity also do not prevent the development of direction selectivity. However, as noted earlier, in vivo assessments of the effect of intraocular injections are difficult, though in one study, the vitreous humor from retinas that had received repeated pharmacological injections for TTX and nicotinic acetylcholine receptor antagonists blocked retinal waves in vitro (Sun et al., Reference Sun, Han and He2011). It is important to note that excluding a role for postsynaptic spiking with TTX does not rule out a role for patterned presynaptic synaptic activity to play a role in activity-dependent plasticity as observed in visual cortex (e.g., Frenkel & Bear, Reference Frenkel and Bear2004; Turrigiano & Nelson, Reference Turrigiano and Nelson2004). Third, DSGCs have been detected as early as P11 in mouse retina (Chen et al., Reference Chen, Weng, Deng, Xu and He2009; Yonehara et al., Reference Yonehara, Balint, Noda, Nagel, Bamberg and Roska2011) indicating that the circuits are established prior to glutamatergic retinal waves. As noted by these studies (Fig. 3) and others (Chan & Chiao, Reference Chan and Chiao2008; Elstrott & Feller, Reference Elstrott and Feller2010; Rivlin-Etzion et al., Reference Rivlin-Etzion, Zhou, Wei, Elstrott, Nguyen, Barres, Huberman and Feller2011; Chen et al., Reference Chen, Liu and Tian2014), the distribution of DSIs is very broad across the population. Hence, finding the examples of DSGCs at P11 does not mean all subtypes of DSGCs and even all preferred directions have developed normally.
We approached the role of retinal waves in the development of direction selectivity in a different way. We sought to identify and investigate genetic models in which waves are selectively altered or diminished without affecting the direction-selective circuit itself. This is particularly challenging for glutamate-receptor mediated waves because the manipulation needs to affect the wave-generating mechanism but not the light response, and both of these mechanisms rely upon the activation of ionotropic glutamate receptors (Blankenship & Feller, Reference Blankenship and Feller2010). One such model was recently described (Xu et al., Reference Xu, Furman, Mineur, Chen, King, Zenisek, Zhou, Butts, Tian, Picciotto and Crair2011), but the effect on DSGCs has yet to be explored.
We found that in CaV3.2 KO mice, the pattern of glutamatergic waves was significantly altered, in that they occurred much less frequently and that the bursts associated with waves were longer in duration with a lower firing rate. Glutamatergic waves are mediated by glutamate release from bipolar cells (Akrouh & Kerschensteiner, Reference Akrouh and Kerschensteiner2013; Firl et al., Reference Firl, Sack, Newman, Tani and Feller2013), however, which aspects of the circuit control burst properties and the frequency of waves are not yet identified. In the retina, the T-type channels have been described in bipolar cell terminals and RGCs (Pan et al., Reference Pan, Hu, Perring and Andrade2001; Lee et al., Reference Lee, Hayashida and Ishida2003; Ma & Pan, Reference Ma and Pan2003; Hu et al., Reference Hu, Bi and Pan2009; Cui et al., Reference Cui, Ivanova, Qi and Pan2012; Sargoy et al., Reference Sargoy, Sun, Barnes and Brecha2014). Hence, future experiments will be necessary to determine whether these changes are due to changes in the pacemaking or release properties from bipolar cells or in the excitability of RGCs.
While it does not appear that the spontaneous activity plays a role in the development of direction selectivity in the retina, there may still be a more general role for visually evoked activity in the maturation of the distinct cardinal grouping of DSGC subtypes in the mature retina. A recent study demonstrated that at eye-opening in both rabbit and mouse, the distribution of preferred directions was uniformly distributed, rather than showing segregation along the four cardinal axes, indicating that a process of refinement in the preferred direction occurs after eye-opening (Chan & Chiao, Reference Chan and Chiao2013). They also found a slight degree of anisotropy in the distribution of preferred directions in dark reared animals. In addition, an improvement of DSGC tuning was observed after eye-opening (Chen et al., Reference Chen, Liu and Tian2014). Together, these findings suggest that the process of establishing strong null-side inhibition that underlies direction selectivity may differ from the mechanism that ultimately determines functional preferred direction in DSGCs and that activity may play a role in the latter.
In summary, this study demonstrates that the CaV3.2 subunit of the T-type Ca2+ channel is important for shaping bursting activity that occurs during retinal waves. Although the circuit that underlies direction selectivity coincidently undergoes a period of critical synaptic maturation during this time, introducing a persistent and dramatic alteration in the activity present during the second postnatal week did not affect the development of the robust directional responses after eye-opening. These results and others indicate that the final stages of development in the direction selective circuit in the retina do not require spontaneous activity.
Acknowledgments
This work was supported by NIH Grants R01EY019498, R01EY013528, and P30EY003176 (MBF) and NIH Grant 5F31NS071784 (AMH). We thank Dr. Lowry Kirkby and Dr. Alana Firl for help with analysis of MEA recordings.