Introduction
Phytoplankton play an important role as primary producers in the food chain and primary production is one of their most important ecological features in the aquatic ecosystems. Phytoplankton are an efficient indicator of physicochemical changes due to their sensitivity to the certain environmental stressors. Therefore, they contribute to the evaluation of the eutrophication degree in the aquatic ecosystems (Paerl et al., Reference Paerl, Valdes-Weaver, Joyner and Winkelmann2007). Estuaries are transition zones between freshwater and marine environments, and they are known as highly productive ecosystems (Cloern, Reference Cloern1987).
The Golden Horn Estuary (GHE) is a ria-type (drowned river valley) estuary (Irvali and Cagatay, Reference Irvali and Cagatay2008). As a result of unplanned urbanization and industrialization, the GHE has been polluted since the 1950s. By the early 1990s, estuarine life was limited to the lower and middle part of the estuary due to anoxia and heavy sedimentation. The rehabilitation of the GHE was initiated in 1997, in order to decrease dense pollution and improve water quality and it lasted until 2000. Important studies were done within the scope of this rehabilitation project. These great efforts resulted in rapid renewal and oxygenation of anoxic sediment and highly polluted waters (Okus et al., Reference Okus, Aslan, Tas, Yılmaz and Polat2001; Tas et al., Reference Tas, Yilmaz and Okus2009). Water quality, in particular at the upper part of estuary, started to deteriorate rapidly by 2006 and the depth in the upper section decreased to 2 m due to heavy sedimentation caused by the two streams. Therefore, a new project was conducted by the Municipality of Istanbul in October 2012 to decrease pollution and increase biodiversity (Tas, Reference Tas2020). Highly oxygenated Black Sea water was transferred to the GHE via Kagithane Stream within the scope of this project. Pumping operations of the seawater were interrupted during rainy months due to the risk of overflowing (Koyuncu, Reference Koyuncu2018).
Phytoplankton studies carried out in the GHE were very limited before the rehabilitation; however, they have remarkably increased after 2000. It has been suggested that light limitation caused by heavy pollution inhibited phytoplankton growth, especially in the upper part of estuary before its rehabilitation (Uysal and Unsal, Reference Uysal and Unsal1996; Tas and Okus, Reference Tas and Okus2003; Tas et al., Reference Tas, Okuş and Aslan-Yılmaz2006). The breakdown of light limitation, heavy pollution and anoxia after rehabilitation was followed by consecutive algal blooms of different species (Tas et al., Reference Tas, Yilmaz and Okus2009; Taş and Okus, Reference Taş and Okuş2011; Tas, Reference Tas2015; Tas and Yilmaz, Reference Tas and Yilmaz2015; Dursun et al., Reference Dursun, Taş and Koray2016) and a rich phytoplankton composition (Tas et al., Reference Tas, Yilmaz and Okus2009). A study related to the ecological quality status of the GHE after rehabilitation showed some signs of improvement on water conditions in the upper layer (Albayrak et al., Reference Albayrak, Balkis, Balkis, Zenetos, Kurun, Karhan, Caglar and Balci2010). Phytoplankton studies following the seawater transfer into the GHE focused on algal blooms (Tas, Reference Tas2019), phytoplankton composition (Tas, Reference Tas2017; Tas, Reference Tas2020) and toxins produced by diatoms (Taş et al., Reference Taş, Ergul, Balkis, Özsoy, Çağatay, Balkis, Balkıs and Öztürk2016; Dursun et al., Reference Dursun, Unlu, Tas and Yurdun2017). In a recent study, phytoplankton composition determined by microscopy in the GHE was evaluated comparing with marker pigment detection and high-performance liquid chromatography (HPLC)-CHEMTAX analysis (Dursun et al., Reference Dursun, Tas and Ediger2021). The present study is considered to reveal the effects of changing environmental conditions due to seawater transfer into the estuary on phytoplankton composition after six years. The significant increase on phytoplankton species richness and the detection of many new species were considered new contributions to phytoplankton studies carried out in this region.
The main goal of this study is to determine the spatial–temporal variability of phytoplankton community after a long time from a remediation (seawater transfer into estuary) in a eutrophic estuary. For this purpose, we focused on phytoplankton composition, occurrence of algal blooms and the presence of toxic species considering all the previous work performed in this region.
Material and methods
Study area and sampling strategy
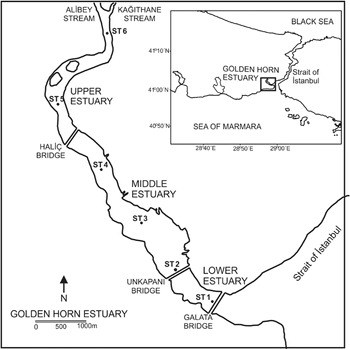
The GHE is located at northwest of the Sea of Marmara (SoM) and covers an area of about 2.5 km2, extending in a northwest–southeast direction, and it is ~7.5 km long and up to 700 m wide (Figure 1). The study area was divided into three hydrographic sections to evaluate the phytoplankton distribution: lower estuary (LE; ST1) with a depth of 40 m, middle estuary (ME; ST3) with a depth of 14 m and upper estuary (UE; ST5) with a depth of 4 m. Rainfall and two streams, Alibey and Kagithane, are the main freshwater sources for the GHE. The lower part of the GHE is characterized by a two-layered structure: the upper layer up to the depth of 25 m has a salinity of ~18, originating from the Black Sea, and the lower layer deeper than 25 m has a salinity of ~38, originating from the Mediterranean Sea. The interface between the two layers lies between 16 and 28 m (Sur et al., Reference Sur, Okuş, Sarikaya, Altiok, Eroğlu and Öztürk2002).
Study area and sampling stations.

Water samples were taken monthly (biweekly in April and May) from surface water at six sampling stations using 5 litres Niskin bottles. Temperature, salinity, dissolved oxygen (DO) and pH were measured by a multi-parameter probe (YSI Professional Pro Plus, USA), and water transparency was measured with a Secchi disc with 30 cm diameter. Chlorophyll a (Chl-a) concentrations were measured with acetone extraction method using HPLC system (Mantoura and Llewellyn, Reference Mantoura and Llewellyn1983; Barlow et al., Reference Barlow, Mantoura, Gough and Fheman1993).
Phytoplankton analysis
Water samples for quantitative analyses of phytoplankton were stored in 250 ml glass bottles and preserved with acidic Lugol's solution (2%) (Throndsen, Reference Throndsen and Sournia1978) in a cool and dark place until analysis. Sub-samples of 25–50 ml were left to settle in accordance with Utermohl sedimentation method for 24–48 h (Utermohl, Reference Utermohl1958). The identification and enumeration of phytoplankton cells were performed using a Leica DM IL LED inverted microscope equipped with phase-contrast optics at the required magnifications (100× to 400×). At least 300 phytoplankton cells were counted in each sample and calculated as cells per litre.
For qualitative analysis of phytoplankton, net samples were collected using an Apstein plankton net (10 cm diameter of mouth, 20 μm mesh size) by vertical tows from 15 m depth to surface at ST1 and ST2, and from 10 m depth to surface at ST3. Net samples were then transferred to opaque PVC jars and preserved with neutral formalin solution buffered with borax (4%). For species identification and species richness, a few drops of fixed net samples were examined under a light microscope (Leica DM 2500 LM) at the required magnifications (100× to 400×). Phytoplankton cells were classified taxonomically as their morphological characteristics. The images of some phytoplankton species were taken by a Leica DFC camera system.
The following sources were used for the identification of phytoplankton: Cupp (Reference Cupp1943), Drebes (Reference Drebes1974), Tomas (Reference Tomas1997) and Hoppenrath et al. (Reference Hoppenrath, Elbraechter and Drebes2009). The definition of potentially toxic and/or harmful species was made according to Lundholm et al. (Reference Lundholm, Churro, Fraga, Hoppenrath, Iwataki, Larsen, Mertens, Moestrup and Zingone2009). The current nomenclature of phytoplankton was checked and updated with the databases of AlgaeBase and WoRMs (World Register of Marine Species). The diatom species identified in the present study were carefully checked taking into account the latest article published related to the checklist of marine diatoms from the Turkish coastal waters (Kaleli and Akçaalan, Reference Kaleli and Akçaalan2022).
Data analysis
The relationships between the certain environmental factors and phytoplankton data and Shannon and Weaver diversity index (H′) were analysed with Spearman rank-correlation coefficients, following transformation to natural logarithms using SPSS Statistics 21.0 software. Shannon and Weaver diversity index (H′) was calculated to measure species diversity in phytoplankton community. Multidimensional scaling (MDS) was applied using the Bray–Curtis similarity for the ordination of phytoplankton community structure between sampling stations and months (Clarke and Gorley, Reference Clarke and Gorley2001). Spatiotemporal patterns in environmental data were analysed among sampling stations and months by one-way analysis of variance using SPSS Statistics 21.0 software, following logarithmic transformation to normalize all environmental data.
Results
Environmental factors
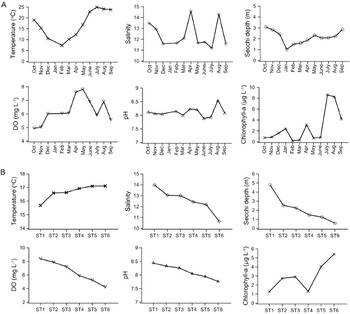
Surface water temperature displayed seasonal variation and increased slightly from the LE to the UE and ranged between 7.2°C in February (LE) and 26.1°C in July (UE). Mean annual temperatures in surface water were 15.7°C in the LE and 17.1°C in the UE (Table 1, Figure 2). Salinity of surface water varied between 7.3 (UE) and 17.4 (LE) during the study period. On the contrary to temperature, mean annual salinity in surface water decreased from 14.0 in the LE to 12.2 in the UE (Table 1, Figure 2). Temperature showed a significant variation among months (P < 0.001), while salinity displayed both monthly and spatial variations (P < 0.001) (Table 2). Secchi disc depths were measured between 0.3 m (UE) and 7.5 m (LE) during the study period. Mean annual Secchi disc depths decreased markedly from 4.8 m in the LE to 1.2 m in the UE (Table 1, Figure 2) and displayed a significant variation among stations (P < 0.001) (Table 2).
Comparison of mean values of some physical–chemical and biological data with a previous study

LE, lower estuary; ME, middle estuary; UE, upper estuary; T, temperature (°C); salinity (psu); SD, Secchi disc depth (m); DO, dissolved oxygen (mg l−1); Chl-a, chlorophyll a (μg l−1); H′; Shannon diversity index; S, number of species; N-Total, total abundance (×103 cells l−1).
The results of the previous study were taken from Tas (Reference Tas2020). Bold numbers indicate the increasing values compared to previous study.
Temporal (A) and spatial variations (B) of some environmental factors.

Significant one-way analysis of variance (ANOVA) results of spatial–temporal variations in environmental factors

DO concentrations in surface water varied between 1.5 mg l−1 (UE) and 11.8 mg l−1 (ME). DO was generally higher in spring period and its mean annual values decreased from the LE to the UE (8.4–5.3 mg l−1) (Table 1, Figure 2). pH values ranged from 7.25 (UE) to 9.05 (ME) and its mean annual values decreased from the LE to the UE (8.4–7.9) (Table 1, Figure 2). Chl-a concentrations in surface water ranged from 0.12 μg l−1 (UE) to 22.88 μg l−1 (UE) during the study period. Mean annual Chl-a values increased considerably from the LE to the UE (1.3–4.1 μg l−1) (Table 1, Figure 2). DO and pH displayed significant variations among stations (P < 0.001), while Chl-a displayed a significant variation among months (P < 0.001) (Table 2).
Phytoplankton composition
A total of 148 taxa belonging to nine taxonomic classes were identified in the phytoplankton community in the whole samples (84 water and 42 net samples). Among these, 71 taxa (48%) were diatoms, 63 taxa (42.5%) were dinoflagellates and 14 taxa (9.5%) were other groups including dictyochophyceans (4 taxa), cryptophycean (1 taxon), chrysophyceans (2 taxa), raphidophycean (1 taxon), prasinophycean (1 taxon), euglenophyceans (3 taxa) and chlorophyceans (2 taxa from freshwater algae). Among these taxa, eight taxa were the first record for the SoM and 17 taxa for the GHE (Appendix 1).
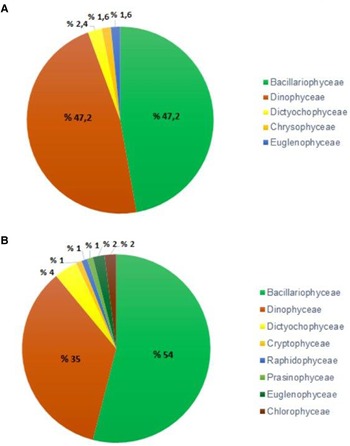
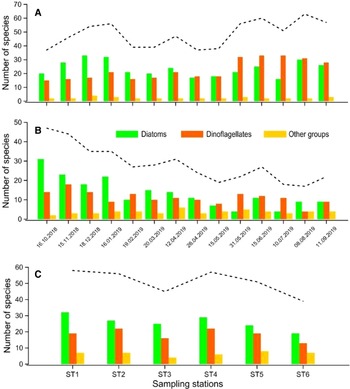
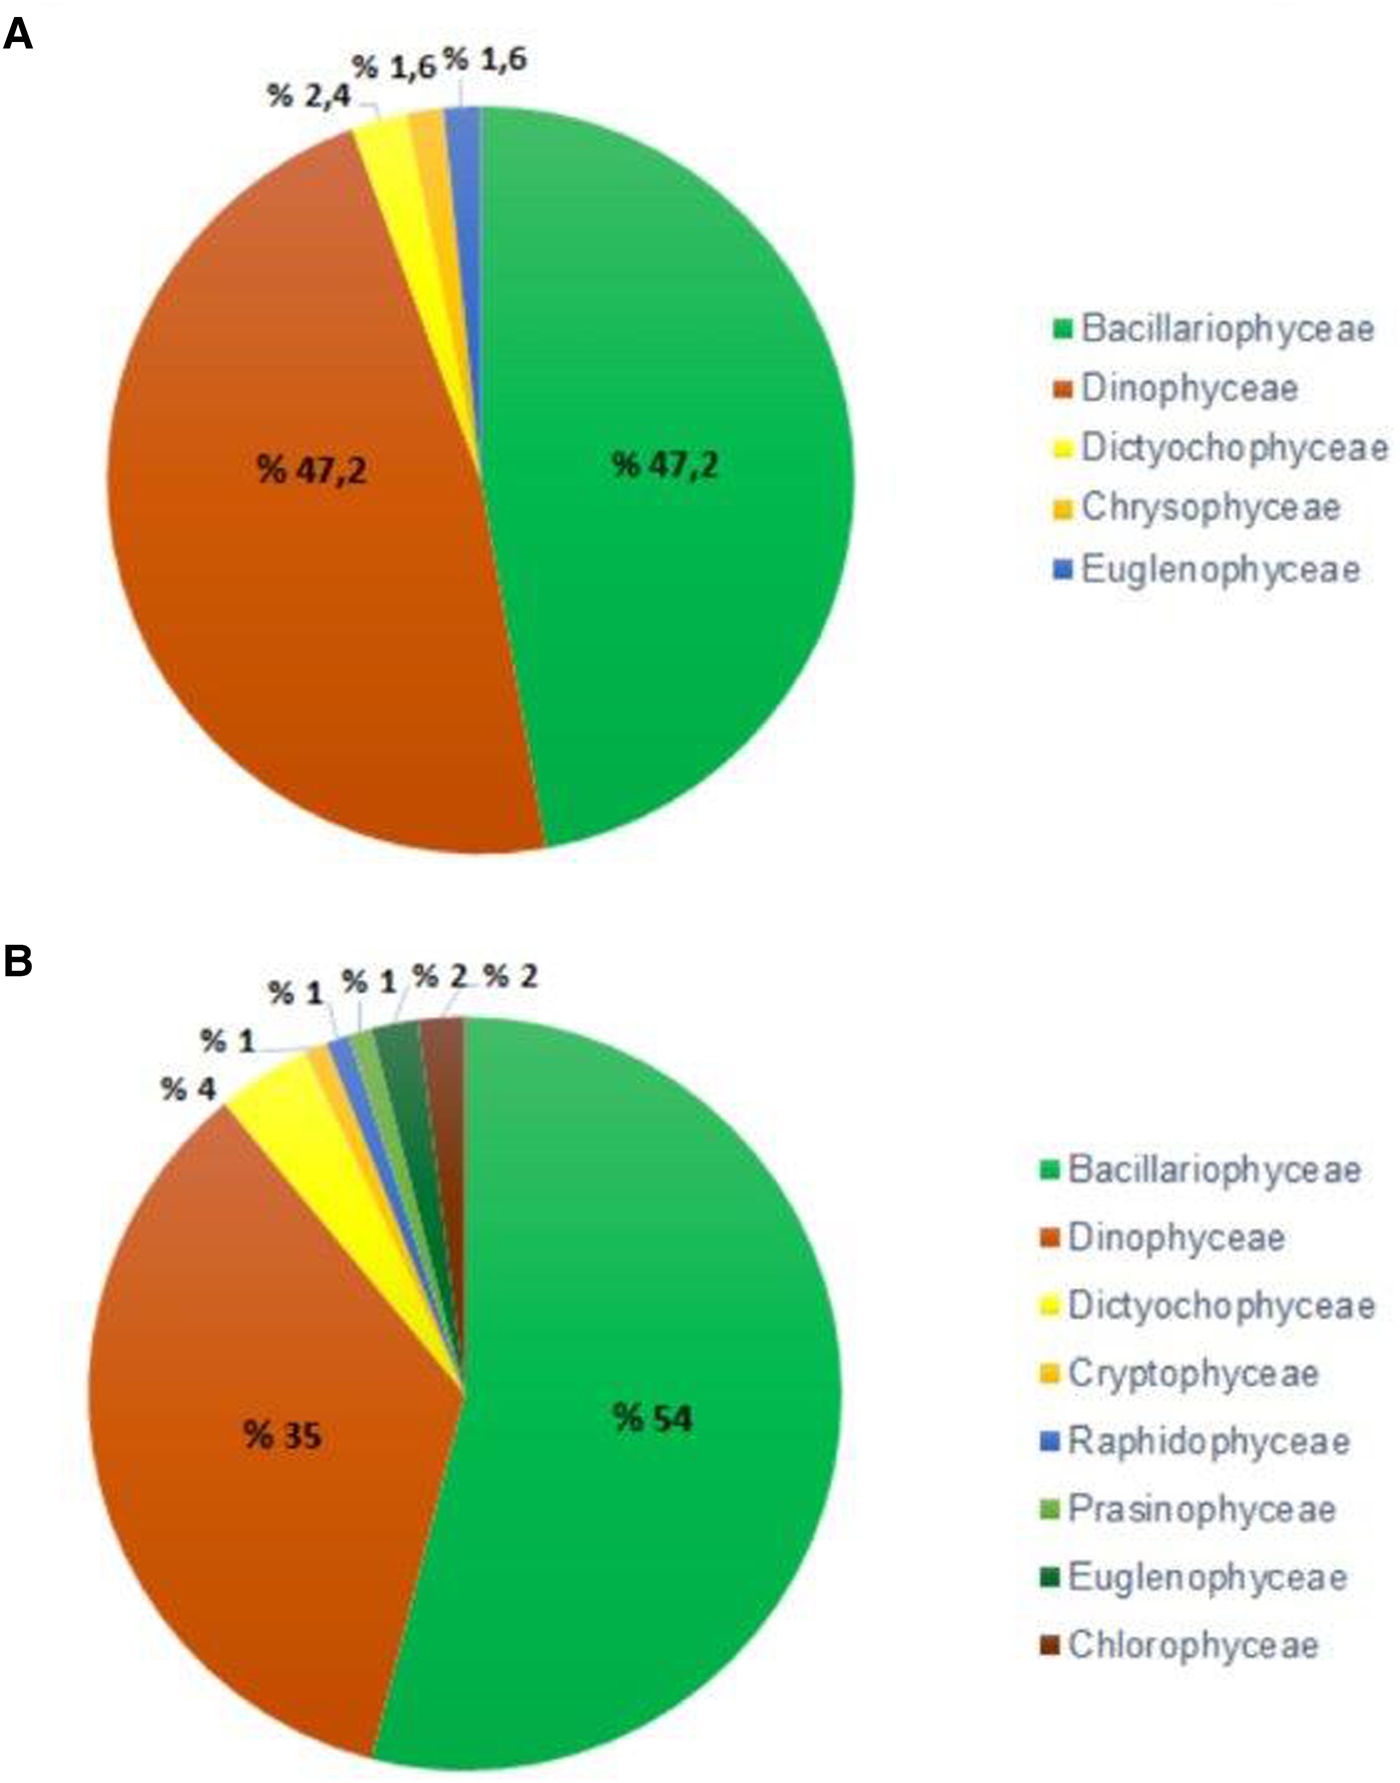
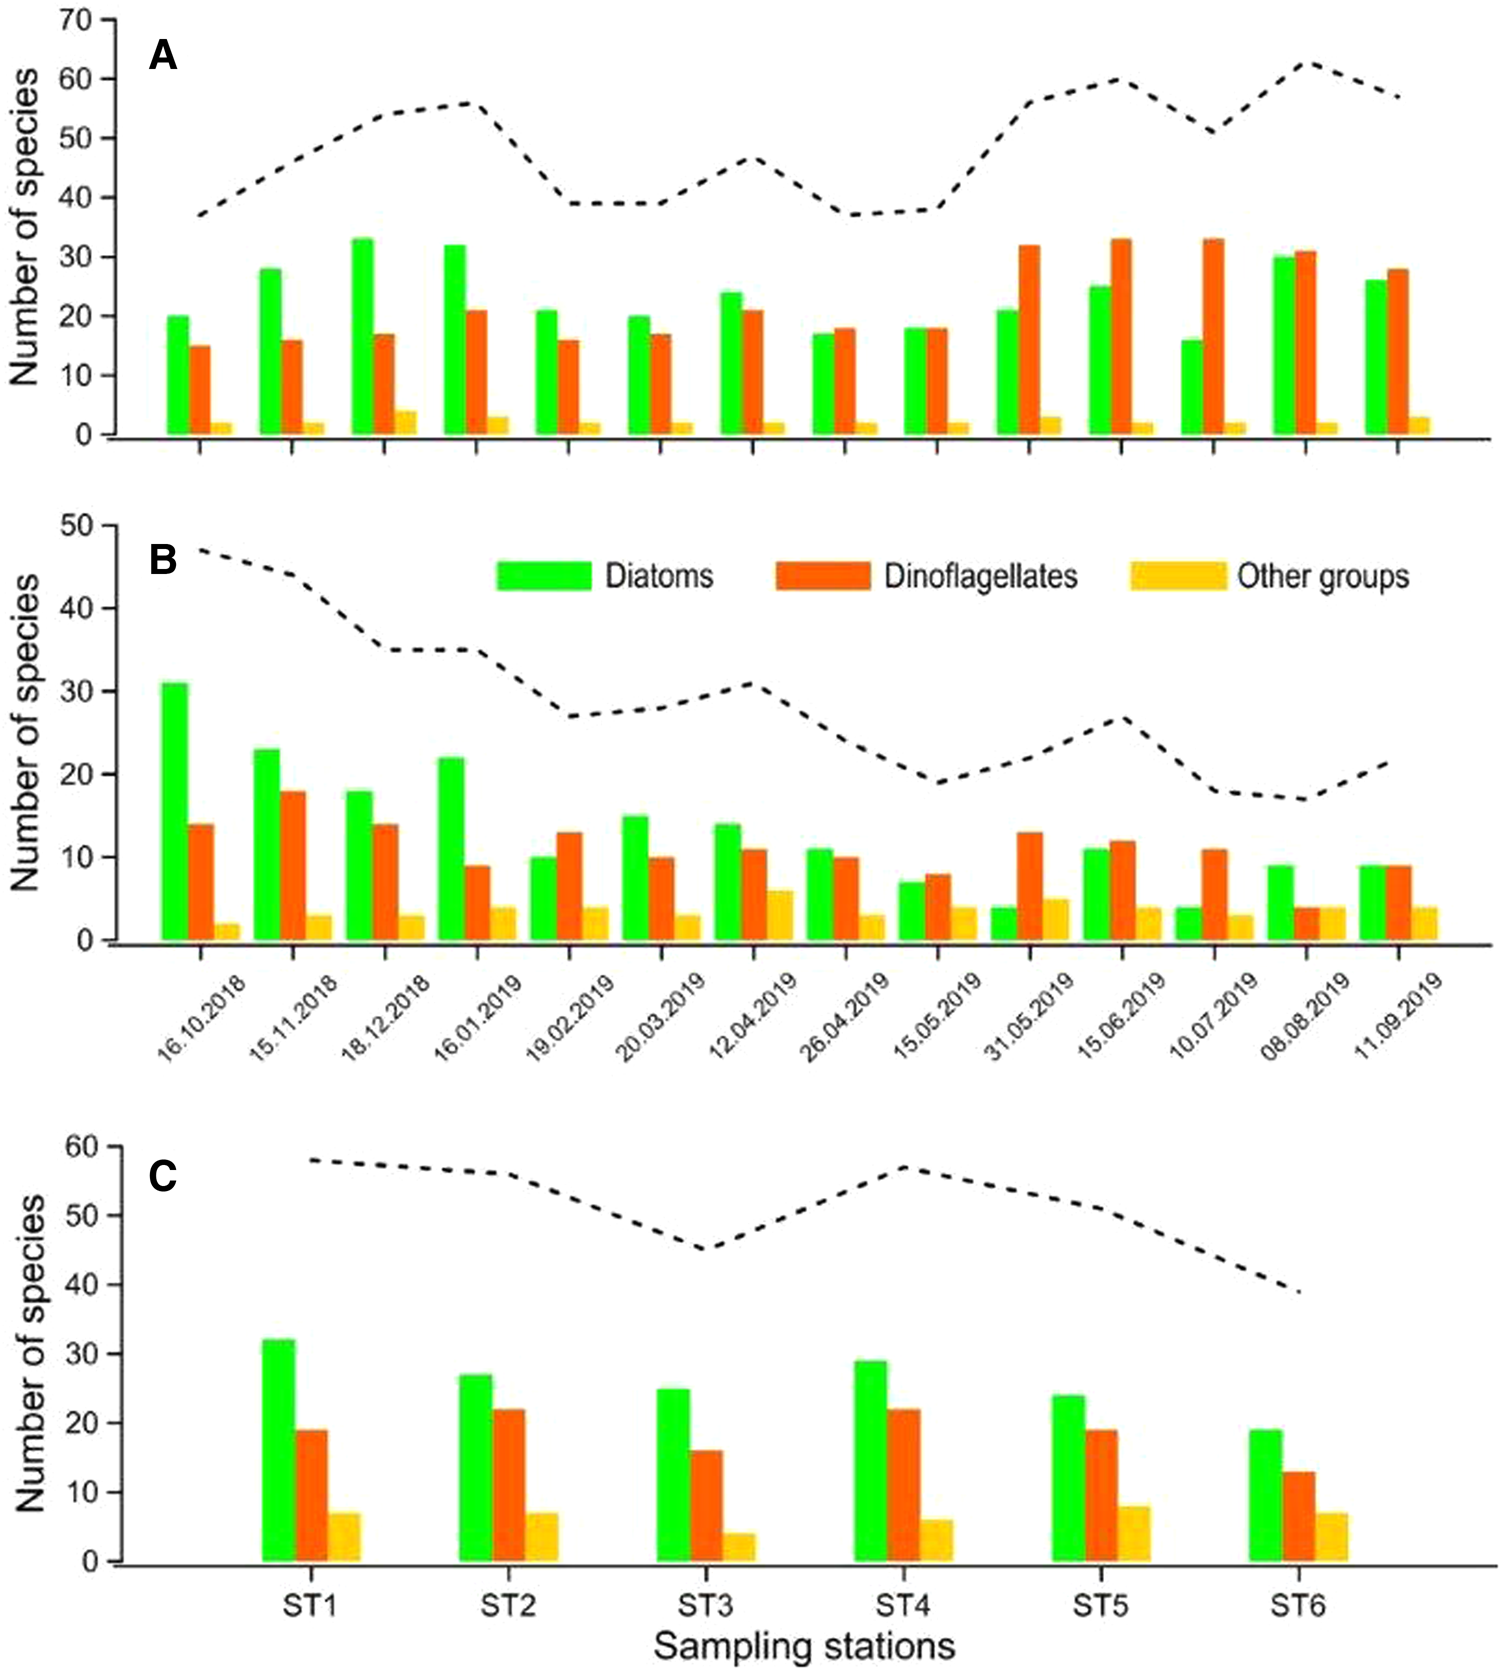
A total of 125 taxa (47.2% diatom; 47.2% dinoflagellate; 5.6% other groups) belonging to five taxonomic groups were identified in net samples, while a total of 100 taxa (54% diatom; 35% dinoflagellate; 11% other groups) belonging to nine taxonomic groups were identified in water samples (Figure 3A, B). The species richness (number of species) increased up to 47 taxa in October, while it decreased to 17 taxa in August in water samples. On the other hand, the species richness increased up to 63 taxa in August, while it decreased to 39 taxa in February and March in net samples.
Phytoplankton group composition (%) in terms of the number of species in net (A) and water samples (B).
A total of 17 species were recorded for the first time in the study area. Among these, eight species were also the first record for the SoM. Micrographs of only half of the newly recorded species were taken. The remaining species were specified as ‘cf.’ (Appendix 1).
Diatoms were the dominant group in autumn and winter in terms of species richness, while dinoflagellates were dominant in summer both in water and net samples (Figure 4A, B). In water samples, the mean annual number of species was the highest (58 taxa) in ST1 and ST4, while it was lowest (39 taxa) in ST6 (Figure 4C). The most species-rich genera in phytoplankton community were Chaetoceros (19 taxa) from diatoms and Protoperidinium (20 taxa) from dinoflagellates (Appendix 1). There was a significant negative correlation between species richness (S) and temperature (P < 0.01), while species richness (S) was correlated positively with Secchi depths (P < 0.05) (Table 3).
Monthly distribution of the number of species in net (A) and water samples (B), and the mean number of species in sampling stations (C) according to the phytoplankton groups. Dashed line shows the total number of species.
Spearman rank correlation coefficients (rho) between environmental factors and the abundance of diatoms (N-Dia), phytoflagellates (N-Pfla), total phytoplankton (N-Total), number of species (S) and Shannon diversity index (H')

No correlation was found between environmental factors and dinoflagellates.
Statistically significant correlations are indicated by symbols: – not significant; *P < 0.05; **P < 0.01.
Shannon and Weaver diversity index (H') differed in spatial and seasonal. In general, H' value decreased from the LE to the UE based on the increase in cell abundance. The maximum H' values (H' max) were 3.51 and 3.38 at ST5 and at ST1, respectively. The mean H' value (H' mean) was highest (1.89) at ST5, while it was lowest (0.90) at ST3. The H' values were generally higher in autumn and lower in summer. The mean H' value (H' mean) was maximum (2.54) in November, while it was minimum (0.54) in July. There was a significant negative correlation between H' values and temperature/DO/pH (P < 0.01) (Table 3).
Cell abundance
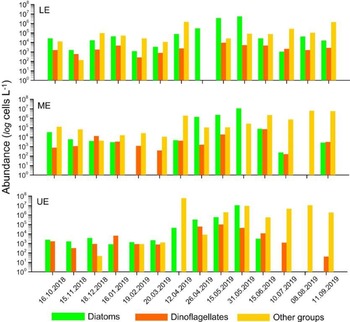
Cell abundance differed both among months and sampling stations in the GHE during the study period. The cell abundance increased markedly in spring and summer, while it was found to be low during autumn and winter. Cell abundance increased significantly in the ME and LE during spring and summer (Figure 5). There was a positive correlation between total phytoplankton abundance (N-Total) and temperature/DO (P < 0.01) and pH values (P < 0.05) (Table 3). A significant increase was observed in diatom abundance in April and May and they dominated the phytoplankton community. Diatom abundance (N-Dia) had a positive correlation with DO (P < 0.01) and salinity/pH (P < 0.05) (Table 3).
Cell abundances of the phytoplankton groups in the lower, middle and upper estuary during the study period.

Cell abundance of phytoflagellates, such as cryptophycean, raphidophycean and euglenophyceans, increased considerably from May to September. Phytoflagellate abundance (N-Pfla) had a positive correlation with temperature (P < 0.01) and DO (P < 0.05) (Table 3). The highest abundance in dinoflagellates was observed in May. The LE and ME displayed a relatively similar group composition while the UE had a different group composition (Figure 5).
The phytoplankton community in the GHE showed a spatiotemporal variation according to the MDS analysis. Although the phytoplankton community displayed a similar structure in spring and summer, a different structure in autumn and winter was observed (Figure 6). On the other hand, there was a similar phytoplankton community structure at the LE and ME, while the UE had a different community structure than the other parts (Figure 6).
MDS ordination of phytoplankton community structure at sampling months and stations.

Phytoplankton blooms
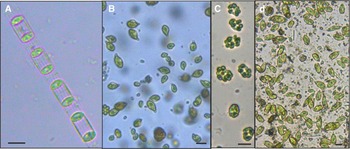
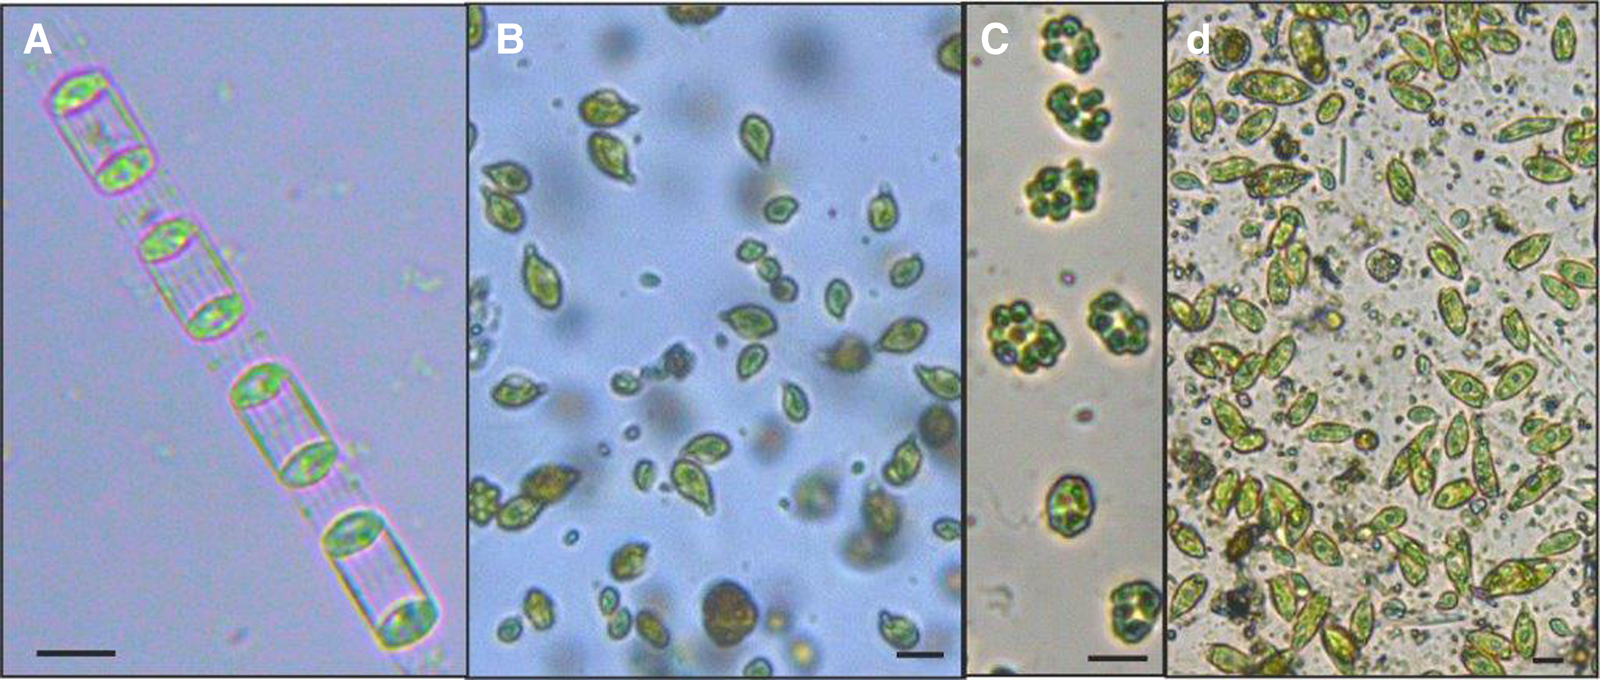
Five phytoplankton taxa belonging to four taxonomic groups formed the dense blooms during spring and summer. In some of these blooms, discolouration in surface water was observed. The diatom Skeletonema spp. (Figure 7A) formed a very dense bloom in the UE in late May and its abundance reached up to 53 × 106 cells l−1, which was the highest abundance in phytoplankton community. The cryptophycean Teleaulax cf. amphioxeia (Figure 7B) dominated phytoplankton community in the ME during autumn and winter, and its cell abundance reached to 125 × 103 cells l−1 in October. Teleaulax cf. amphioxeia had a high abundance from April to August and formed dense blooms in the UE, causing water discolouration in surface. The abundance of T. cf. amphioxeia reached to 9.1 × 10⁶, 3.9 × 10⁶ and 2.4 × 10⁶ cells l−1 in the ME and UE in April, May and June, respectively. Teleaulax cf. amphioxeia also formed another bloom in August and its abundance reached to 2.9 × 10⁶ cells l−1 in the UE. The raphidophycean Heterosigma akashiwo (Figure 7C) caused dense blooms in late May and these blooms lasted until September. The abundance of H. akashiwo during these blooms, which occurred in the ME and UE, reached to 4 × 10⁶ cells l−1 in late May, 27 × 106 cells l−1 in June, 14.2 × 10⁶ cells l−1 in July, 12 × 106 cells l−1 in August and 6.9 × 10⁶ cells l−1 in September. The euglenophyceans Eutreptia sp. and Eutreptiella sp. (Figure 7D) formed very dense blooms, causing greenish water discolouration in surface of the upper estuary in April and their abundance reached up to 47.6 × 10⁶ and 20.3 × 10⁶ cells l−1, respectively.
Light micrographs of bloom-forming phytoplankton species in the study area. (A) Skeletonema sp.; (B) Teleaulax cf. amphioxeia; (C) Heterosigma akashiwo; (D) Euglenophyceans. Scale bars: 10 μm.
Potentially toxic species
A total of 12 phytoplankton taxa, known to be potentially toxic, were detected in the GHE during the study period. Most of the potentially toxic microalgae were dinoflagellates (10 taxa) and others consisted of one diatom and one raphidophycean (Table 4).
Potentially toxic species detected during the study period with their known effects, seasonality, locality and maximum cell density

ASP, amnesic shellfish poisoning; DSP, diarrhoetic shellfish poisoning; PSP, paralytic shellfish poisoning; YTX, yessotoxin.
a Species observed only in net samples.
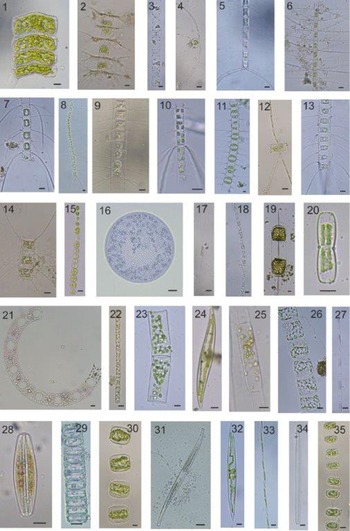
The diatom Pseudo-nitzschia species that are known to be potentially toxic (Figure 8/33) were commonly observed in the study area. Pseudo-nitzschia spp. were detected abundantly in April and May. The species of Pseudo-nitzschia were mostly detected in the LE and ME and they were rarely observed except in April and May. The highest abundance of Pseudo-nitzschia spp. was counted as 520 × 103 cells l−1 in the LE in May (Table 4). Light microscope images of some diatom species identified in the study area were given in Figure 8.
Light micrographs of some diatom species detected in the study area. (1) Achnanthes longipes; (2) Bacteriastrum hyalinum; (3) Cerataulina pelagica; (4) Chaetoceros aequatorialis; (5) Chaetoceros affinis; (6) Chaetoceros willei; (7) Chaetoceros brevis; (8) Chaetoceros compressus; (9) Chaetoceros constrictus; (10) Chaetoceros contortus; (11) Chaetoceros curvisetus; (12) Chaetoceros danicus; (13) Chaetoceros diadema; (14) Chaetoceros lorenzianus; (15) Chaetoceros tortissimus; (16) Coscinodiscus radiatus; (17) Cylindrotheca closterium; (18) Dactyliosolen fragilissimus; (19) Ditylum brightwellii; (20) Entomoneis sp.; (21) Eucampia zodiacus; (22) Guinardia delicatula; (23) Guinardia flaccida; (24) Gyrosigma sp.; (25) Hemialus hauckii; (26) Lauderia annulata; (27) Leptocylindrus minimus; (28) Navicula sp.; (29) Paralia sulcata; (30) Porosira glacialis; (31, 32) Pleurosigma sp.; (33) Pseudo-nitzschia sp.; (34) Thalassionema frauenfeldii; (35) Thalassiosira nordenskioeldii. Scale bars: 10 μm.

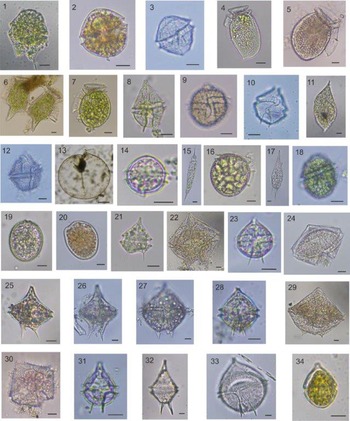
Toxic dinoflagellate Alexandrium cf. tamarense (Figure 9/3) and Dinophysis infundibulum (Figure 9/7) were recorded for the first time in the GHE. Alexandrium species were detected only in net samples (Table 4). Dinophysis species were rarely observed and generally found in low abundances. The abundance of D. acuta (Figure 9/5) and D. infundibulum (Figure 9/7) reached maximum at 520 cells l−1 in the LE in June and September, respectively. Dinophysis species were rarely observed in the UE (Table 4). Other toxic dinoflagellates Phalacroma rotundatum (Figure 9/16) and Gonyaulax spinifera (Figure 9/10) were detected only in net samples. Lingulodinium polyedra (Figure 9/12) was found in very low abundance (40 cells l−1) in the UE in March and May. Prorocentrum cordatum was mostly detected in summer, reaching maximum at 20.8 × 10³ cells l−1 in the ME in June (Table 4).
Light micrographs of some dinoflagellate species detected in the study area: (1) Akashiwo sanguinea; (2) Alexandrium sp.; (3) Alexandrium cf. tamarense; (4) Dinophysis acuminata; (5) Dinophysis acuta; (6) Dinophysis caudata; (7) Dinophysis infundibulum; (8) Gonyaulax polygramma; (9) Gonyaulax scrippsae; (10) Gonyaulax spinifera; (11) Gyrodinium spirale; (12) Lingulodinium polyedra; (13) Noctiluca scintillans; (14) Oblea rotunda; (15) Oxytoxum scolopax; (16) Phalacroma rotundatum; (17) Podolompas palmipes; (18) Protoceratium reticulatum; (19) Prorocentrum compressum; (20) Prorocentrum scutellum; (21) Protoperidinium bipes; (22) Protoperidinium brochii; (23) Protoperidinium cerasus; (24) Protoperidinium conicum; (25) Protoperidinium diabolum; (26) Protoperidinium divergens; (27) Protoperidinium pallidum; (28) Protoperidinium pellucidum; (29) Protoperidinium pentagonum; (30) Protoperidinium punctulatum; (31) Protoperidinium pyriforme; (32) Protoperidinium steinii; (33) Protoperidinium sp.; (34) Scrippsiella acuminata. Scale bars: 10 μm (excl. N. scintillans); scale bar: 100 μm for N. scintillans.
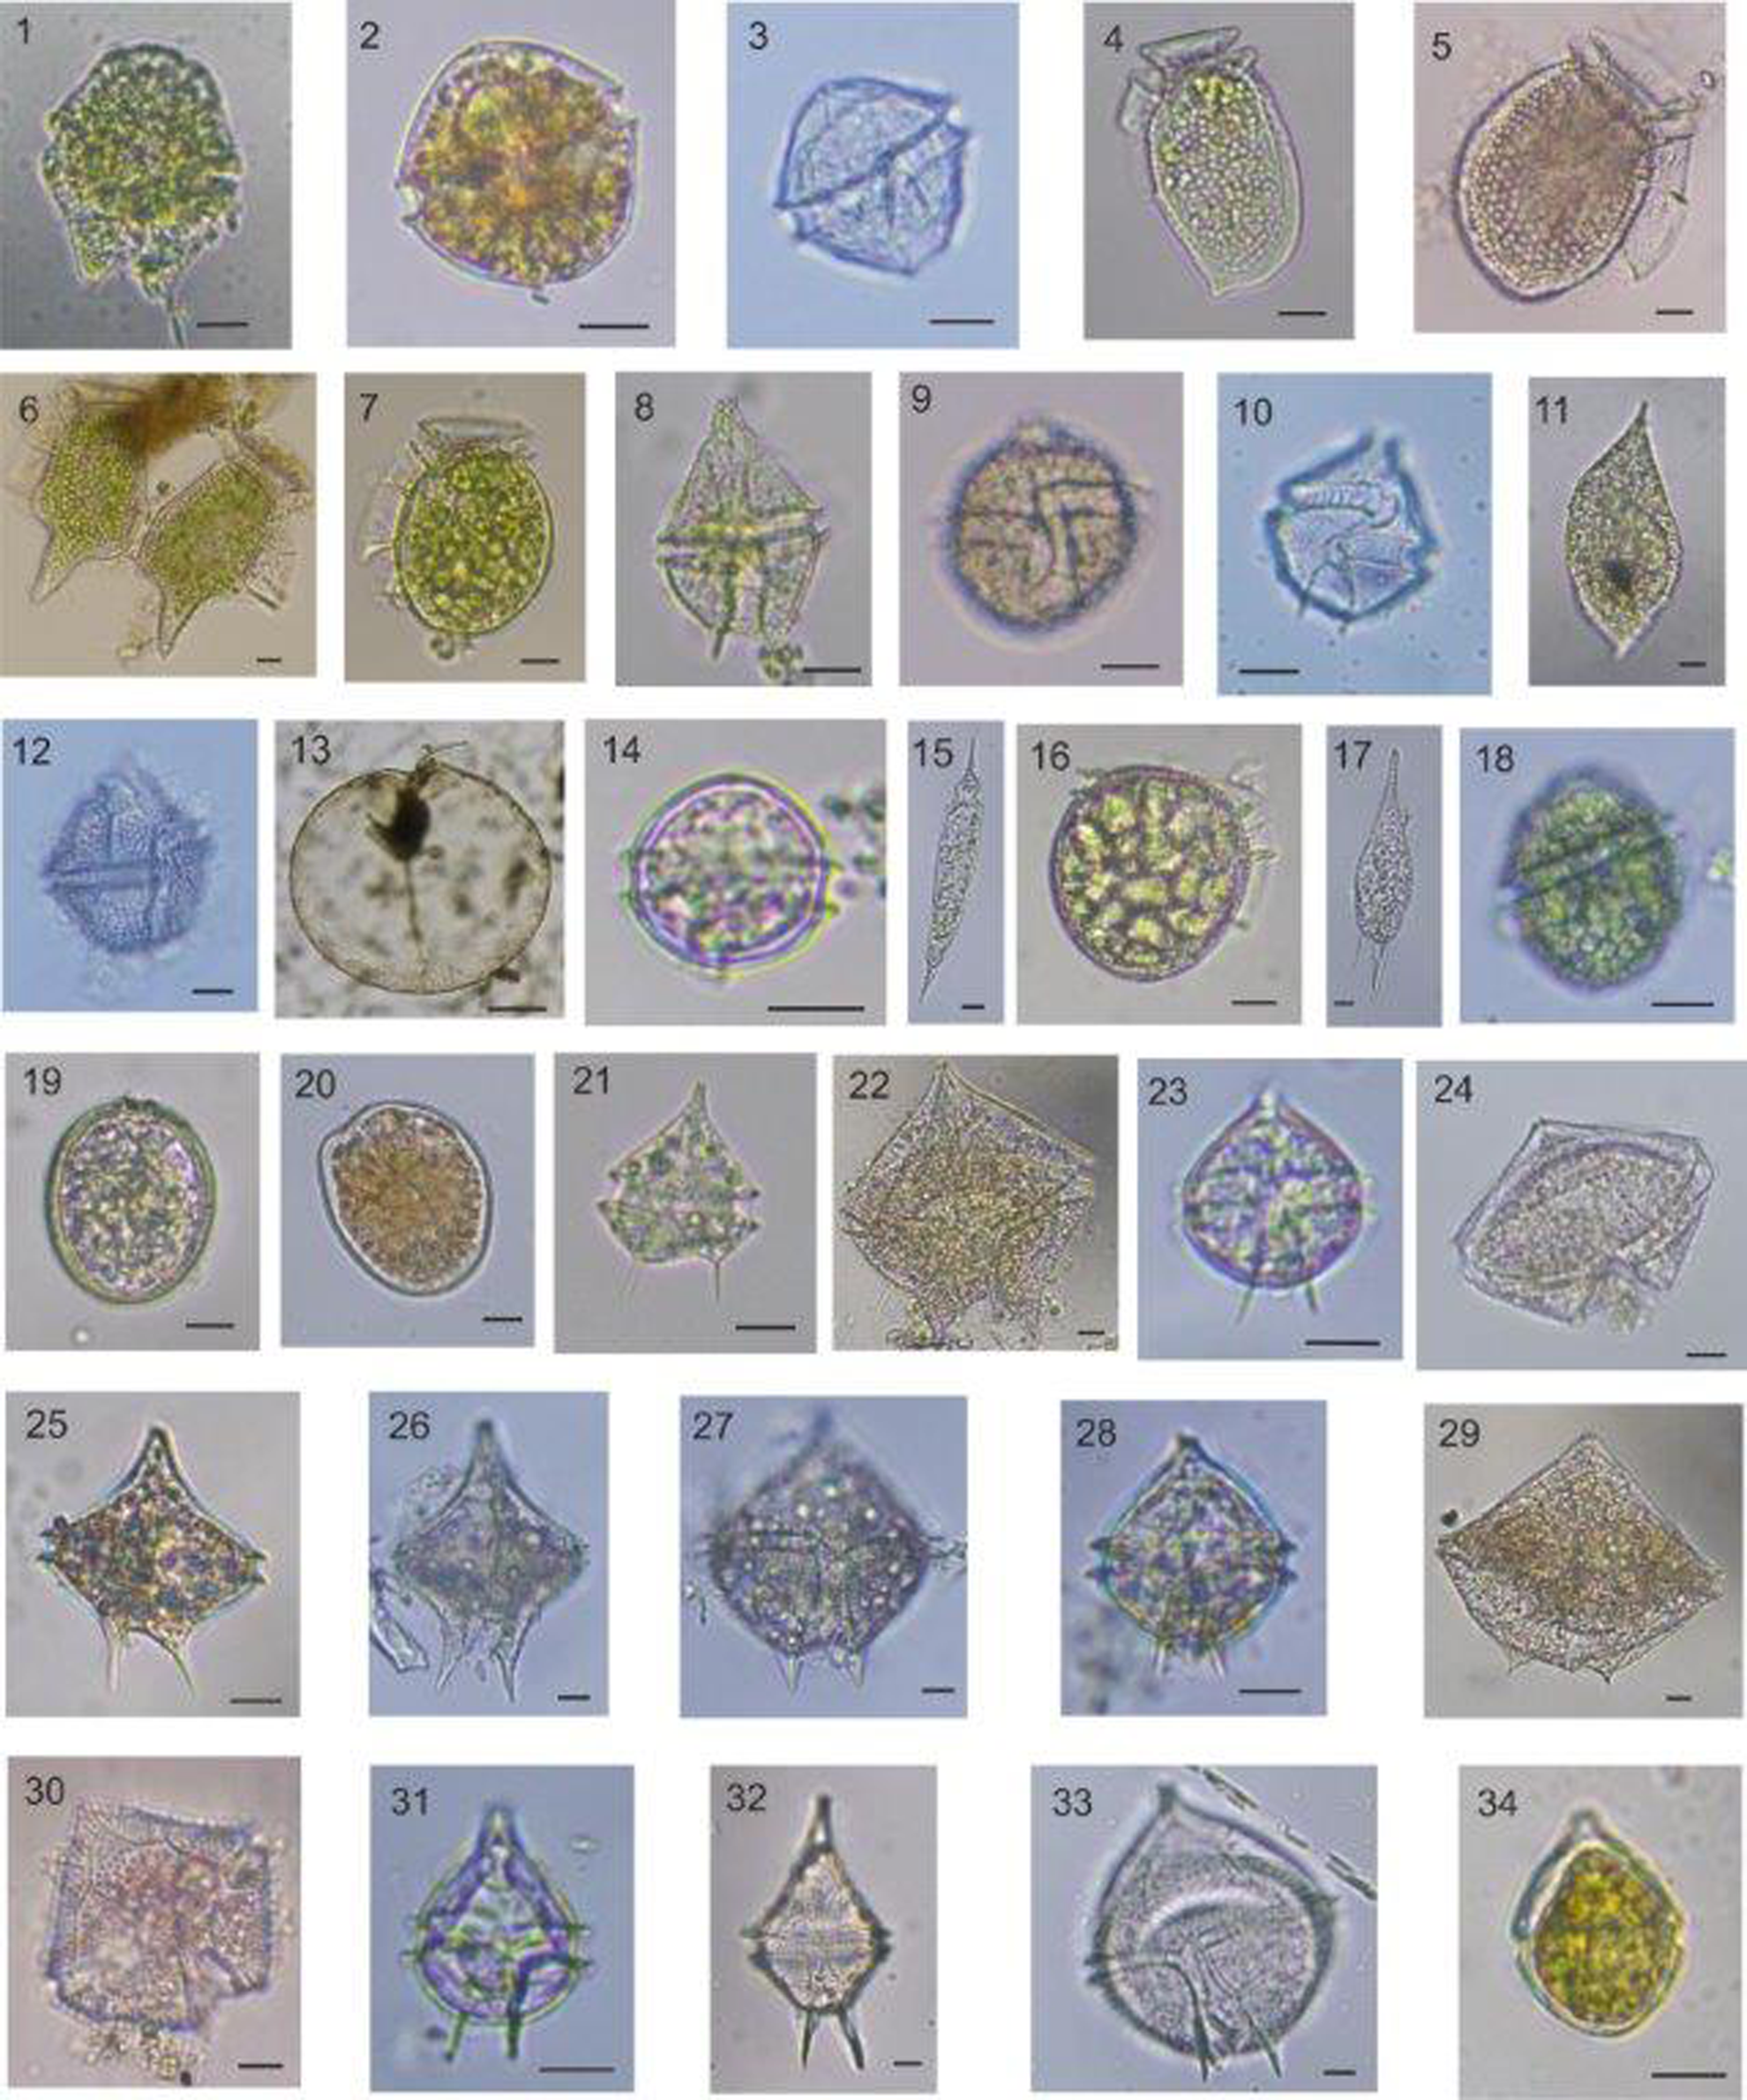
Heterosigma akashiwo, a raphidophycean, reached to very high abundance from late May to September and formed successive blooms which caused water discolouration in surface. The abundance of H. akashiwo reached up to 27 × 106 cells l−1 in the ME during its bloom in June (Table 4). Light microscope images of some dinoflagellate species identified in the study area were given in Figure 9.
Discussion
It is well known that phytoplanktons are efficient indicators of ecological changes and they are very sensitive to numerous environmental stressors (Paerl et al., Reference Paerl, Valdes-Weaver, Joyner and Winkelmann2007). Some previous studies on phytoplankton carried out in estuaries of the Mediterranean Sea showed that main environmental factors such as temperature, salinity, water transparency and nutrients play an important role in the seasonal variation of phytoplankton abundance and diversity (Cetinić et al., Reference Cetinić, Viličić, Burić and Olujić2006; Burić et al., Reference Burić, Cetinić, Viličić, Mihalić, Carić and Olujić2007; Barbosa et al., Reference Barbosa, Domingues and Galvão2010; Jasprica et al., Reference Jasprica, Carić, Kršinić, Kapetanović, Batistić and Njire2012). The temporal variation of phytoplankton biomass in eutrophic estuaries is also associated with light availability (Cloern, Reference Cloern1987; Mallin et al., Reference Mallin, Cahoon, McIver, Parsons and Shank1999). It has been also reported that light limitation, salinity changes and water circulation may limit the phytoplankton growth (McLusky and Elliott, Reference McLusky and Elliott2004). The results obtained from this study revealed that the phytoplankton composition in the GHE also fluctuated spatially and temporally depending on the main environmental factors.
Mean surface water temperature, salinity and Secchi disc values in the whole study area were lower than the previous study (Tas, Reference Tas2020), as seen in Table 1. Changes in water temperature and the lower water temperature observed in this study period did not at the level negatively affect the phytoplankton growth. The lower salinity values particularly in the upper estuary might be explained with the decrease of amount of sea water transfer to the estuary or the increase in the freshwater input to the estuary.
The lower salinity values detected in this study period can create a more suitable environment for some microalgae species which are able to adapt to wide tolerance of salinity. The local distribution and composition of phytoplankton along the study area is considered to be likely related to the salinity gradients in the GHE as stated by Ahel et al. (Reference Ahel, Barlow and Mantoura1996). It is suggested that diatoms in the lower estuary composed mainly of estuarine species that have a high salinity tolerance (Ahel et al., Reference Ahel, Barlow and Mantoura1996). The brackish water phytoplankton was negatively affected by a decrease in salinity. The different phytoplankton species in brackish water have different salinity tolerances; therefore, some algal groups are more sensitive to a reduction in salinity than others (Lionard et al., Reference Lionard, Muylaert, Gansbeke and Vyverman2005).
The lower Secchi disc depths, especially in the upper estuary, might be the result of re-suspension of the sediment into the water column in the upper part, which is very shallow, or caused by the suspended particulate matter load carried by the streams. Light intensity had a strong and significant effect on the growth of phytoplankton communities. Although diatoms are generally known to be adapted to low light levels, they were negatively affected by a reduction in light intensity (Lionard et al., Reference Lionard, Muylaert, Gansbeke and Vyverman2005). The decrease in the Secchi depths along the study area affected markedly the spatial distribution of phytoplankton. The low light penetration based on the Secchi depths, especially in the upper estuary, is considered as one of the most important factors affecting phytoplankton growth in autumn and winter.
Chl-a values were higher in the middle and upper estuary where abundance of phytoplankton was higher, as stated by the previous study (Tas, Reference Tas2020). On the other hand, it is noteworthy that the Chl-a values were lower than those of the previous study, as seen in Table 1. This case is considered to be related to the method using for Chl-a analysis (HPLC method) in the present study. The mean values of DO in the UE were found to be higher than some previous studies performed during the last decade (Tas and Yilmaz, Reference Tas and Yilmaz2015; Dursun and Taş, Reference Dursun and Taş2019; Tas, Reference Tas2020). For example, DO values were 56% higher than a previous study carried out by Tas (Reference Tas2020), as seen in Table 1. The increase in DO values in the UE where the water quality was worse than the remaining sections of estuary is considered as a positive reflect of changing environmental conditions in last years.
In comparison with the previous studies, the percentage of diatoms in the total number of species was lower in the present study, while those of dinoflagellates was higher. For example, the percentage of diatoms and dinoflagellates in the total number of species was 48.5 and 38.5% between 2011 and 2012 (Dursun and Taş, Reference Dursun and Taş2019) and was 52 and 38.5% between 2013 and 2014 (Tas, Reference Tas2020). The gradual decrease in species richness from the LE to the UE was compatible with the results of the past studies (Dursun and Taş, Reference Dursun and Taş2019; Tas, Reference Tas2020). This result may be associated with less number of phytoplankton species that are capable of adapting themselves to the current conditions of the upper estuary. In addition, the negative relationship between species richness and water temperature in the UE may be related to the dominancy of one or a few species in terms of abundance. However, a threefold increase in species diversity (H′) and about 40% higher species richness in the upper part of the GHE were detected compared with the past study, as seen in Table 1. Moreover, the first time record of 17 phytoplankton taxa during the present study was very important in terms of displaying the richer community composition of the study area. These are important indicators that the phytoplankton composition may change based on the appropriate environmental conditions.
Cell abundance of diatoms in the upper estuary was generally lower than the other parts, while those of dinoflagellates and other phytoflagellates were higher. It is well known that, some species belonging to dinoflagellates and phytoflagellates are capable of heterotrophy and mixotrophy, and also they might form cysts (Legrand et al., Reference Legrand, Graneli and Carlsson1998; Olli, Reference Olli2004; Rensel, Reference Rensel2007; Wang et al., Reference Wang, Oi and Yang2007). These traits can provide a significant advantage to them among other species in phytoplankton community for growing and reproducing in the appropriate/suitable environmental conditions. The phytoplankton species that formed blooms in the middle and upper estuary in spring and summer might be more competitive in nutrient-rich environment than the other species. It has been stated that the changes in environmental conditions following rehabilitation efforts came up with an important variability of phytoplankton community composition in the GHE (Tas et al., Reference Tas, Yilmaz and Okus2009; Tas, Reference Tas2020). Seventeen new phytoplankton taxa recorded in this study period showed that there is a richer phytoplankton community than the previous years and this maybe one of the most important evidences of the changing environmental status of the GHE. Certain environmental factors (nutrients, light intensity, water temperature and salinity) have an indicative role in phytoplankton composition (Cetinić et al., Reference Cetinić, Viličić, Burić and Olujić2006; Burić et al., Reference Burić, Cetinić, Viličić, Mihalić, Carić and Olujić2007; Barbosa et al., Reference Barbosa, Domingues and Galvão2010).
Some species of microalgae can form blooms that may cause harmful effects to aquatic ecosystems under certain circumstances. Ecosystem damage by high-biomass blooms may include disruption of food webs, fish-kills by gill damage or low oxygen levels after bloom degradation. Some species also produce various toxins with different harmful effects causing illness or death of aquatic animals and/or human seafood consumers (Kudela et al., Reference Kudela, Berdalet, Bernard, Burford, Fernand, Lu, Roy, Tester, Usup, Magnien, Anderson, Cembella, Chinain, Hallegraeff, Reguera, Zingone, Enevoldsen and Urban2015). The algal cells can sometimes reach high concentrations that their dominant pigments cause water discolouration (Lassus et al., Reference Lassus, Chomérat, Hess and Nézan2016).
Many algal blooms causing discolouration on the surface water of the GHE were reported in the last two decades (Tas et al., Reference Tas, Yilmaz and Okus2009; Taş and Okus, Reference Taş and Okuş2011; Tas, Reference Tas2015, Reference Tas2019; Tas and Yilmaz, Reference Tas and Yilmaz2015; Dursun et al., Reference Dursun, Taş and Koray2016; Tas and Lundholm, Reference Tas and Lundholm2017). Results obtained from the studies revealed that the eutrophic conditions in the middle and upper sections of the GHE provide more suitable environment for algal blooms in spring and summer. The frequency of bloom events and the number of bloom-forming species detected during this study period were less than the recent studies (Tas and Yilmaz, Reference Tas and Yilmaz2015, Tas, Reference Tas2019).
Skeletonema is a common diatom genus of eutrophic waters and estuaries (Liu et al., Reference Liu, Sun, Zou and Zhang2005, Cetinić et al., Reference Cetinić, Viličić, Burić and Olujić2006, Jasprica et al., Reference Jasprica, Carić, Kršinić, Kapetanović, Batistić and Njire2012). Skeletonema, a planktonic genus of centric diatoms, is known as euryhaline and they might have broad salinity ranges and grow well between salinities 10 and 35 (Balzano et al., Reference Balzano, Sarno and Kooistra2010). Temperature, salinity and total inorganic nitrogen were the main factors influencing diatom community structure in the Neretva River estuary (Jasprica et al., Reference Jasprica, Carić, Kršinić, Kapetanović, Batistić and Njire2012). Three Skeletonema species (S. costatum, S. dohrnii and S. menzelii) found in the Bilbao estuary can be considered euryhaline and, therefore, both brackish and marine, estuarine and coastal waters appear to be suitable environments for the active growth of these species. They can grow over a broad salinity range (from 5 to 35 psu). Differences in salinity tolerance have been observed within Skeletonema species in coastal waters (Hevia-Orube et al., Reference Hevia-Orube, Orive, David, Laza-Martınez and Seoane2016). Sarno et al. (Reference Sarno, Kooistra, Medlin, Percopo and Zingone2005) have stated that S. costatum-like species that fell into four morphologically distinct groups identified in the phylogenetic tree are quite distinct from each other. The species belonging to Skeletonema genus in this study are presented as Skeletonema spp. in order to avoid misidentification. Skeletonema spp. are very common diatom species in the GHE and their dense blooms causing water discolouration particularly in spring and early summer have been reported in the previous years (Tas et al., Reference Tas, Yilmaz and Okus2009; Tas and Yilmaz, Reference Tas and Yilmaz2015; Dursun and Taş, Reference Dursun and Taş2019; Tas, Reference Tas2019). The blooms of Skeletonema species occurred in April and May in the present study, as observed in previous years. Certain circumstances such as increasing light intensity, temperature and salinity in the GHE may favour the growth of S. marinoi (Tas, Reference Tas2019). The results on Skeletonema species obtained in the present study are found to be consistent with the previous studies.
Phytoflagellates including different taxonomic classes have an important role in the phytoplankton community of the GHE and they form blooms occasionally in spring and summer periods. Cryptomonads (Cryptophyceae) are a relatively small group of flagellates known as nanoplankton. Thus, it makes difficult to identify them under light microscopy. Cryptophytes are considered good quality food for other protists. Findings showed that Plagioselmis prolonga is the haploid stage of the life cycle of Teleaulax amphioxeia (Altenburger et al., Reference Altenburger, Blossom, Garcia-Cuetos, Jakobsen, Carstensen, Lundholm, Hansen, Moestrup and Haraguchi2020) and P. prolonga is currently regarded as a synonym of T. amphioxeia (Guiry and Guiry, Reference Guiry and Guiry2020). Thus, cryptomonads detected in our samples were found morphologically closer to T. amphioxeia (formerly P. prolonga) and it was identified as T. cf. amphioxeia. In some previous studies, it has been reported that cryptophycean P. prolonga caused blooms with greenish-brown water discolouration particularly in the upper section of the GHE (Tas and Yilmaz, Reference Tas and Yilmaz2015; Dursun and Taş, Reference Dursun and Taş2019; Tas, Reference Tas2019). In a detailed study on different cryptomonads, it was reported that they may adapt to a wide variety of environmental conditions (Cerino and Zingone, Reference Cerino and Zingone2006). Water temperature and nutrients were the main factors that affected the growth of P. prolonga (Tas, Reference Tas2019). Also, in this study, P. prolonga formed dense blooms with greenish-brown water discolouration in spring and this agrees with the results of the previous studies performed in the GHE.
The euryhaline raphidophycean H. akashiwo is a harmful microalgae (Rensel et al., Reference Rensel, Haigh and Tynan2010) and it is also known that H. akashiwo is capable of cyst formation and germination of their cysts at temperature above 15°C (Rensel, Reference Rensel2007). These characteristics (e.g. wide salinity tolerance and cyst formation) may provide them a competitive advantage over the other phytoplankton species. It has been reported that H. akashiwo formed dense blooms causing yellowish-brown discolouration in surface water of the GHE in late spring and summer and the rapid increase in the abundance of H. akashiwo has been associated with a rapid temperature rise (Tas and Yilmaz, Reference Tas and Yilmaz2015; Dursun et al., Reference Dursun, Taş and Koray2016; Tas, Reference Tas2019). In the present study, H. akashiwo formed a bloom with water discolouration in June (22.9°C), as observed in previous years. It is considered that the suitable environmental conditions in the study area can prompt the blooms of H. akashiwo, especially in late spring and summer. Thus, it should be taken into account that the dense blooms of H. akashiwo may pose a potential risk for the GHE ecosystem.
The nutrient-rich waters stimulate the growth of the euglenophyceans (Olli et al., Reference Olli, Heiskanen and Seppälä1996) and probably the increase in light availability accelerated their growth and caused to dense blooms (Tas, Reference Tas2019). Euglenophyceans, including species of genera Euglena, Eutreptia and Eutreptiella, were commonly observed especially in the upper section of the GHE. The blooms of some euglenophyceans with greenish water discolouration were reported in the previous studies performed in the GHE (Tas et al., Reference Tas, Yilmaz and Okus2009; Tas and Yilmaz, Reference Tas and Yilmaz2015; Tas, Reference Tas2019). The spring bloom of euglenophyceans with a dark greenish water discolouration in the UE was also observed during the present study. The results indicated that the upper estuary has a suitable environment to form blooms of these species in spring and summer.
Conclusion
The phytoplankton composition in the study area displayed a clear spatial–temporal variation depending on certain environmental conditions. The change on phytoplankton community structure was observed more apparently from the lower to the upper estuary. Higher species diversity and species richness particularly in the upper estuary, compared with the previous studies, was considered as an important change in local phytoplankton community. Some microalgae formed dense blooms causing water discolouration in the middle and upper estuary; however, the frequency of bloom events and the number of bloom-forming species detected during this study period were relatively less than the previous years. It is considered that the sampling frequency is also important in the decrease of the bloom events observed in the present study. Although bloom events in this study period relatively decreased, the middle and upper estuaries have a suitable environmental condition to form blooms of some microalgae. Findings showed that phytoplankton composition might be used as an indicator of the changes of environmental conditions in such ecosystems.
Supplementary material
The supplementary material for this article can be found at https://doi.org/10.1017/S0025315423000449.
Acknowledgements
The authors would like to thank Denizhan Vardar for his contributions to the field studies.
Author contributions
Co-author Seyfettin Tas provided an important scientific contribution and another co-author Fuat Dursun provided important contributions both in field studies and laboratory analysis.
Financial support
This work was supported by the Scientific Research Projects Coordination Unit of Istanbul University. Project number: FBA-2018-29305.
Competing interest
None.