
I. INTRODUCTION
The booming integrated circuit industry puts forward new demands on the quality of tantalum (Ta) sputtering targets. The sputtering rate depends highly on the crystallographic orientation of each grain due to the different density of clustering atoms at different crystal planes, and not the texture concentration but the randomization has favorable effects on the uniformity of films.Reference Michaluk1–Reference Robinson and Southern4 Therefore, randomizing the recrystallization texture of Ta is necessary to improve the sputtering performance of targets. Recrystallization grains originate from the deformation microstructure, and the size, shapes, and orientations of recrystallization grains are related to the morphology and textures of deformed matrices.Reference Humphreys5–Reference Humphreys and Hatherly7 Thus the investigations on deformation microstructure, especially the methods to homogenize the microstructure and randomize the orientations of deformed matrices, are of significant importance.
Our recent work reported that clock rolling can not only homogenize the deformation microstructure but also randomize the recrystallization texture when compared with the unidirectional rolling.Reference Deng, Liu, Fan, Hao, Ji, Zhang and Liu8–Reference Liu, Fan, Deng, Hao, Guo and Liu10 It is of great interest when the clock rolling, in which the specimen is rotated by 135° around the normal direction (ND) between consecutive passes, is taken into consideration and therefore in the present work, the clock-rolled Ta plate was used as the starting material. Furthermore, the clock rolling introduces some regions with relatively random orientations, where new grains with random orientations form upon annealing, which is beneficial to Ta and its products. But, how do these regions occur during rolling and what happened to these regions upon annealing? To answer these questions, the deformation and annealing behavior of the aforementioned regions were interpreted in detail, and the relationship between the recrystallization grains and their surrounding deformed matrices was analyzed comprehensively in this study.
II. EXPERIMENTAL METHOD
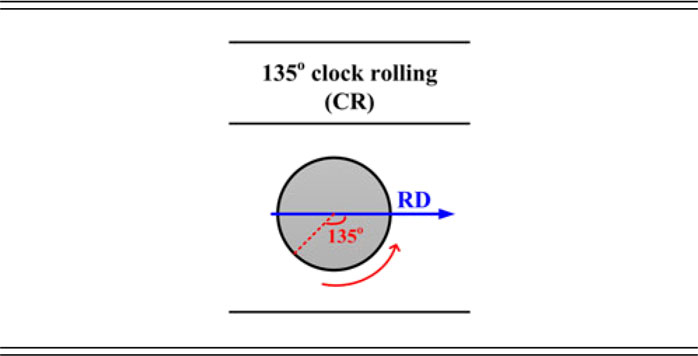
The original Ta (99.95 wt%) plate was fully recrystallized with grain size from 10 to 100 µm. The plate was cold-rolled to 87% thickness reduction (16 rolling passes in total), in which the rolling direction (RD) was sequentially changed by 135° from pass to pass, as shown in the schematic diagram in Table I. The chemical composition and detailed rolling parameters were shown elsewhere.Reference Deng, Liu, Ji, Hao, Zhang and Liu11 Specimens (10L × 8W × 3T mm3) were cut from the as-rolled plate, and a following heat treatment at 1050 °C for 5 min was carried out under inert atmosphere protection. It should be noted that the specimen was introduced to a furnace at 1050 °C directly in this experiment. The longitudinal sections (RD–ND plane) of deformed and annealed samples were characterized on a JEOL JSM-7800F microscope equipped with a fully automated electron backscatter diffraction (EBSD) analysis system (Aztec, Oxford Instruments, Abingdon, United Kingdom). The EBSD data were cleaned up for one time at a clean-up grade of 3 (the full grade is 8) on Channel 5 software (Oxford Instruments, Abingdon, United Kingdom) in this study.
Schematic diagrams of the 135° clock rolling used in this study. The specimen was counterclockwise rotated by 135° around ND between consecutive passes in CR rolling.

III. RESULTS
A. Deformation microstructure
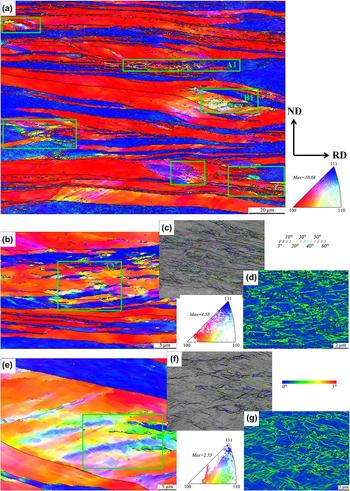
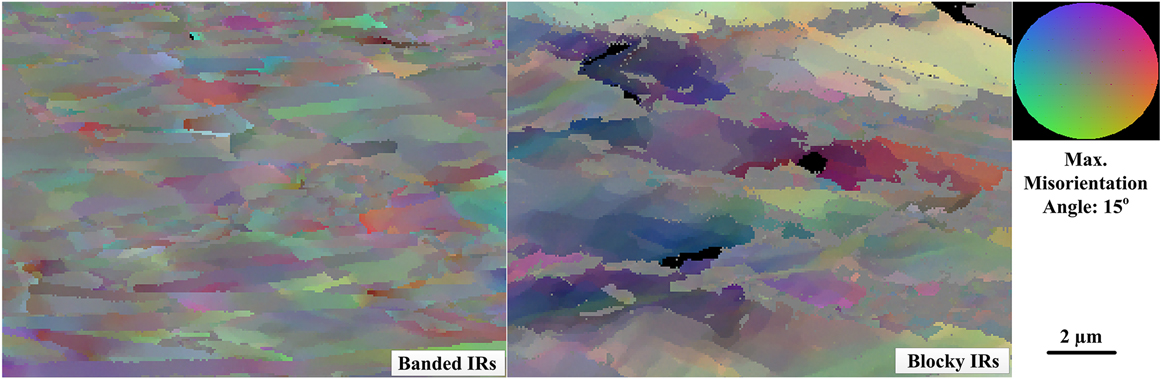
Figure 1 shows the microstructure of 87% cold-rolled Ta. It is obvious that {111}〈uvw〉(〈111〉//ND) and {100}〈uvw〉(〈100〉//ND) are the primary textures, with the volume fraction of 32.3% and 49.5%, respectively. Among these oriented structures, there are regions consisting of interactive grain boundaries which are named as “interactive regions” (IRs), as marked by the rectangular box [Fig. 1(a)]. The results presented in this paper will only be focused on the formation, deformation, and the subsequent nucleation process of these IRs. IRs can be classified into two categories when a further observation is performed. Category one contains alternately arranged {111} and {100}-oriented bands, as shown in Fig. 1(b). These bands are isolated by medium-to-high angle boundaries, whereas boundaries within bands show mostly low-angle misorientations [Fig. 1(c)]. Figure 1(d) represents the concentration of stored energies in these boundaries. The other one is the structure comprised of largely subdivided equiaxed blocks [Fig. 1(e)]. Compared with the high intensity of texture (10.64) in large scale EBSD scan, the texture intensities of IRs are very low in values (4.58 in A2 and 2.55 in B2). Orientations of these IRs, in short, can be classified into “random” orientations. Herein we introduced grain reference orientation deviation–hyper (GROD-Hyper) to investigate the substructures and the corresponding misorientations existing in the interior of IRs. GROD-Hyper represents the deviation between the point and the average orientation of a grain, and the closer to the color in circumference of the circle the color be, the higher the deviation becomes.Reference Liu, Liu, Zhu, Deng, Fan, Cao and Liu9 As shown in Fig. 2, obvious orientation gradients occurred in the substructures in IRs. More specifically, the gradients existing in banded IRs appeared to be parallel to the RD direction while the gradients in blocky IRs appeared to distribute randomly, without preferential direction. Besides, these orientation gradients, to some extent, represent the substructures in the deformed matrices by the change of colors for adjacent substructures. Therefore, IRs contain rich substructures with random orientations, and it is considerably meaningful to investigate what will happen to these regions upon annealing.
Microstructures of clock-rolled Ta specimens. (a) EBSD scan on a large scale, step size 1 µm. (b) Magnification of the region ‘A1’, step size 0.15 µm; (c) and (d) are the corresponding grain boundary map and the local-misorientation map of region ‘A2’, step size 0.06 µm. (e) Magnification of region ‘B1’, step size 0.15 µm; (f) and (g) are the corresponding grain boundary map and local-misorientation map of region ‘B2’, step size 0.06 µm.

GROD-Hyper for banded and blocky IRs.

B. Annealing microstructure
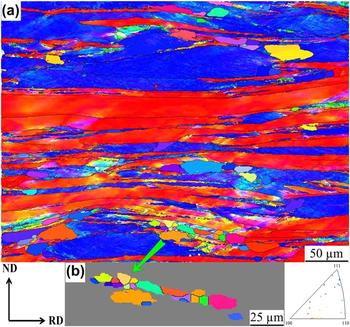
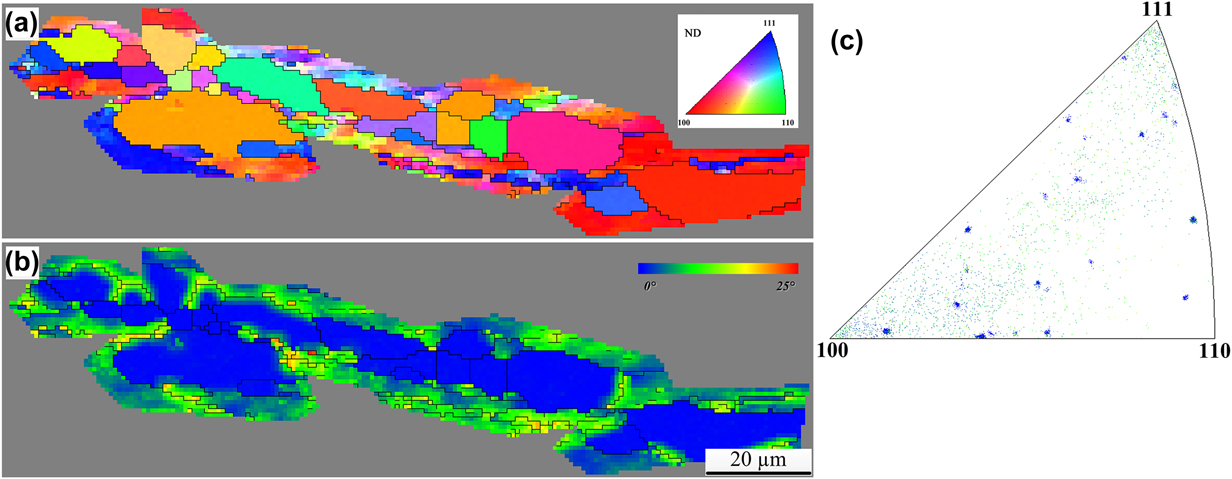
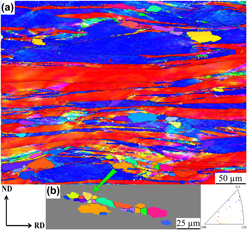
Interestingly, nucleation prefers to occur at IRs, and the shapes of newly formed grains depend strongly on the type of the substructure in IRs. Nuclei appeared to be elongated at banded IRs but equiaxed at blocky IRs. {111}-oriented grains, which is reported to be the preferred place for nucleation in BCC metals,Reference Raabe12,Reference Hutchinson13 are rarely found to form grains in this investigation. More surprising finding is that the nuclei formed in IRs reveal fairly random orientations [Fig. 3(a)]. Additionally, orientations of nuclei formed in IRs distributed randomly, as shown in the inverse pole figure (IPF) for nuclei picked up from the region in Fig. 3(a). Here the nuclei are picked up when the mean misorientation in a cell is in the range of 0–1° and the size of the nuclei is larger than 10 µm.Reference Kim, Kim, Kim and Choi14
Microstructure of the specimen after 5 min annealing at 1050 °C, step size 0.6 µm. (a) Orientation imaging map (OIM) of the specimen and (b) nuclei extracted from the above OIM.

Furthermore, nuclei and their surrounding deformed matrices in Fig. 3(a) were extracted and displayed in Fig. 4. Figure 4(b) is the local-misorientation map for this region, in which the blue color means low local-misorientation while red means high misorientation. Most of the work in deforming a metal is run off as heat and only few amount (∼1%) strain remains in the material.Reference Raabe, Laughlin and Homo6,Reference Humphreys and Hatherly7 Residual strain manifests as local variation in lattice orientations as dislocation forms. Then local-misorientation provides an indication of the strain distribution in a region, based on the fact that each point in the EBSD scan has its own individual value of local-misorientation,Reference Wright, Nowell and Field15 and this technique approaches to high-resolution microscopes. To interpret the relationship between the nuclei and their surrounding deformed matrices more intuitively, the IPF was plotted combined with the local-misorientation data, as shown in Fig. 4(c). It can be seen that the orientations of most nuclei are similar to the orientations of surrounding deformed matrices, or more accurately, are similar to the points which contain higher value of local-misorientation. To be more accurate, it should be noted here that we predicated that the dispersed orientation from deformed areas is spatially associated with the nuclei by the detection of the local-misorientation map and its corresponding IPF manually, accompanied with many point-to-point tests before the quantitative investigation (following part).
Relationship between the orientations of grains and surrounding deformed matrices after annealing at 1050 °C for 5 min. (a) OIM for the grains. (b) Local-misorientation map for the grains. (c) IPF for regions in (b).

C. Misorientation between nuclei and deformed matrices
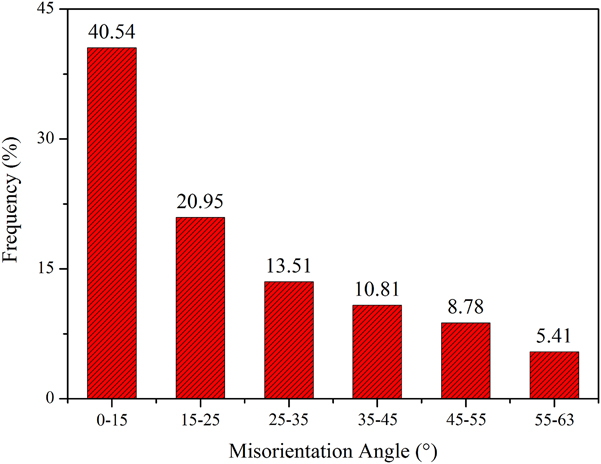
To quantitatively investigate the misorientation relationship between the nuclei and the adjacent deformed matrices with high local misorientation, orientations for 151 pairs of nuclei and their surrounding deformed matrices were picked up from a large scale of scanning. The distribution of misorientation axes and angles is shown in Fig. 5. The misorientation axes between the nuclei and the surrounding deformed matrices seem to distribute randomly, without specific preferential clusters or aggregates. However, most nuclei appeared to have a preferential range of misorientation angles, 0–25° with their surrounding matrices containing large local misorientations. Figure 6 represents the frequency of the misorientation angles for the 151 pair data calculated by Aztec software, regardless of the misorientation axes. We can conclude that the misorientation angles between nuclei and their surrounding deformed matrices show a much higher frequency in the range of 0–25°, especially 0–15°, which is in good agreement with the fact that the orientation of the nucleus is similar to the surrounding points containing higher local misorientations.
Distribution of misorientation angles and axes between nuclei and surrounding deformed matrices after annealing at 1050 °C for 5 min.

Misorientation angle distribution between nuclei and surrounding deformed matrices after annealing at 1050 °C for 5 min.

IV. DISCUSSION
A. Origin of IR
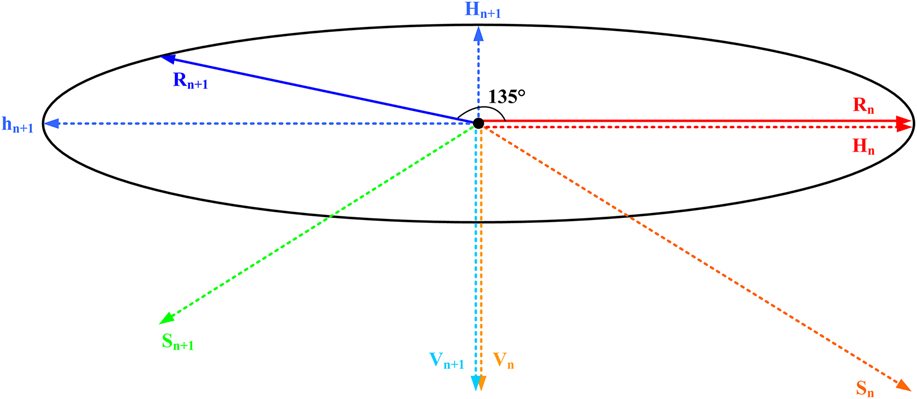
Clock rolling, in which the RD sequentially changes by 135° about the ND between adjacent passes, is an effective way to homogenize the deformation microstructures.Reference Liu, Liu, Zhu, Deng, Fan, Cao and Liu9,Reference Liu, Fan, Deng, Hao, Guo and Liu10,Reference Fan, Liu, Li, Deng and Liu16 As shown in Fig. 7, the directions of two adjacent rolling passes are represented by R n and R n+1, respectively. In the n + 1 pass of rolling, the force component in horizontal directions (h n+1) decomposed from R n+1 is antiparallel to the component in horizontal direction H n decomposed from R n, which would result in the annihilation of dislocations with opposite dislocations formed in these two passes. Further than this, the other horizontal force component H n+1 from R n+1 is perpendicular to the component H n from R n. Moreover, the resultant (shear) forces S n from R n and S n+1 from R n+1 also have different orientations with each other. These force components lead to the elongation of original grains along RD and the serious subdivision of these grains.Reference Liu, Liu, Zhu, Deng, Fan, Cao and Liu9
Schematic diagram of mechanic distribution as rolling path changes. H n means horizontal force component of R n rolling; H n+1 and h n+1 mean horizontal force components of R n+1 rolling; V n and V n+1 mean vertical force components of R n and R n+1, respectively; S n and S n+1 mean shear force components of R n and R n+1, respectively.

The intersection between grains causes further subdivision of grain boundaries into fragments.Reference Vandermeer and Snyder17 Especially, the terminations of the adjacent grains, where the stress concentration is easily generated in, are more seriously split and intertwined together.Reference Hagihara, Yamasaki, Honnami, Izuno, Tane, Nakano and Kawamura18 The subdivided fragments rotate at terminations to accommodate the stress concentration, thus the orientations in these regions tend to be more random when compared with other districts. In particular, the serious deformation of these regions leads to the formation of large amounts of substructures with dispersive orientations in their interior. Thus, obvious orientation gradients occurred in these substructures in both banded and blocky IRs.
B. Annealing behavior of IR
1. Nucleation mechanisms for IR
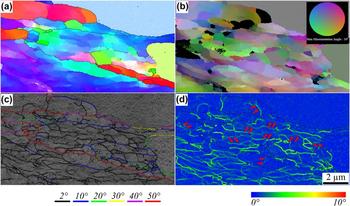
IRs, regions which experienced serious split and contain rich substructures, are the preferred sites for nucleation upon annealing. As reported, it is the mechanism of subgrain coarsening or coalescence that dominates the nucleation process at low temperature in Ta.Reference Rez-Prado, Hines and Vecchio19 The coarseness of subgrains is performed by the migration of boundaries, while the coalescence is realized by the rotation and coalescence of substructures to form one larger subgrain.Reference Rez-Prado, Hines and Vecchio19,Reference Radhakrishnan and Sarma20 The local orientation gradients, which exist in substructures as represented by GROD-Hyper, are necessary for the growth of subgrains to transform into effective nuclei.Reference Raabe, Laughlin and Homo6 Both the coarseness and the coalescence mechanisms are associated with the evolution of substructure boundaries, and the driving force comes from the reduction in boundary energy.Reference Humphreys and Hatherly7 As shown in Figs. 1(d) and 1(g), large numbers of dislocations kinked at IRs, implying the stress concentration and the large amount of stored energies. These energies will drive the substructures to rotate to coalesce into effective nuclei during annealing.Reference Raabe, Laughlin and Homo6 Figure 8(a) shows an IR with random orientations. After annealing for 5 min, substructures rotated and their boundaries tend to fade out to do a favor for the coalescence, as shown by the red arrows in Fig. 8(c), and several nuclei with high-angle misorientation with surrounding deformed matrix had formed in the IR [Fig. 8(b)]. It must be kept in mind, however, that the orientations of the fragments are similar to the orientations of the surrounding deformed matrices, and the coalescence always occurs among substructures with similar orientations.
Nucleation of substructures after annealing at 1050 °C for 5 min, step size 0.04 µm. (a) OIM of the region, (b) GROD-Hyper map, the max misorientation angle is 10°, (c) grain boundary map, and (d) local misorientation map.

Furthermore, the orientation difference between the nuclei and the deformed matrix can be characterized quantitatively with the aid of Channel 5 software. The IPF in Fig. 4 implies the relationship between the orientations of newly formed grains and their surrounding deformed matrices. Deformed regions oriented randomly form nuclei with random orientations. More accurately, we extracted 151 pairs of nuclei/matrices data to investigate the misorientation relationship. The results suggest that most nuclei appear to have a preferential range of misorientation angles, 0–15°, with their surrounding matrices. It is to be mentioned that the points representing the orientations of deformed matrices are picked up from the regions containing high local-misorientations. The high local-misorientation means the serious deformation or subdivision in these regions, to some extent, representing the high energy stored in these regions. For body-centered cubic metals, grains with {111} orientations always experienced inhomogeneous deformation and accommodate large amounts of stored energy during plastic deformation.Reference Raabe12,Reference Fan, Liu, Li, Deng and Liu16,Reference Deng, Liu, Hao, Ji, Zhang and Liu21
2. Energy stored in the IR
The stored energy, which exists as lattice defects like dislocations or substructures, would significantly influence the pattern quality.Reference Wilkinson and Dingley22 Therefore, the pattern quality, which was determined by detecting the gray levels during the EBSD scanning, can be used to evaluate the energy stored in deformed matrices.Reference Choi and Jin23 The energy S i is proportional to the pattern quality index H i as shown in the following relationReference Choi and Jin23:
 $${S_i} \propto {H_i} = 10\left[ {1 - {{{Q_i}\left( {{g_i}} \right) - {Q_{\min }}} \over {{Q_{\max }} - {Q_{\min }}}}} \right]\quad ,$$
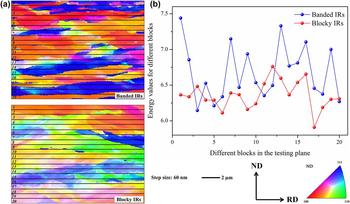
in which, S i is stored energy for orientation ‘i’, H i is the pattern index, g i, Q min, and Q max are the minimum and maximum pattern qualities of the aggregate, respectively. Furthermore, we try to evaluate stored energy in different regions in IRs based on this measurement. The banded and blocky IRs were subdivided into 20 blocks, respectively, as shown in Fig. 9. The energy value for each block was evaluated and connected into a line. Energy values fluctuate significantly through the thickness of the testing region in banded IRs. More accurately, the value came to be very large when the test was carried out on regions with {111} orientations or closer to {111}, such as regions 2, 14, or 19. The tendency is not obvious in blocky IRs since the interaction between {111} and {100}-oriented regions appeared in a complicated way, not the bands parallel to the testing region but the blocks interacted with each other.
Values of stored energy for different blocks in banded and blocky IRs. OIMs for banded and blocky IRs (a) and energy value map (b).

The larger values of stored energy represent the more serious subdivision of the region, and so introduce more sites for the subsequent nucleation. These sites show high priorities to rotate and coalesce into effective nucleus upon annealing.Reference Raabe12,Reference Hutchinson13,Reference Choi24 It should be stressed, however, that although the rotation makes it possible to form new grains in the deformed matrices, the rotation itself is limited by the dislocations or boundaries with less mobility. In other words, the points with low energy hinder the coalescence of rotating substructures upon annealing, and the coalescence process has to pioneer a new route to realize the coalescence with points containing high energy. On the way to coalescence, their orientations came closer, and the nuclei came to be randomly oriented.
3. Shape of new grains
The shape of the nuclei, as shown in Fig. 3, is significantly influenced by the sites where they formed. As mentioned, there are banded and blocky substructures in IRs. Banded structures mainly consist of alternately arranged {111} and {100}-oriented deformed matrices. {111}-oriented grains are consumed first due to the higher stored energy, while the {100} tends to be intruded later. The nuclei formed in the banded {111} matrices grow up along the narrow space stacked by the {100} matrices. Then grains in banded IRs inclined to be elongated shapes. While in blocky IRs, fragments have advantages in size to serve as the nuclei, and the energies around them are more homogeneously distributed. Thus, the shape of the grain tends to be equiaxial in these blocky IRs. In conclusion, the shape of nuclei is related to the sites where they formed, which can be attributed to the great differences in stored energies between {111} and {100}-oriented deformation matrices.
V. CONCLUSIONS
Substructure and the subsequent nucleation behavior of IRs in clock-rolled Ta were investigated. Orientations of newly formed grains and their relationships with the deformed matrices in which the new grains formed were characterized and analyzed. It can be concluded that the following:
(1) The differences of strain directions of adjacent rolling paths lead to the serious rotation of substructures at the termination of original grains. Thus IR which contains random orientations in deformed matrices is formed upon rolling.
(2) The IRs can be further divided into banded IRs and blocky IRs. Accurately, the gradients existing in banded IRs appeared to be parallel to the RD direction, while the gradients in blocky IRs appeared to distribute randomly. Additionally, the stored energy fluctuates significantly through the thickness of banded IRs due to the large difference of energy between the {111} and {100} orientations, while the distribution is more homogeneous in blocky IRs.
(3) Orientations of newly formed grains are close to the surrounding points with higher local-misorientation. These points are loaded with rich sites and energies for nucleation, and the rotation angle for the substructure is limited upon annealing, thus the orientations of the nucleus and these points are very similar. More accurately, most nuclei are 0–15° with their surrounding matrices.
ACKNOWLEDGMENTS
The present work was co-supported by the National Natural Science Foundation of China (Grants Nos. 51421001 and 51701032), the Major National Science and Technology Projects of China (No. 2011ZX02705), and the Chongqing Science and Technology Commission in China (CSTC, 2017jcyjAX0094).