Introduction
Patients with anorexia nervosa (AN) seem to have an elevated ability to resist temptations and immediate rewards (food) in pursuit of long-term goals (slim figure). This everyday clinical observation suggests that an unusual level of self-control might contribute to the maintenance of an extremely low body weight. In the current study we aimed to capture abnormal self-control in AN within the delay-discounting dilemma, often referred to as the concept of intertemporal choices, by assessing the degree to which delayed monetary rewards are (not) discounted.
The delay-discounting paradigm has a long tradition in the fields of behavioral economics and decision making research (Critchfield & Kollins, Reference Critchfield and Kollins2001; Green & Myerson, Reference Green and Myerson2004) and has become increasingly popular in the cognitive neurosciences (Scheres et al. Reference Scheres, de Water and Mies2013). A range of experimental designs has been developed to investigate temporal discounting but all basically require participants to choose between a smaller reward that can be received immediately and a larger reward that can only be received after a certain period of time. The ability to delay a supplied reward is generally operationalized as a measure of impulsivity, that is as a lack of self-control (Crean et al. Reference Crean, de Wit and Richards2000; Kirby, Reference Kirby2009). In a predictable environment, individuals tending to choose a sooner but smaller reward are described as impulsive whereas those choosing a larger but delayed reward may be described as self-controlled (Logue, Reference Logue1988; Critchfield & Kollins, Reference Critchfield and Kollins2001; Robbins et al. Reference Robbins T, Cardinal R, DiCiano, Halligan, Hellemans, Lee and Everitt2005). Research in clinical populations indicates steeper discounting of delayed rewards to be associated with different disorders with impulse control difficulties, such as gambling and drug abuse (e.g. review by Reynolds, Reference Reynolds2006), attention deficit hyperactivity disorder (ADHD; Demurie et al. Reference Demurie, Roeyers, Baeyens and Sonuga-Barke2012) or obesity (Weller et al. Reference Weller, Cook, Avsar and Cox2008). Moreover, acute effects of drugs such as nicotine (Kobiella et al. Reference Kobiella, Ripke, Kroemer, Vollmert, Vollstädt-Klein, Ulshöfer and Smolka2014) or decreased serotonergic neurotransmission (Schweighofer et al. Reference Schweighofer, Bertin, Shishida, Okamoto, Tanaka, Yamawaki and Doya2008) increase the temporal discounting rate (i.e. increased discounting of delayed rewards).
To date, only one study has investigated delay discounting in patients with AN, finding less discounting of future rewards in adult acute AN patients compared to healthy controls (Steinglass et al. Reference Steinglass, Figner, Berkowitz, Simpson, Weber and Walsh2012). However, there is no definite proof of the relationship between delay discounting and AN. To disentangle the effects of acute undernutrition and potentially more stable vulnerability markers, the current study aimed to examine self-control, using the delay-discounting dilemma, both in acute AN and in a sample of weight-recovered AN patients. In addition, we reassessed the majority of acute AN patients after short-term weight gain.
Method
Participants
The sample in the current study consisted of a total of 124 female volunteers: 35 patients with acute AN according to DSM-IV (acAN; 12–23 years old), 34 successfully recovered former AN patients (recAN; 15–29 years old) and 54 healthy controls (HCs; 12–29 years old). Additionally, 21 of the acAN (acAN-T1) were reassessed following short-term/partial weight restoration [increase of ⩾10% body mass index (BMI); acAN-T2]. The study was approved by the local Institutional Review Board and all participants (or if underage, their guardians) gave written informed consent.
All acAN patients were admitted to eating disorder programs of a university child and adolescent psychiatry and psychosomatic medicine department and were assessed within 96 h of the start of a behaviorally oriented nutritional rehabilitation program. Within the acAN group, 31 (91.2%) of the patients were of the restrictive and three (8.8%) the binge/purge subtype (one acAN could not be clearly categorized); 9.1% had co-morbid psychiatric disorders (6.1% depressive disorders including dysthymia, 2.9% anxiety disorder and 2.9% obsessive–compulsive disorder). To be considered ‘recovered’, recAN subjects had to have (1) maintained a BMI > 18.5 kg/m2 (if > 18 years old) or a BMI > 10th BMI percentile (if < 18 years old) for at least 6 months prior to the study, (2) menstruated and (3) not binged, purged or engaged in significant restrictive eating patterns. Within the recAN group, 24 (70.6%) were of the restrictive and nine (26.5%) the binge/purge subtype (one recAN could not be clearly categorized); 27.3% of the participants had associated psychiatric co-morbidity at the time of treatment (24.2% depressive disorders including dysthymia, 3.0% obsessive–compulsive disorder). To be included in the HC group, participants had to be of normal weight and eumenorrheic. HCs were recruited through advertisement among middle school, high school and university students.
Exclusion criteria and possible confounding variables, including use of psychotropic medication, binge eating or diagnosis of bulimia nervosa, were obtained using the Structured Interview for Anorexia and Bulimia Nervosa (SIAB; Fichter & Quadflieg, Reference Fichter and Quadflieg1999), medical records and our own semi-structured research interview. Co-morbid psychiatric diagnoses other than eating disorders were derived from medical records.
HC participants were excluded if they had any history of psychiatric illness, a lifetime BMI below the 10th BMI percentile (if younger than 18 years)/BMI below 18.5 kg/m2 (if older than 18 years) or were currently obese (BMI not over the 97th BMI percentile if younger than 18 years/BMI not over 30 kg/m2 if older than 18 years). Participants in all study groups were excluded if they had a lifetime history of any of the following clinical diagnoses: organic brain syndrome, schizophrenia, substance dependence, psychosis not otherwise specified (NOS), bipolar disorder, bulimia nervosa or binge-eating disorder (or ‘regular’ binge eating, defined as bingeing at least once weekly for ≥3 consecutive months). Further exclusion criteria for all participants were IQ below 85; psychotropic medication within 4 weeks prior to the study; current substance abuse; current inflammatory, neurological or metabolic illness; chronic medical or neurological illness that could affect appetite, eating behavior or body weight (e.g. diabetes); clinically relevant anemia; pregnancy; breastfeeding.
Study data were collected and managed using secure, web-based electronic data capture tool REDCap (Research Electronic Data Capture; Harris et al. Reference Harris, Taylor, Thielke, Payne, Gonzalez and Conde2009).
Clinical measures
For all participants, current and/or past diagnoses of eating disorders were ascertained by evaluation of the expert form of the SIAB (SIAB-EX; Fichter & Quadflieg, Reference Fichter and Quadflieg1999), a well-validated 87-item semi-standardized interview that assesses the prevalence and severity of specific eating-related psychopathology over the past 3 months. The interview provides diagnoses according to ICD-10 and DSM-IV. Interviews were conducted by clinically experienced and trained research assistants under the supervision of the attending child and adolescent psychiatrist. Eating disorder-specific psychopathology was assessed with the short version of the Eating Disorder Inventory (EDI-2; Paul & Thiel, Reference Paul and Thiel2005), a self-report comprising eight subscales. The three core subscales ‘drive for thinness’, ‘body dissatisfaction’ and ‘bulimia’ were part of the confirmatory analyses in this study. Depressive symptoms were examined using the German version of the Beck Depression Inventory (BDI-2; Hautzinger et al. Reference Hautzinger, Keller and Kühner2009). Personality dimensions were assessed using the German version of the Junior Temperament and Character Inventory (JTCI; Goth & Schmeck, Reference Goth and Schmeck2009), which is based on Cloninger's biosocial model of personality (Cloninger, Reference Cloninger1994). Of interest for our current study were the impulsivity subscale of the temperament dimension novelty seeking and the temperament dimension persistence. Intelligence quotient (IQ) was measured with a short version (including the subtests: picture completion, digit symbol coding, similarities and arithmetic) of the German adaptation of the Wechsler Adult Intelligence Scale (WIE; Von Aster et al. Reference Von Aster, Neubauer and Horn2006) for participants aged ≥16 years or a short version (including the subtests: vocabulary, letter–number sequencing, matrix reasoning and symbol search) of the German adaptation of the Wechsler Intelligence Scale for Children (HAWIK; Petermann & Daseking, Reference Petermann and Daseking2009) for participants aged ≤15 years. A proxy measure for socio-economic status was determined using the parents’ educational level (Patrick et al. Reference Patrick, Norman, Calfas, Sallis, Zabinski, Rupp and Cella2004). We used the BMI standard deviation (s.d.) score instead of BMI for statistical analysis because the former provides an index of weight to height ratio that is corrected for age and gender (Kromeyer-Hauschild et al. Reference Kromeyer-Hauschild, Wabitsch, Kunze, Geller, Geiß, Hesse, von Hippel, Jaeger, Johnsen, Korte, Menner, Müller, Müller, Niemann-Pilatus, Remer, Schaefer, Wittchen, Zabransky, Zellner, Ziegler and Hebebrand2001; Hemmelmann et al. Reference Hemmelmann, Brose, Vens, Hebebrand and Ziegler2010).
Task
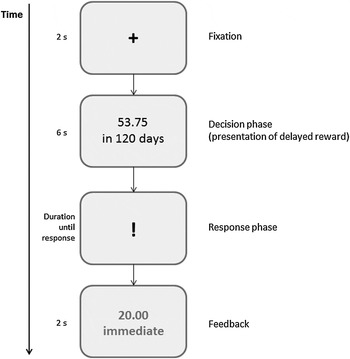
We used the intertemporal choice task (Fig. 1) introduced by Ripke et al. (Reference Ripke, Hübner, Mennigen, Müller, Rodehacke, Schmidt, Jacob and Smolka2012) to investigate the behavioral correlates of value-based decision making in AN. Task presentation and behavioral response recording were carried out with Presentation software version 16.1 (Neurobehavioral Systems, 2012; www.neurobs.com). The primary variable of interest was the individual discount rate for delayed rewards (k), which indicates the degree at which an individual prefers a fixed immediate reward to a relative higher future reward. Higher k values indicate increased delay discounting, that is more impulsive and less self-controlled behavior.
Time course of each of the 50 trials. A fixation cross was displayed for 2 s at the beginning of each trial. This fixation phase was followed by the presentation of amount and delay of the later reward and an exclamation mark. The latter was displayed on screen until the participant responded (left button press for later reward, right button press for immediate reward). At the end of each trial a feedback about the chosen reward was displayed for 2 s.

In each of the 50 trials, participants chose between a small immediate or larger delayed monetary reward (e.g. 20€ now versus 42€ in 30 days). Participants were informed that the immediate reward would be 20€ in each trial. In a given trial, only the amount (at least 20.04€ after choosing the immediate reward in each trial of one delay or at most 788.87€ after choosing the later reward in each trial of one delay) and delay of the later reward (10, 30, 60, 120 or 180 days) were displayed. Participants indicated their choice with a left button press for the later reward or a right button press for the immediate reward. Feedback indicating the amount and delay chosen was presented immediately after each response. Delay periods were presented in blocks of 10 trials per delay. After 10 trials, the delay changed for the next 10 decisions. The experimental design was adaptive based on the subject's decision in the previous trial. Specifically, if the immediate amount was chosen, the delayed amount increased by half the difference between the immediate and delayed rewards in the next trial and if the delayed amount was chosen, it decreased by half the difference between both rewards in the next trial. The first three trials (used as practice trials) were discarded from further analysis and were not used to calculate k.
Based on the choices, we calculated k for each participant. To this end, we estimated the indifference amount for each of the five delays, that is the mean of the maximum delayed amount rejected and the minimum delayed amount chosen. The indifference amount is represented by A in the hyperbolic function:
 $$V = \displaystyle{A \over {1 + (k \times D)}}$$
where V represents the subjective value of the immediate reward (i.e. 20€) and D the delay in days for the later reward. The parameter k was estimated to best fit the hyperbolic function consisting of five points (one for each delay) using ordinary least squares. This method was chosen because previous studies have shown a hyperbolic function to provide the best fit for temporal discounting data (Mazur, Reference Mazur, Commons, Mazur, Nevin and Rachlin1987; Kirby & Maraković, Reference Kirby and Maraković1995; Simpson & Vuchinich, Reference Simpson and Vuchinich2000).
To explore the quality of participants’ value-based decision making, we also investigated the consistency at which they tended to choose the reward alternative with the higher subjective value. As in Ripke et al. (Reference Ripke, Hübner, Mennigen, Müller, Rodehacke, Schmidt, Jacob and Smolka2012), we ran a receiver operating characteristics (ROC) curve analysis to compute a parameter for decision consistency, with subjective value of the delayed reward as predictor for the respective choice. We computed the area under the curve (AUC) as a consistency parameter for each participant, which was higher for more consistent behavior (i.e. always choosing the reward with the higher subjective value results in an AUC of 1, complete random choices would yield an AUC of 0.5). Three subjects were excluded given implausible AUC values below 0.5 (one acAN, one recAN, one HC), because this indicates discounting of the smaller sooner reward by almost exclusively choosing the delayed reward irrespective of the delay period and the amount of reward.
To further ensure the quality of our data, we identified all ‘illogical’ choices [trials with a decision for the later reward with a subjective value lower than half of the alternative immediate reward (e.g. 20€ now versus 40€ later when the delayed reward equals a subjective value of 9.52€ given the delay period and the overall k value of the participant) and trials with a decision for the sooner reward when the subjective value of the delayed reward had a subjective value higher than twice as much as the immediate reward (e.g. 20€ now versus 361.72€ later when the delayed reward equals a subjective value of 111€ given the delay period and the overall k value of the participant)] and recalculated k after exclusion of those trials (< 1% of all trials; 20 subjects were identified comprising between one and maximum six illogical trials). After exclusion of those trials, we recalculated k values for those subjects. Recalculated k values did not differ significantly from the original data (see Table S1 in the online Supplementary material). All following analyses were performed with the adjusted k values. In addition, we applied log transformation because of non-normality of k values.
Statistical analyses
Histograms, box plots, normal probability plots and Levene statistics were used to verify the underlying statistical assumptions. Delayed discounting was compared in a cross-sectional design (HC v. acAN v. recAN) and a longitudinal design (acAN-T1 v. acAN-T2). Cross-sectionally, we tested for group differences in self-control (as expressed in k) and consistency (as expressed in AUC) using an analysis of covariance (ANCOVA) with age and age squared (to control for a probable non-linear effect of age) as covariates. Age is known to influence k values (e.g. Green et al. Reference Green, Myerson and Ostaszewski1999; Steinberg et al. Reference Steinberg, Graham, O'Brien, Woolard, Cauffman and Banich2009). Therefore, we also used an automated pairwise matching algorithm in SPSS (Fuzzy) to match the subject groups for age (matching pairs of acAN and HC with a maximal age difference of 1.0 years and recAN–HC pairs with a maximal age difference of 2.0 years), resulting in two matched subsamples each with a smaller sample size (n acAN = 28 v. n HC = 28; n recAN = 31 v. n HC = 31). Subsequently, the ANCOVA (without age as a covariate) was rerun. If appropriate, Scheffé post-hoc tests were conducted.
For the longitudinal data, paired-samples t tests were used to explore group differences for both parameters.
Correlations were calculated using Pearson correlation coefficients. All tests were performed with SPSS statistical software version 21.0 (IBM Corp., 2012). Graphs were generated using R software for statistical computing (R Core Team, 2012).
Results
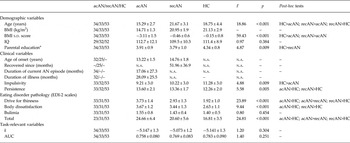
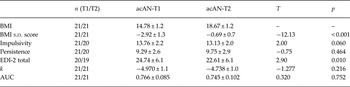
First we explored our data for differences in key demographic and clinical variables (BMI s.d. score, IQ and age; Table 1). As expected, acAN in the cross-sectional sample had a lower BMI than both recAN and HC whereas the latter two groups did not differ. The (unmatched) groups differed in age (with recAN being older than acAN and HC being older than acAN) and parental education (HC higher than recAN) but not in IQ. EDI-2 sum scores were highest in acAN. Both acAN and recAN also had higher scores on the JTCI persistence scale whereas JTCI impulsivity scale scores were higher for HC than acAN. As expected in the longitudinal sample, acAN-T1 had a lower BMI and higher EDI-2 scores than acAN-T2 (Table 2). The JTCI persistence and impulsivity scales did not differ across time points.
Cross-sectional sample: descriptive statistics, results of the one-way ANCOVA and of Scheffé post-hoc tests (p < 0.05)

acAN, Acute anorexia nervosa patients; recAN, recovered AN patients; HC, healthy controls; BMI, body mass index; s.d., standard deviation; IQ, intelligence quotient; EDI-2, Eating Disorder Inventory; k, discount rate for delayed rewards (logarithmized); AUC, area under the curve (consistency measure of discount rates).
a Parental education ranges from 0 (leaving school without graduation) to 5 (graduation from university) according to the German educational system; if the participant grew up with both parents in the same household, the estimate was based on the parent with the higher educational level;
Values are given as mean ± standard deviation.
Longitudinal sample: descriptive statistics and results of paired t tests

acAN-T1/acAN-T2, Acute anorexia nervosa patients at first/second time point; BMI, body mass index; s.d., standard deviation; EDI-2, Eating Disorder Inventory; k, discount rate for delayed rewards (logarithmized); AUC, area under the curve (consistency measure of discount rates).
Values are given as mean ± standard deviation.
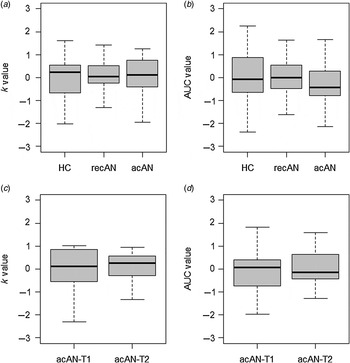
Comparing k values for the three cross-sectional groups, a significant effect of age (F 3,112 = 5.615, p = 0.019, β = −0.613) and age squared (F 3,112 = 4.610, p = 0.034, β = 0.014) emerged, but no group differences were detected (F 3,112 = 1.202, p = 0.304; Fig. 2 a, Table 1). The estimated statistical power of our analysis was 81% (see online Supplementary material). Additional analyses limited to either the restrictive AN subtype or the binge-purge subtype also failed to reveal any group differences (see online Supplementary Table S2).
(a) Mean logarithmized and z-standardized k values and (b) z-standardized area under the curve (AUC) values for the cross-sectional sample of patients with acute anorexia nervosa (acAN), recovered AN patients (recAN) and healthy controls (HC). (c) Mean logarithmized and z-standardized k values and (d) z-standardized AUC values of the longitudinal sample, where acAN-T1/acAN-T2 are acAN patients at first/second time points.

The results thus far indicated that, in general, the groups did not differ in how they made decisions about delayed rewards. To test for group differences in the consistency in which those decisions were made, we next compared group mean AUC values. However, again no differences were revealed (F 3,112 = 1.400, p = 0.251; Fig. 2 b, Table 1). To control for potentially confounding developmental effects, we conducted an analog analysis using subsamples closely (pairwise) matched by age. Despite consistency with our earlier results, no group differences were seen (see Supplementary Table S3). Consistent with previous research (e.g. Kirby & Maraković, Reference Kirby and Maraković1995; Steinberg et al. Reference Steinberg, Graham, O'Brien, Woolard, Cauffman and Banich2009), the hyperbolic model that we used to estimate k showed an excellent fit to the data; non-linear regression analysis resulted in R 2 values of 0.985 across all groups, and groups did not differ in R 2 (HC: R 2 = 0.991; recAN: R 2 = 0.987; acAN: R 2 = 0.987; acAN-T2: R 2 = 0.975).
These results suggest that acAN patients discount monetary reward in a similar manner to HCs but are not informative as to whether this behavior changes over the course of recovery in AN. To address this question, we compared the k and AUC values measured at the beginning of therapy (acAN-T1) with those measured after short-term weight restoration (acAN-T2; longitudinal sample; Fig. 2 c,d). No differences for either measure were found (k value: T 20 = −1.277, p = 0.216; AUC value: T 20 = 0.320, p = 0.752). However, illustrating the stability of the parameter, we uncovered a significant positive relationship between k values at T1 and T2 (r = 0.539, p = 0.012) and a high test–retest reliability (Cronbach's α = 0.817).
Ripke et al. (Reference Ripke, Hübner, Mennigen, Müller, Rodehacke, Schmidt, Jacob and Smolka2012) showed that impulsivity could be successfully measured with the paradigm used. To validate their findings, we tested the relationship of k with external parameters of self-control. To this end, we explored the correlation between individual k values and scores on the impulsivity subscale of the JTCI in HCs. As expected, there was a positive relationship (r = 0.348, p = 0.011). This correlation remained robust even after adjusting statistically for the effects of age and age squared (r = 0.331, p = 0.018).
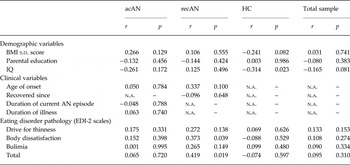
To test whether temporal decision making might be related to crucial variables regarding clinical and demographic status, we also explored correlations between k values and (1) BMI s.d. score, (2) IQ, (3) parental education, (4) age of onset of AN, (5) duration of current AN episode, (6) duration of illness and (7) the amount of time passed since weight recovery in recAN (Table 3; correlations for AUC values are shown in Table S4 in the online Supplementary material). However, no relationships were found between any of these variables and delay-discounting behavior except for IQ in HCs. Finally, we also conducted analyses to explore correlations of k values and eating disorder psychopathology (EDI-2 core subscales and EDI-2 total score, Table 3; correlations for AUC values are shown in Supplementary Table S4). Positive correlations with k value were found in the recAN group for the EDI-2 subscale body dissatisfaction and the total EDI-2 score. However, these results survived corrections for multiple comparisons (Bonferroni).
Correlations of k values with demographic and clinical status variables and eating disorder pathology for acAN, recAN and HC (Pearson's r and p values)

acAN, Acute anorexia nervosa patients; recAN, recovered AN patients; HC, healthy controls; BMI, body mass index; s.d., standard deviation score; IQ, intelligence quotient; EDI-2, Eating Disorder Inventory; n.a., not applicable.
Discussion
We used an established intertemporal choice task (Ripke et al. Reference Ripke, Hübner, Mennigen, Müller, Rodehacke, Schmidt, Jacob and Smolka2012) to examine self-control and value-based decision making in AN, in both a cross-sectional design including acute and recovered AN individuals and a longitudinal design (before and after short-term weight gain). Based on the observation of an unusually elevated level of self-control in AN (e.g. Casper, Reference Casper1990; Casper et al. Reference Casper, Hedeker and McClough1992; Butler & Montgomery, Reference Butler and Montgomery2005), we predicted decreased delay discounting in both acAN and recAN relative to HCs. However, contrary to this hypothesis and previous findings in adult acAN patients (Steinglass et al. Reference Steinglass, Figner, Berkowitz, Simpson, Weber and Walsh2012), we found no differences in delay discounting between any of the groups investigated. Previous studies (Zhang & Rashad, Reference Zhang and Rashad2008; Jarmolowicz et al. Reference Jarmolowicz, Cherry, Reed, Bruce, Crespi, Lusk and Bruce2014) found a positive relationship between delay discounting and body mass in overweight and obese participants. However, in the current sample no relationships between delay discounting rate and BMI s.d. score and other important variables of clinical status (age of onset, duration of illness and length of recovery) were found. Taken together, these findings obtained in the context of monetary rewards suggest that AN is not characterized by generally aberrant value-based decision making and support the view that altered self-control in the disorder might be limited to disorder-relevant reinforcers (e.g. food, body appearance; e.g. Butow et al. Reference Butow, Beumont and Touyz1993; Wolff & Serpell, Reference Wolff, Serpell, Hoek, Treasure and Katzman1998).
To the best of our knowledge, this is the first study to investigate delay discounting in recAN patients and in a longitudinal sample of acAN patients. This design allows us to gain insight into potential differences regarding the effects of short- and long-term weight gain on delay-discounting behavior in AN patients.
Differences between our results and the only other study regarding delay discounting in AN (Steinglass et al. Reference Steinglass, Figner, Berkowitz, Simpson, Weber and Walsh2012), which found decreased delay discounting in acAN (only in the subgroup of AN with the restrictive subtype), may be explained by several variables. Acute patients in the Steinglass et al. study were on average 10 years older than in our acute sample, implying chronic illness given that the median age of onset of AN is currently 12.3 years (Swanson et al. Reference Swanson, Crow, Le Grange, Swendsen and Merikangas2011). Even though we could not find a correlation between the discounting factor and duration of illness in our predominantly adolescent sample, such a relationship may exist in chronic patients. Therefore, it cannot be excluded that decreased delay discounting in the Steinglass study was an effect of prolonged undernutrition or multiple relapses. Another major difference lies in the distinct methodologies used to assess delay discounting. Whereas the sample by Steinglass and colleagues was tested with an intertemporal titration procedure (cf. Weber et al. Reference Weber, Johnson, Milch, Chang, Brodscholl and Goldstein2007), our current study used a well-fitting hyperbolic function based on a large number of adaptive choices to estimate an individual value indicating delay discounting. The linear sequence used by Steinglass et al. (Reference Steinglass, Figner, Berkowitz, Simpson, Weber and Walsh2012) bears the danger of anchoring (as it is based on regularly increasing rewards; Loewenstein, Reference Loewenstein1988) and relies on very few data points (2 × 13 fixed intervals/rewards). By contrast, we calculated k for each of the five delay periods (5 × 10 choices) and used an adaptive procedure, which we consider to be a more reliable experimental approach for the assessment of delay discounting.
Of note, two previous studies (Scherr et al. Reference Scherr, Ferraro and Weatherly2010; Lilienthal & Weatherly, Reference Lilienthal and Weatherly2013) focusing on healthy female college students at risk for AN (according to self-report) also did not find differences in delay discounting of monetary gains between at-risk and non-risk students. Temporal delay discounting has been investigated in a multiplicity of other psychiatric disorders. Almost the entire literature has focused on conditions characterized by impulsivity, that is a lack of control or lack of self-discipline (Evenden, Reference Evenden1999; Claes et al. Reference Claes, Vandereycken and Vertommen2005). Accordingly, high delay discounting has been found in individuals suffering from pathologic gambling (e.g. Holt et al. Reference Holt, Green and Myerson2003; Ledgerwood et al. Reference Ledgerwood, Alessi, Phoenix and Petry2009), substance use (e.g. Kirby et al. Reference Kirby, Petry and Bickel1999; Reynolds, Reference Reynolds2006), borderline personality disorder (Lawrence et al. Reference Lawrence, Allen and Chanen2010), ADHD (Demurie et al. Reference Demurie, Roeyers, Baeyens and Sonuga-Barke2012) and obesity (e.g. Saelens & Epstein, Reference Saelens and Epstein1996; Weller et al. Reference Weller, Cook, Avsar and Cox2008). However, even patients with disorders that are not typically associated with higher levels of impulsivity, such as depression (Takahashi et al. Reference Takahashi, Oono, Inoue, Boku, Kako, Kitaichi, Kusumi, Masui, Nakagawa, Suzuki, Tanaka, Koyama and Radford2008; Pulcu et al. Reference Pulcu, Trotter, Thomas, McFarquhar, Juhasz, Sahakian, Deakin, Zahn, Anderson and Elliott2013), social anxiety (Rounds et al. Reference Rounds, Beck and Grant2007) or schizophrenia (Heerey et al. Reference Heerey, Robinson, McMahon and Gold2007; Juckel et al. Reference Juckel, Friedel, Koslowski, Witthaus, Özgürdal, Gudlowski, Knutson, Wrase, Brüne, Heinz and Schlagenhauf2012; Weller et al. Reference Weller, Avsar, Cox, Reid, White and Lahti2014), were found to discount future rewards more than healthy controls. In that sense, unaltered delay discounting behavior in AN, if confirmed in future studies, would be an exceptional characteristic of this group of patients. The only other psychiatric condition that does not seem to show increased delay discounting is obsessive–compulsive disorder (Pinto et al. Reference Pinto, Steinglass, Greene, Weber and Simpson2014).
According to the notion that self-control and thus low discounting of future rewards is dependent on lateral prefrontal brain regions (Ballard & Knutson, Reference Ballard and Knutson2009), the common finding of increased delay discounting in psychiatric patients is not surprising, and is in line with the fact that there are developmental effects, that is children and adolescents discount future rewards more than adults (e.g. Steinberg et al. Reference Steinberg, Graham, O'Brien, Woolard, Cauffman and Banich2009). Accordingly, age was significantly associated with delay discounting in our study. We controlled for these effects in our models and by analyzing a subsample carefully matched for age.
There are a few limitations to the current study. For example, the use of only hypothetical rewards (no real-life consequences regarding the participants’ choices) may have influenced the decision-making process (Coller & Williams, Reference Coller and Williams1999). However, it has been shown that, even in the absence of real rewards, the discount rate can be estimated reliably (e.g. Johnson & Bickel, Reference Johnson and Bickel2002; Madden et al. Reference Madden, Raiff, Lagorio, Begotka, Mueller, Hehli and Wegener2004; Lawyer et al. Reference Lawyer, Schoepflin, Green and Jenks2011). Nevertheless, we would recommend some form of real reward for a select number of choices to ensure ecological validity in future studies. The task used in the current study has been proven to be a sensitive measure of delay discounting (e.g. Ripke et al. Reference Ripke, Hübner, Mennigen, Müller, Rodehacke, Schmidt, Jacob and Smolka2012) and the correlation of the discount rate with the impulsivity scale of the JTCI and the within-person stability provides additional external validity. The detected correlation between IQ and k values in control subjects is in line with previous research (meta-analysis by Shamosh et al. Reference Shamosh, DeYoung, Green, Reis, Johnson, Conway, Engle, Braver and Gray2008) reporting evidence for a negative association between IQ and delay discounting. In contrast to previous studies that included overweight and obese participants, we did not observe a relationship between BMI and discount rate (Zhang & Rashad, Reference Zhang and Rashad2008; Jarmolowicz et al. Reference Jarmolowicz, Cherry, Reed, Bruce, Crespi, Lusk and Bruce2014). This difference could be due to the exclusion of overweight and obese participants and the fact that we adjusted BMI according to gender and age. Finally, we do not have an explanation for the correlation between discount rate and eating disorder pathology in recovered patients. However, the effects were weak and would not withstand corrections for multiple testing.
Despite possible limitations, the relatively large sample size and the careful exclusion of participants with confounding variables (e.g. psychotropic medications, history of bulimia nervosa, substance abuse) should be emphasized. Furthermore, our study design (inclusion of recovered patients, longitudinal design) allows conclusions to be drawn about state and trait effects.
In summary, delay discounting for future monetary rewards was investigated to understand self-control in AN. Based on clinical observations and some findings from the neuroimaging literature (Wagner et al. Reference Wagner, Aizenstein, Venkatraman, Fudge, May, Mazurkewicz, Frank, Bailer, Fischer, Nguyen, Carter, Putnam and Kaye2007; Zastrow et al. Reference Zastrow, Kaiser, Stippich, Walther, Herzog, Tchanturia, Belger, Weisbrod, Treasure and Friederich2009; Kullmann et al. Reference Kullmann, Giel, Hu, Bischoff, Teufel, Thiel, Zipfel and Preissl2014), increased cognitive control was suggested as a trait in AN. However, our results are not in line with this hypothesis or with the only other previous study investigating delay discounting in AN. To date, it remains unclear whether increased cognitive control is a general characteristic of AN or is specific to certain domains closely linked with eating behavior and body image. Future studies using paradigms with disorder-specific stimuli (Watson et al. Reference Watson, Werling, Zucker and Platt2010) may help to clarify the role of delay discounting in AN.
Supplementary material
For supplementary material accompanying this paper visit http://dx.doi.org/10.1017/S0033291714002311.
Acknowledgments
This work was supported by the Deutsche Forschungsgemeinschaft (DFG grants SM 80/5-2, SM 80/7-1, EH 367/5-1 and SFB 940/1), the Bundesministerium für Bildung und Forschung (BMBF grant 01EV0711) and the Swiss Anorexia Nervosa Foundation. We thank all junior researchers and student workers for their assistance with data collection and all participants for their time and cooperation.
Declaration of Interest
V. Roessner has received lecture fees from Eli Lilly, Janssen-Cilag, Medice and Novartis and was a member of advisory boards for Eli Lilly and Novartis. All other authors declare that they have no conflicts of interest.