I. INTRODUCTION
Research works aimed toward achieving a better understanding of the physical or chemical processes to make heterogeneous ceramics have both scientific and technological importance. One particular class of heterogeneous solids is porous ceramic that contains a large volume fraction of pores. The properties are strongly dependent on microstructural factors including the porosity, pore size, shape, interconnectivity, and configuration. Hence, studies on the relationships between the properties, porosities, and microstructures are essential in the designing and development of advanced porous ceramics.
The freezing of slurries that contain ceramic raw powders has been regarded as a promising technique for preparing cellular ceramics with unique pore configurations, in which porosity is produced by the formation of ice crystals, sublimation by vacuum drying, and subsequent sintering. Reference Fukasawa, Ando, Ohji and Kanzaki1–Reference Fukushima, Yoshizawa and Ohji7 The resulting microstructure consists of ellipsoidal or lamellar pores aligned longitudinally, which results in improved strength in the direction due to the anisotropy. Thus, significant effort has been devoted to the mechanical characterization of such materials, particularly investigations on the relationship between the compressive strength and unidirectional microstructure.
Among the numerous researches so far on cellular ceramics prepared by freeze casting, there have been some problems which have to be overcome, particularly limitations on the type of porosity available and characterization of the mechanical properties. For example, (i) the pore shape has been limited due to the shape of ice, (ii) interconnected open porosity is most frequently formed, so that closed porosity has not been extensively studied, and (iii) the mechanical properties have been usually discussed based on two-dimensional observations of local regions, such as surfaces and cross sections of porous materials. With respect to the pore shape and type of porosity, we have reported a series of studies on a combined route that utilizes gelation and freezing, which has enabled the fabrication of nearly honeycomb shaped structures with micrometer-sized cells and no ellipsoidal structures. Reference Fukushima, Yoshizawa and Ohji7–Reference Fukushima and Yoshizawa12 These studies have suggested some possibilities for control of the pore shape because the gelation agent has a significant effect on the cellular morphology. One purpose of the present work is therefore to examine the effect of a well-controlled gel strength on the pore architecture formed by the gelation freezing route. For mechanical characterization, we consider internal load transfer in a model that has been constructed from actual three dimensional (3D) microstructures collected using X-ray computed tomography (CT) and also verify the numerical results with respect to the experimental results. Very recently, Roussel et al. Reference Roussel, Lichtner, Jauffres, Villanova, Bordia and Martin13 compared simulated strength values with experimental data from freeze-cast samples using discrete element simulation of a CT-image. Here, we conduct a homogenization analysis with 3D microscopic models based on cellular ceramics prepared and a finite element method (FEM) simulation of the compressive tests for macroscopic models, and discuss macroscopic stressed areas and local stress distributions. This concept has been firstly proposed by Hollister and Kikuchi. Reference Hollister and Kikuchi14–Reference Terada, Miura and Kikuchi16 Takano and coworkers Reference Takano, Kimura, Zako and Kubo17–Reference Takano, Zako, Kubo and Kimura19 widely studied this multiscale modeling technique for porous ceramics, but with very low porosities around 4–20%.
We expect that the present approach could be promising for the design of pore configurations and as a strong tool for the prediction of the mechanical properties of highly porous ceramics with anisotropy.
II. EXPERIMENTAL
α-Al2O3 (TM-DAR, Taimei Chemicals Co., Ltd., Nagano, Japan) with an average particle size of 0.20 μm was used as a raw material and mixed with a gelatin solution having a concentration of 1, 3, or 5 vol% (Wako Pure Chemical Industries Ltd., Tokyo, Japan) to produce samples denoted as A1, A3, and A5, respectively. The gelatin is denatured collagen, which consists of a helical unit structure of polypeptide chains with each molecular weight around 100,000. Mixtures with ceramic-powder to gelatin-solution ratios of 10/90 (v/v) were stirred using a planetary homogenizer (Thinky, Tokyo, Japan). Ammonium polyacrylate solution (40% solid concentration) with molecular weight around 10,000 was used as a dispersant to obtain homogeneous slurries.
The slurry was poured into a plastic container that was revolved at 800 rpm while rotating at 2000 rpm. After defoaming under vacuum, the slurry was poured into a plastic mold and kept at 7 °C to obtain a gelatin gel with alumina. The mold containing the gel was directly immersed into an ethanol bath at −40 °C. After demolding, sublimation of the ice crystals in the frozen gelatin gels was conducted under vacuum in a freeze drier (FDU-2100; Tokyo Rikakikai Co., Ltd., Tokyo, Japan) at temperatures from −10 to 30 °C. The green bodies were then heated at 1200 °C for 2 h.
The gel strength, porosity, microstructure, and compressive strength of the obtained specimens were characterized. The bloom gel strength was measured by using a texture analyzer (CT3-1500, Brookfield, Massachusetts, USA) to detect the maximum force. The test was carried out by depressing the gel surface by using a plunger with a diameter of 12.7 mm, in which a target penetration depth of 4 mm and the speed of 0.5 mm/min were used. Before the tests, gelatin solutions with various concentrations were kept for 18–19 h at 7 °C. For every gel, three specimens were tested to calculate the average. Open porosity was determined by the Archimedes’ method using water as an immersion medium. When the Archimedes’ method is used without sufficient vacuum, the buoyancy of the open pores can strongly affect the weight in water. Thus, after soaking in water, the samples were placed under vacuum until no bubbles were observed, and then their weights in water were measured. For each composition, two specimens at least were measured. The microstructures of fractured or polished surfaces were observed using scanning electron microscopy (SEM) (JEOL, Model JSM-5600, Tokyo, Japan). The compressive strength of samples with a diameter of 5 mm and a height of 12.5 mm was measured using the universal testing machine (MTS Systems Corporation, Sintech 10/GL, Minnesota, USA) with a crosshead speed of 0.5 mm/min. Before the crushing tests, porosities were again measured by the dimensions and weights to confirm whether those were similar values as those measured by the Archimedes’ method. Cylindrical specimens were then loaded on the top and bottom surfaces. The load was parallel to the freezing (cell) direction. A minimum of five samples were tested to obtain the average strength.
3D microstructural observations were performed using X-ray CT (SMX-225CT, Shimadzu, Kyoto, Japan). Image-based modeling of the unit structures (microscopic model) extracted from the CT images and homogenization analysis of obtained porous ceramics were conducted using commercial homogenization software (VOXELCON, Quint Corporation, Tokyo, Japan), which employs the element-by-element (EBE) method as a solver.
III. RESULTS
We aimed to investigate the relationship between the morphology formed via gelation freezing and the gel strength. We have previously reported Reference Fukushima, Yoshizawa and Ohji7,Reference Fukushima and Yoshizawa11 that when gelatin was just dissolved into the slurry, then dendritic, ellipsoidal, or lamellar microstructures could be formed, which were similar to those produced via a conventional aqueous freeze casting method. However, when the gelation step was inserted before the freezing step, unidirectional cylindrical structures could be formed. This previous result suggests that the gel state and strength are important for varying the pore shape and/or controlling the morphology. Thus, to carefully investigate and focus on the effect of the gelatin content on morphologies, the solid loading was kept as 10 vol% for every gel.
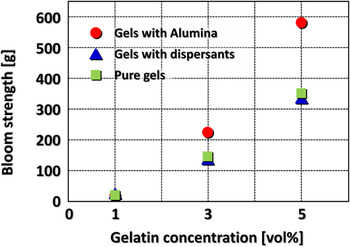
Figure 1 shows gel strengths for gelatin gels with and without dispersants, and alumina particle dispersed gels with dispersants, as a function of the gelatin concentration. The bloom test was used because this test has been widely accepted for the evaluation of the gel strength for gelatin gels. Reference Eysturskaro, Haug, Ulset and Draget20 All of the gel strengths clearly increased with the gelatin content. The results for the samples without alumina revealed no effect of the dispersants on the gel strength. The gel strengths for the A1, A3, and A5 samples were 7, 227, and 581 g, respectively. Thus, gelatin content and alumina included in the gel significantly enhanced the strength, indicating that the addition made the gels harder.
Bloom gel strength of pure gelatin gels with and without dispersants and defoaming agents, and of gelatin gels with alumina particles as a function of gelatin concentration.

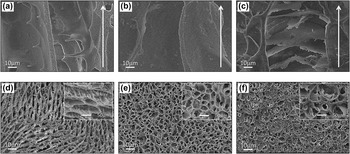
Figure 2 shows typical SEM micrographs of the A1, A3, and A5 samples with sections parallel and perpendicular to the freezing direction indicated by the arrows. As seen in Figs. 2(a)–2(c), unidirectionally oriented pore channels were formed parallel to the freezing direction, in which (a) numerous “ceramic bridges” Reference Deville, Saiz and Tomsia4,Reference Deville5 or projections protruded from the cell walls, (b) cylindrical pores, and (c) bamboo-like partition walls convex upward and connections between adjacent cells were observed. In the perpendicular sections, (d) ellipsoidal cells with ceramic bridges, but no complete length to bridge the gap, (e) unidirectional cylindrical cells, and (f) closed cylindrical cells partially covered and filled by partition walls were observed, which correspond to the morphologies shown in Figs. 2(a)–2(c), respectively. The cell widths were calculated to be 40, 31, and 41 μm for the A1, A3, and A5, respectively. These different morphologies represent the effect of the gel strength (gelatin content) on the morphology.
Typical SEM micrographs of (a,d) A1, (b,e) A3, and (c,f) A5 samples, viewed in (a–c) parallel and (d–f) perpendicular to the freezing direction indicated by the arrows.

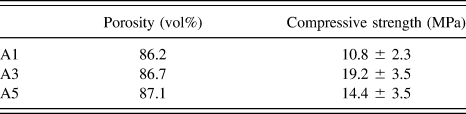
Table I shows the porosity and compressive strength of the samples. The compressive strength could be varied, regardless of the porosity, which could be related to the microstructure.
Porosity and compressive strength for the samples.

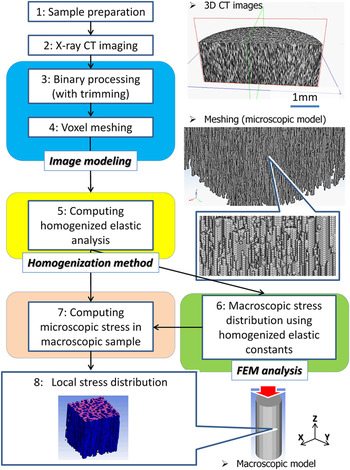
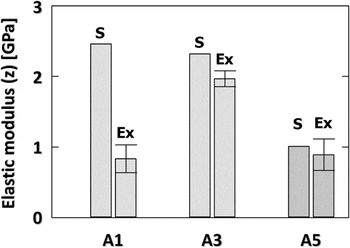
Figure 3 shows a flowchart of the process used for image-based modeling, homogenization analysis of a microscopic model, stress distribution in a macroscopic model, and local stress in the microscopic model. Also shown are typical 3D images of the A3 sample constructed from micrographs measured by X-ray CT and a microscopic model composed of a voxel mesh with 3.0 × 3.0 × 3.0 μm. Unidirectionally oriented cellular structures were again observed in the CT images. Then, the CT images were directly converted to a microscopic voxel model with a mesh size equivalent to the size of a pixel (voxel) in the images. Microscopic models with a total voxel number of 1,000,000 were constructed by trimming the models. All micrographs were converted to black-and-white images for skeleton (voxels)-and-pores in the model, respectively, based on a defined threshold value in each pixel (this detailed binary processing will be mentioned later). The homogenized elastic constants obtained with the microscopic models and the experimental data for the A1, A3, and A5 samples are summarized in Fig. 4, where these values represent longitudinal z-direction in the simulation. When the homogenization analysis of the microscopic model was conducted, the Young’s modulus and Poisson’s ratio for a conventional powder compact sintered at the same temperature as that of the freeze-dried sample, which were 221 GPa and 0.21, respectively, were used as reference values. The homogenized elastic constants agreed well with the experimental results, except for the A1 sample. Although the total voxel number in the A1 model was preliminarily varied, the elastic constants were still higher than the experimental results.
Flowchart for the homogenization analysis of a microscopic model, stress distribution of a macroscopic model, including typical examples of 3D images of the A3 sample and the microscopic model composed of voxel meshes.

Homogenized elastic constants (shown as “S”) for the microscopic models and experimental data (shown as “Ex”) for the A1, A3, and A5 samples.

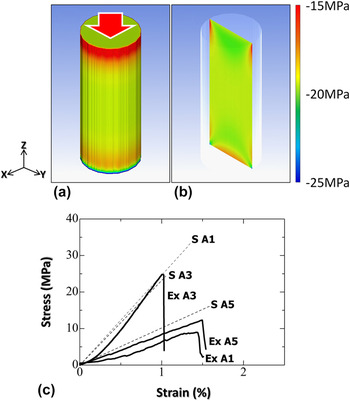
FEM analyses were conducted for macroscopic specimens loaded compressively, in which each unit voxel in the sample had the homogenized elastic constants mentioned above. Figure 5 shows (a, b) the typical example of macroscopic stress distributions (σ z ) of the A3 and (c) experimental and simulated stress strain curves extracted from the elastic region, obtained by the FEM analysis. There were not different fracture behaviors experimentally observed among samples. The cylindrical sample in the simulation was 5.0 mm in diameter and 12.5 mm in height, and the compressive loads applied along the longitudinal (z) direction for the A1, A3, and A5 samples were 225, 346, and 286 N, respectively, which were identically adjusted according to the maximum fracture loads of actual specimens with the same cylindrical shape and dimensions. The number of hexahedral elements was 1,954,000. As seen in Figs. 5(a) and 5(b), overall stress distribution was observed to be symmetric. The stress was more localized around both the insides of the upper and bottom, and the bottom edges in the sample (note that minus means compressive stress). The results for the A1 and A5 samples showed the same trend as those for the A3 sample shown here. The average compressive stress values were analyzed to be −13.0, −18.0, and −14.9 MPa for the A1, A3, and A5, respectively. As seen in Fig. 5(c), the results correspond well with the simulations, except for the A1 sample.
(a and b) Typical examples of macroscopic stress distributions (σ z ) by the FEM analysis and (c) stress–strain curves obtained by simulation (S) and experiments (Ex).

IV. DISCUSSION
A. Pore morphology controlled by gel strength
Regarding the gel strength, two important aspects can be highlighted as follows: (i) the relationship between the gel strength and the gelatin content in the initial slurry and (ii) the effect of the alumina and dispersants on the strength. In the bloom test, a high strength indicates that a gel is more rigid with a higher stiffness. Reference Yakimets, Wellner, Smith, Wilson, Farhat and Mitchell21 The mechanical properties of gelatin gels are known to correlate with the triple-helix content. Reference Yakimets, Wellner, Smith, Wilson, Farhat and Mitchell21–Reference Aguirre-Alvarez, Pimentel-Gonzalez, Campos-Montiel, Foster and Hill23 When a warm gelatin solution is gelled, the gelatin molecules begin to revert to the ordered triple-helix collagen-like sequences during cooling, i.e., a conformational coil-to-helix (sol–gel) transition, because a water–gelatin system exhibits thermoreversible cold-setting below 30 °C. Reference Kuijpers, Engbers, Feijen, De Smedt, Meyvis, Demeester, Krijgsveld, Zaat and Dankert24–Reference Guo, Colby, Lusignan and Howe28 The effect of the setting (gelation) temperature on the strength is negligible in the present work because all samples have been set at the same temperature of 7 °C. Reference Djabourov and Papon29 Thus, the triple-helix content in the gels is always dependent on the gelatin content in the initial sol solution.
The lack of influence of the dispersants on the gel strength is consistent with the literature, in that the effect of ionic strength and pH on the strength of gelatin gels is negligible. Reference Hsu and Jamieson30,Reference Papageorgiou, Kasapis and Richardson31 However, alumina particles in the gel significantly enhanced the gel strength, indicating that the addition made the gels harder. In the field of polymer science, similar phenomena have been widely reported for the addition of water-insoluble fillers to rubber or resins for the modification of their mechanical properties. Reference Samura, Kato, Morita, Kawamura, Koyama and Osawa32,Reference Young, Maxwell and Kinloch33 The Young’s modulus, hardness, and stiffness of gelatin gels containing the fillers increased with the filler content due to the total occupied volume and surface area, i.e., the volume effect on the mechanical properties. However, it has been reported that the melting points of gelatin gels with fillers are not changed, regardless of the particle size of the filler or the amount added. Reference Samura, Kato, Morita, Kawamura, Koyama and Osawa32 Thus, the results showed that the addition of alumina powder could make the gelatin gels physically harder due to the volumetric effect, but without any change in the molecular structure.
The gel strength clearly varied with the pore morphology. For the ellipsoidal cells shown in Fig. 2(d), the cell morphology appears similar to that formed by conventional aqueous freeze casting, Reference Fukasawa, Ando, Ohji and Kanzaki1–Reference Deville5,Reference Fukasawa, Deng, Ando and Ohji34–Reference Deville, Saiz, Nalla and Tomsia36 although the pores have a substantially smaller aspect ratio than that of conventional products. Gelatin molecules in warm slurry exist as separate disordered chains (coils). When a solution containing 1% gelatin is cooled to achieve gelation, the gelatin molecules form a very loose cross-linked network by hydrogen bonding. Reference Djabourov and Papon29 Indeed, very limited flowability was observed in the A1 gel, suggesting that this state could be regarded as highly viscous slurry, more roughly the intermediate state between the gel and slurry. In addition, numerous ceramic bridges originating from the cell walls could also support the above hypothesis. It has been shown that such bridge structures can often result from highly concentrated slurries due to interactions between the particles, while such structures are negligible in dilute slurries. Reference Deville, Saiz and Tomsia4,Reference Deville5 The bridge shape results from the local tip splitting of ice crystals, as shown in Fig. 2(a), because the microstructure can be formed as a negative template of the ice crystal. Reference Deville, Saiz and Tomsia4,Reference Deville5 Subsequent tip healing by the engulfment of particle agglomerations repelled from the ice–water interface can be caused by large interactions between gelatin molecules and ceramic particles in further condensed gels by gradually reducing the water content during freezing. As the bridge length has been reported to be dependent on the concentration of the slurry, Reference Deville, Saiz and Tomsia4,Reference Deville5 the very low gel strength can provide specific conditions for appropriate ice tip splitting and increased resistance to ice growth, i.e., the formation of elliptical pores with smaller aspect ratios than those in conventional aqueous freezing.
We have already reported the effects of processing on the formation of unidirectional cellular structures in the A3 sample. Reference Fukushima, Yoshizawa and Ohji7–Reference Fukushima and Yoshizawa12,Reference Fukushima and Yoshizawa37,Reference Fukushima and Yoshizawa38 This cylindrical pore can be considered to have a smaller aspect ratio (major and minor radius in an ellipse) than that observed in the A1 sample. The aspect ratio indicates the difficulty of ice crystal growth, which has been supported by our previous reports. Reference Fukushima and Yoshizawa37,Reference Fukushima and Yoshizawa38 Even when the freezing temperature of gel bodies was varied with this gelatin content, the resulting pore aspect ratios were constant at around 1.2–1.3, i.e., almost cylindrical shaped, indicating that this gelatin content could have some resistance to ice growth compared with the formation of ellipsoidal ice. It should be noted that no ceramic bridges were observed in the A3 sample. During freezing, the gelatin can be concurrently expelled by ice growth and then surround the ice column, which is supported by our previous work regarding a gelatin-derived carbon layer observed on the surfaces of cell walls after heating under an inert atmosphere. Reference Hamamoto, Fukushima, Mamiya, Yoshizawa, Akimoto, Suzuki and Fujishiro39 This must increase the gelatin concentration during phase separation. Thus, it is reasonable to consider that this gelatin-wrapped structure can strongly inhibit the splitting of ice crystals to make bridge structures.
As seen in Figs. 2(c) and 2(f), the cylindrical pores were very similar to those shown in Figs. 2(b) and 2(e), except the bamboo-like joint structures. This phenomenon can be understood as a depression of the freezing point. Once a cylindrical ice column is formed, freeze concentration involving condensed gelatin and particles occurs. Reference Pekor, Groth and Nettleship40 A higher gelatin content should thus result in a lower freezing point, especially around the ice front. Reference Deville, Saiz and Tomsia4,Reference Fukushima, Tsuda and Yoshizawa10,Reference Pekor, Groth and Nettleship40,Reference Pekor, Kisa and Nettleship41 Thus, the particles around the ice tip cannot be repelled and swept away but instead remain stationary for a while. Meanwhile, new ice crystals in advance of the solidified front can be formed because they are not subject to the freezing point depression. Thus, the particles can be encapsulated between upper and lower ice crystals. This hypothesis can be presumably supported by the orientation of observed bamboo-like joints, always convex upward to the freezing direction, which suggests that the ice can pause during growth due to depression of the freezing point.
B. Mechanical properties of the resultant ceramics in various scales
The equations proposed by Gibson and Ashby have been most frequently used to predict the mechanical properties of freeze-cast microstructures. Reference Gibson and Ashby42 Although the upper bound of the tensile strength can be theoretically calculated, these equations consider regular ideal porous structures which are less susceptible to stress concentration compared to real complicated ones. Thus, as mentioned in Sec. I, we have investigated actual stress distribution under compression in the real freeze-cast derived ceramic samples.
When the simulation of the resulting porous ceramics was conducted, the binary processing was the most important step because the number (volume fraction) of voxels of the skeleton in the model, i.e., relative density, could always control the mechanical properties predicted by simulation. Therefore, this processing was carefully conducted, whereby the number of voxels could be adjusted with relative densities that were experimentally measured using the Archimedes’ principle. Although the porosity distribution within a sample must affect the simulation results, uniform distribution throughout the entire body prepared by this method has been confirmed in our previous reports. Reference Fukushima, Nakata, Zhou, Ohji and Yoshizawa9,Reference Fukushima, Tsuda and Yoshizawa10 Therefore, the simulated samples can be regarded as periodic structures composed of continuous units of micromodels with the same porosity.
Only the A1 sample in Fig. 4 revealed substantial difference between the simulation and experimental results. The Young’s modulus and Poisson’s ratio, which were obtained from a sintered body of conventional powder compact as mentioned above, were used as reference values in the simulation; thus, the characteristics of the cell walls of the A1 sample may be different from the reference. During freeze concentration, a low gelatin content leads to loosely packed particles during freezing because the separation between water, gelatin, and particles is relatively insufficient due to the dilute concentration, whereas a higher gel strength can result in the formation of more condensed packing, until the water is completely separated from the gelatin by the larger freezing point depression. As another reason for lowering the elastic modulus, the ellipsoidal microstructure can be considered as well. When the pore ellipticity increases, the elastic modulus and strength can be reduced. Reference Hattiangadi and Bandyopadhyay43 Thus, the ellipsoidal pores are considered to be deformed and fractured as the ellipsoidal shape is spread out.
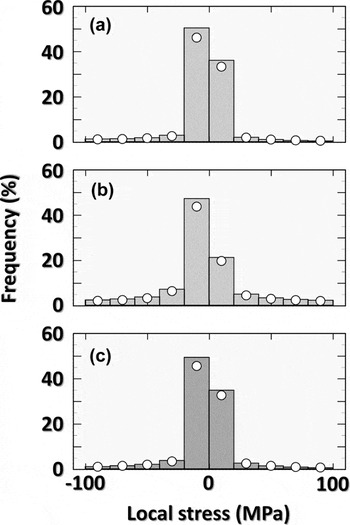
When the equivalent elastic modulus was analyzed, as characteristic displacement in the microscopic model could be simultaneously calculated, stress distribution shown in Fig. 5 could be represented. The microscopic stresses in each sample were then analyzed at the specific point where the maximum compressive stress was detected in the macroscopic model. Figure 6 shows the stress distribution in the microscopic model of the (a) A1, (b) A3, and (c) A5, respectively, in which the microscopic models to calculate the homogenized elastic constants have been used again. The vertical axis indicates the percentage of elements that have the specified stress. It was found that the stress distribution occurs mainly at 0 to −20 MPa (again, note that minus means compressive stress), which is well consistent with Fig. 5. It should be noted that tensile stress can be also generated, which did not appear in Fig. 5. It can be considered that, because the cell walls are not completely straight but include some bent and contact points, the tension arises due to moment of force. These results just give the general information on stress distribution, but not on the location where the stress occurs. Thus, the distance from the nearest pore was further defined for all voxel elements of the solid phase. The dots in Fig. 6 represent the contribution of voxels located at the nearest distance from the pore periphery, which suggests that the stress is almost always generated in the portion nearest to the pores, particularly in high stress ranges above 20 MPa in tension and below −20 MPa in compression. In addition, the contribution in the tension of 0–20 MPa was higher than that in the compression of 0 to −20 MPa, again suggesting torque generated in cell walls. This means that the severe local stress concentrations of tension as well as compression occur throughout the samples. It has been known that such stress concentrations become sources for crack initiation and propagation which eventually lead the final failure in porous ceramics. Reference Rice44,Reference Boccaccini45 This is true particularly in porous ceramics with thin cell walls like the freeze-dried samples obtained in this study. In fact, the wall thickness was measured to be 2.6, 4.0, and 3.7 μm, for the A1, A3, and A5, respectively, suggesting that alumina particles in the A1 and A5 could be consumed to form a ceramic bridge or bamboo-joint, and such thin cell walls are easily broken by stress concentration even though it is very localized. This result also indicates that the elastic modulus can increase with increased wall thickness.
The histogram of stress distribution in the microscopic unit of (a) A1, (b) A3, and (c) A5.

These obtained results reveal that the gel strength can be the key factor to design the pore configuration and control the mechanical properties. In addition, by using the image-based modeling, the elastic constant of microscopic models, macroscopic analysis by the FEM, and local stress distribution in microscopic models, mechanical properties of cellular samples could be relatively precisely simulated. The present strategy proposed is expected as a promising approach to tailor pore architectures and predict mechanical properties in various scales.
V. CONCLUSIONS
It was possible to modulate a wide range of pore morphologies, from the decoration of ellipsoidal cells with ceramic bridges on pore walls to bamboo-like closed pores, through the gelation freezing route with modified gel strengths. The gel strength had a pronounced effect on the pore architectures, which substantially affected the mechanical properties, regardless of similar porosity. The homogenization method with a microscopic model using image-based modeling, macroscopic FEM, and a local stress distribution proved to be a very strong tool for the prediction of the mechanical responses of ceramics with a very high porosity and unique microstructure.
ACKNOWLEDGMENTS
The authors gratefully acknowledge the support of the NEDO programs, Future Pioneering Projects/Research and Development of Thermal Management Materials and Technology.