1. Introduction
Isotopic signatures of carbonate rocks provide useful information on the palaeoclimatic and palaeoenvironmental conditions under which these rocks formed. The variation of the fractionation factor (α) for calcite with temperature is accurately known by empirical studies of calcite–water systems (Epstein & Mayeda, Reference Epstein and Mayeda1953; Craig, Reference Craig and Tongiorgi1965; Kim & O'Neil, Reference Kim and O'Neil1987), and it is possible to estimate precipitation temperatures from the isotopic composition of any carbonate (Gasse & Fontes, Reference Gasse and Fontes1989). This technique has been widely applied to continental carbonates, such as travertines and speleothems (O'Brien et al. Reference O'Brien, Kaufman, Sharp, Atudorei, Parnell and Crossey2006; Sun & Liu, Reference Sun and Liu2010). The most complete palaeoclimatic records for the Quaternary period are ice cores recovered from Greenland and Antarctica (GRIP Members, 1993; Petit et al. Reference Petit, Jouzel, Raynaud, Barkov, Barnola, Basile, Bender, Chappellaz, Davis, Delaygue, Delmotte, Kotlyakov, Legrand, Lipenkov, Lorius, Pepin, Ritz, Saltzman and Stievenard1999; Kawamura et al. Reference Kawamura, Nakazawa, Aoki, Sugawara, Fujii and Watanabe2003; North Greenland Ice Core Project Members, 2004; Jouzel et al. Reference Jouzel2004). These records are from high latitudes with low temperatures of below −20°C throughout the year. For this reason, palaeoclimatic studies conducted at middle latitudes acquire considerable interest, such as those performed in marine and lacustrine systems (Bar-Matthews et al. Reference Bar-Matthews, Ayalon, Gilmour, Matthews and Hawkesworth2003; Morellon et al. Reference Morellon, Valero-Garces, Vegas-Vilarrubia, Gonzalez-Samperiz, Romero, Delgado-Huertas, Mata, Moreno, Rico and Pablo Corella2009) and especially those carried out on carbonate formations, mainly speleothems and travertines, which are widely distributed (Horowitz, Reference Horowitz1987, Reference Horowitz1989, Reference Horowitz2001; Auler & Smart, Reference Auler and Smart2001; Ortiz et al. Reference Ortiz, Torres, Julia, Delgado, Llamas, Soler and Delgado2004b , Reference Ortiz, Torres, Delgado, Reyes, Llamas, Soler and Raya2006, Reference Ortiz, Torres, Delgado, Reyes and Diaz-Bautista2009; Vernet et al. Reference Vernet, Mercier, Bazile and Brugal2008).
This paper reports a palaeoclimatic record from the Alicún de las Torres travertine formation in the Guadix-Baza basin, situated in a mid-latitude geographical location (37°N) on the Iberian Peninsula. This formation has yielded a complete isotopic record spanning ≈ 219 ± 30ka, allowing reconstruction of the local palaeoclimatic and palaeoenvironmental conditions. The time period studied ranges from Late Pleistocene to Middle Holocene, and some of the main global palaeoclimatic events, such as the Eemian and the Younger and Older Dryas, have been identified. Studies dealing with the palaeoclimatic evolution of the Iberian Peninsula have been conducted at similar latitudes to that of the Alicún de las Torres travertine formation (Pons & Reilles, Reference Pons and Reille1988; Ortiz et al. Reference Ortiz, Torres, Delgado, Julia, Lucini, Llamas, Reyes, Soler and Valle2004a ,Reference Ortiz, Torres, Julia, Delgado, Llamas, Soler and Delgado b , Reference Ortiz, Torres, Delgado, Reyes, Llamas, Soler and Raya2006, Reference Ortiz, Torres, Delgado, Reyes and Diaz-Bautista2009, Reference Ortiz, Torres, Delgado, Llamas, Soler, Valle, Julia, Moreno and Diaz-Bautista2010; Martín-García, Alonso-Zarza & Martin-Perez, Reference Martin-Garcia, Alonso-Zarza and Martin-Perez2009; Moreno et al. Reference Moreno, Stoll, Jimenez-Sanchez, Cacho, Valero-Garces, Ito and Edwards2010; Pena et al. Reference Pena, Frances, Diz, Esparza, Grimalt, Nombela and Alejo2010; Valero-Garcés & Moreno, Reference Valero-Garces and Moreno2011; Rodríguez-Rodríguez et al. Reference Rodriguez-Rodriguez, Jimenez-Sanchez, Dominguez-Cuesta, Rico and Valero-Garces2011; Valdeolmillos-Rodríguez et al. Reference Valdeolmillos-Rodriguez, Dorado-Valino, Blanca Ruiz-Zapata and Maria Alonso-Zarza2011; Jiménez-Moreno & Anderson, Reference Jiménez-Moreno and Anderson2012). Among them, pollen studies carried out by Pons & Reilles (Reference Pons and Reille1998) and Ortiz et al. (Reference Ortiz, Torres, Delgado, Julia, Lucini, Llamas, Reyes, Soler and Valle2004a , Reference Ortiz, Torres, Delgado, Llamas, Soler, Valle, Julia, Moreno and Diaz-Bautista2010) at the El Padul site (Granada), just 60 km away from Alicún, allowed the identification of several climatic scenarios similar to that identified in the Alicún de las Torres site. In addition, studies conducted by Ortiz et al. (Reference Ortiz, Torres, Julia, Delgado, Llamas, Soler and Delgado2004b , Reference Ortiz, Torres, Delgado, Reyes, Llamas, Soler and Raya2006) in the Guadix-Baza basin allowed the identification of different climatic periods that took place in the basin between ≈ 2 Ma and 277 ka, about when the Alicún de las Torres travertine formation started precipitating.
The geomorphologic and tectonic setting and geochronology of the Alicún de las Torres travertine formation have been previously described (Díaz-Hernández, Martín & Juliá, Reference Díaz-Hernández, Martín and Juliá2000; Díaz-Hernández & Juliá, Reference Desprat, Goni, Turon, Duprat, Malaize and Peypouquet2006). Prado-Pérez & Pérez del Villar (Reference Prado-Pérez and Pérez del Villar2011) studied the main hydrogeochemical evolution of the thermal system, identifying the probable origin of the travertine parent water.
The main objective of this work has been to deduce the palaeoclimatic evolution in the mid-latitude continental Guadix-Baza basin during the last 219 ± 30 ka. This has allowed the correlation of the climatic events identified with those that took place at higher latitudes, as well as determining the main palaeoclimatic evolution at the lowest latitude of the Iberian Peninsula. As a consequence, this study provides a contribution to the knowledge of the palaeoclimatic and palaeoenvironmental conditions during the Late Pleistocene and most of the Holocene at mid-latitude settings.
2. Geological setting
The studied travertine formation is associated with the Alicún de las Torres thermal system, which is located in the southeast of the Iberian Peninsula, at the contact between the two main domains of the central sector of the Betic Cordilleras: the External and Internal zones (Fig. 1). This contact is covered by sediments of the Guadix-Baza Tertiary basin, which is the main intramontane Neogene basin in the Betic Cordilleras. The basement is the main water reservoir of the thermal system (Prado-Pérez & Pérez del Villar, Reference Prado-Pérez and Pérez del Villar2011), and it includes Triassic metamorphic materials, cropping out to the south (Internal Zones), and Mesozoic carbonate materials that crop out to the north (External Zones). Tertiary sediments filling the Guadix-Baza basin mainly consist of sandstones and conglomerates, as well as marly and clayey sediments with interbedded gypsum levels. These sedimentary materials can be divided into six units bounded by major discontinuities (Fernández, Soria & Viseras, Reference Fernández, Soria, Viseras, Friend and Dabrio1996). There were two main stages of basin fill (Viseras et al. Reference Viseras, Soria, Fernández and García García2005). The first Upper Tortonian stage was marine (units I and II), and the second stage, which ranges from Upper Miocene to the end of Pleistocene, shows continental characteristics (units IV, V and VI). Between these sedimentary stages an ocean–continental transition facies, represented by Unit III, has been identified.
Schematic geological map of the Guadix-Baza basin, showing the three major domains distinguished in the studied area, as well as the location of the Alicún de las Torres thermal springs (modified from Pérez Peña et al. Reference Pla-Pueyo, Gierlowski-Kordesch, Viseras and Soria2009).

Late Tortonian materials, belonging to units I, II and III, are poorly represented in the area, cropping out towards the SW of Villanueva de las Torres and Alicún de Ortega (Estévez et al. Reference Estevez, Rodríguez Fernández, Sanz de Galdeano and Vera1982; Fernández, Soria & Viseras, Reference Fernández, Soria, Viseras, Friend and Dabrio1996). Units IV, V and VI are widely represented in the basin, and a more detailed description can be found in Viseras & Fernández (Reference Viseras and Fernández1994), Fernández, Soria & Viseras (Reference Fernández, Soria, Viseras, Friend and Dabrio1996) and Pla-Pueyo et al. (Reference Pla-Pueyo, Gierlowski-Kordesch, Viseras and Soria2009).
The Alicún de las Torres thermal system is sourced in a deep carbonated aquifer, located in the Alpujárride Complex, which mainly consists of Triassic metamorphic materials, and is drained by five thermal springs, whose waters are classified as Ca–Mg–SO4-rich, with minor HCO3 − and a temperature of 35°C (Prado-Pérez & Pérez del Villar, Reference Prado-Pérez and Pérez del Villar2011).
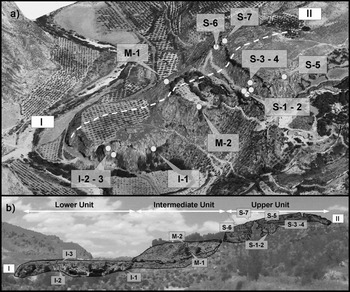
The Alicún de las Torres travertine formation was deposited from this thermal system (Prado-Pérez & Pérez del Villar, Reference Prado-Pérez and Pérez del Villar2011). It unconformably overlies the Cretaceous and Paleocene rock of the External Zones (Subbetic Zone). Its formation is mainly due to CO2 leakage processes that take place in the thermal springs. The travertine formation consists of three partially overlapping units (Díaz-Hernández & Juliá, Reference Díaz-Hernandez and Julia2006) that have been named the Lower, Intermediate and Upper units (Fig. 2).
Profile and sample locations. (a) Aerial view and (b) cross-section (I–II) of the travertine formation showing the three differentiated units and the location of the 12 vertical sampling profiles.

The Lower Unit is about 40 m thick and consists of several sigmoid subunits that overlap each other towards the Fardes River. These sigmoid subunits are typically found in prograding deposits, resulting in dam and cascade morphologies. The Intermediate Unit overlies the Lower Unit and the Cretaceous–Paleocene basement. Its total thickness is similar to the Lower Unit (40 m) and it contains abundant tufa. Finally, the Upper Unit is approximately 60 m thick and it is directly in contact with the Subbetic substrate. It is structured into three strata that prograde to cascade morphologies towards the Fardes Valley.
3. Materials and methods
3.a. Materials
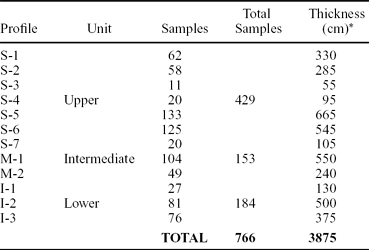
To carry out the isotopic study, 766 samples were taken from 12 vertical profiles distributed along the three travertine units (see Fig. 2). For sampling, a HILTI TE-6A drill system was used. Samples were generally taken every 5 cm except in profile S-6, in which, in some segments, samples were taken every 1 cm (Table 1).
Summary of sample distribution

* Represented thickness
To study the influence of any diagenetic process on the isotopic data, a complete petrographic and mineralogical analysis was carried out on samples taken from 60 micro drill-cores obtained by a Hilti DDEC-1 electrical drill equipped with a diamond crown. These samples were taken every 50 cm on the same vertical profiles as the samples for isotopic analysis.
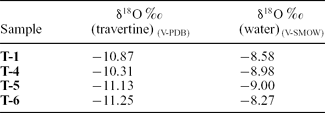
Four samples of travertine currently being deposited (T-1, T-4, T-5 and T-6) and four water samples from thermal springs were also taken. These samples were used to estimate the temperature under which travertine is currently precipitating (see Table 2).
δ18O values of current travertines and waters used to calculate the travertine precipitation temperature

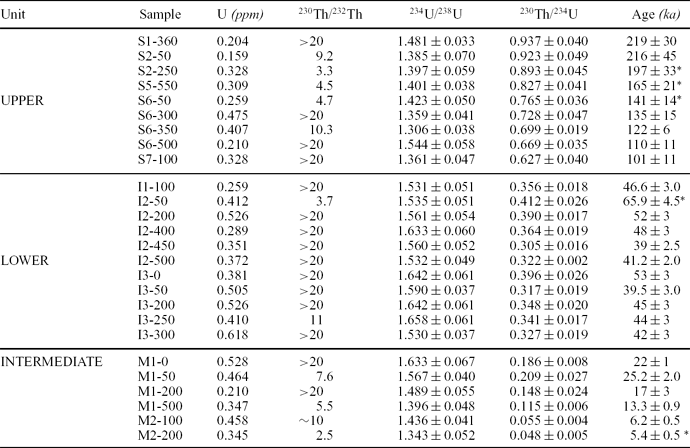
Finally, to date the travertine formation, 26 samples were analysed by the alpha-spectrometry technique. The distribution of these samples is as follows: nine samples from the Upper Unit, six from the Intermediate Unit and eleven from the Lower Unit (Table 3).
U contents, main activity ratios and ages estimated by alpha spectroscopy

* Samples with a 230Th/232Th below 5, so the uncertainty regarding the calculated age is very important.
3.b. Methodology
For petrographic, mineralogical and textural characterization, a Nikon Eclipse E600 POL optical microscope (OM) equipped with a Nikon Coolpix 990 camera was used. The qualitative mineralogical composition of the samples was determined by X-ray diffraction (XRD), using the powder method, after grinding and sieving the samples to < 63 μm grain size. A Philips X Pert-MPD diffractometer was used, with CuKα radiation, at an exploration rate of 0.04° 2θ/s and in the 2θ range 2–70°. Scanning electron microscopy (SEM) was carried out on polished thin-sections, coated with C or Au, and analysed by a Zeiss EVO LS 15 SEM, coupled to an Oxford INCA 350 Energy energy dispersive X-ray (EDX). Textural features of the rock-forming and accessory minerals were observed in backscattered electron images.
For stable isotopic signature determinations (δ13C and δ18O), a < 60 μm sized sample aliquot was used. All these aliquots were dissolved with 100% phosphoric acid for 12 hours in a thermostatic bath at 25°C (McCrea, Reference McCrea1950). The CO2 obtained was purified using a chromatographic column (continuous He flow system), and their isotopic ratios were measured in a Finnigan MAT 251 mass spectrometer in the Biogeochemical Laboratories of the Experimental Station of Zaidin (CSIC, Granada). All samples were analysed in triplicate. Internal standards Carrara, EEZ-1 and EEZ-10, previously analysed alongside International Atomic Energy Agency (IAEA) international standards NBS-18 and NBS-19, were analysed every three samples. The experimental error is < 0.1 ‰ for both δ13C and δ18O. Isotopic ratios were analysed normalized to a fractionation factor (α) of 1.01044 at 25°C (Kim & O'Neil, Reference Kim and O'Neil1987). All the isotopic results are reported in the standard delta notation (‰ δ) relative to the international Vienna Pee Dee Belemnite (V-PDB) standard.
For determination of the δ18O values in water, a modification of the CO2–H2O balance method, initially proposed by Epstein & Mayeda (Reference Epstein and Mayeda1953), was followed. This method consists of equilibrating CO2–H2O at a constant temperature (25°C) in the presence of He. An aliquot of this equilibrated CO2 is transferred to the automated GasBench II system and finally to the mass spectrometer, in order to measure the 18O/16O ratio. To determine δ2H values in water, H2 was extracted by thermal reduction by using metallic Zn at 480°C (Coleman et al. Reference Coleman, Sepherd, Dirham, Rouse and Moore1982). The H2 was analysed by the Thermo Finnigan Delta Plus XL mass spectrometer. Internal standards (EEZ-3, EEZ-4 and EEZ-6), previously contrasted with the IAEA international standards Vienna Standard Mean Ocean Water (V-SMOW), Standard Light Antarctic Precipitation (SLAP) and Greenland Ice Sheet Precipitation (GISP), were analysed every three samples. The experimental error in the determinations of δ2H values is less than 2 ‰.
The travertine was dated using the 230Th–234U method, which allows dating to about 350 ka. The activity ratios (AR) among the U and Th isotopes in the samples were obtained by alpha-spectrometry, using semiconductor detectors. The procedure applied in this analysis followed Aceña et al. (Reference Aceña, Crespo, Galán and Gascón1994). A sample aliquot of 5 to 16 g was dissolved in 10% HCl, which was added little by little while stirring, until all the CO2 was lost and the carbonate fraction was totally dissolved. The dissolutions were passed through 0.45 μm cellulose filters that were later studied by SEM and EDX. The yield tracers, 236U and 229Th, were added to these dissolutions. The pure U and Th fractions were obtained by a very simplified radiochemical purification method by means of two anion exchange columns. The first was used to separate U from Th by passing the dissolution in 9 M HCl medium through a DOWEX 1×8 resin. U was retained in the column while Th remained in solution. Washing and elution allowed the obtention of the purified U fraction. The second column, also containing DOWEX 1×8 resin, was used to purify the Th fraction from 8 M HNO3 medium with subsequent washing and elution.
Uranium and thorium alpha sources were prepared according to the method proposed by Hallstadius (Reference Hallstadius1984). This method has been modified by Vera Tomé & Martín Sánchez (Reference Vera Tomé and Martín Sánchez1992) with respect to: (i) the amount of Na2SO4 added; (ii) the current density applied; and (iii) the electrodeposition time. The alpha sources were measured in the laboratories of the University of Extremadura and CIEMAT with PIPS (passivated implanted planar silicon) detectors with active areas of 450 mm2.
Determination of the age by the U–Th method is based on the Th growth from the decay of 234U and 238U isotope parents in samples not containing 230Th at their initial formation. The activity of 230Th with a time since sample formation is defined by the Bateman's equation (Krane, Reference Krane1988).
4. Results
4.a. Mineralogy and petrography
Textural, mineralogical and petrographic characteristics of these travertines are used to indicate diagenetic processes that could have modified their isotopic characteristics and to indicate allochthonous detrital mineral or rock fragments that would affect 238U series dating. The main results are presented in Figures 3, 4 and 5 (and online Supplementary Material A at http://journals.cambridge.org/geo)
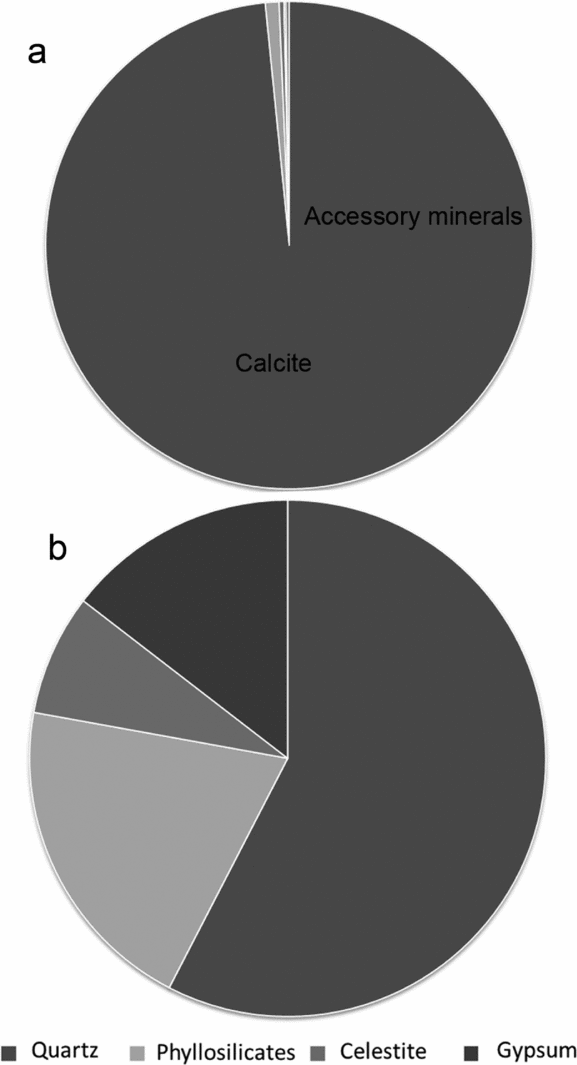
Travertine mineralogical composition. Mineralogical compositions determined by XRD according to Prado (Reference Prado2011). (a) Primary minerals; (b) accessory minerals.

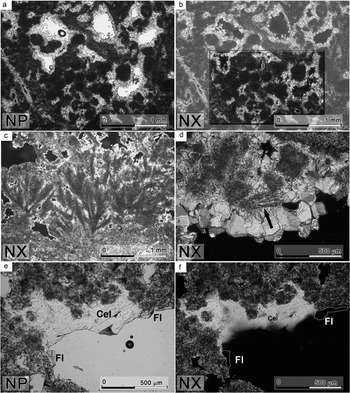
Microphotographs. (a, b) Microphotographs in parallel (NP) and crossed nicols (NX) of travertine with clotted textures; (c) microphotograph in crossed nicols (NX) of travertine with shrub textures; (d) microphotograph in crossed nicols (NX) of neoformed calcite coating a void (the black arrow indicates a muscovite fragment); (e, f) microphotographs showing secondary celestite (Cel) and fluorite (Fl) filling a pore of a sample.

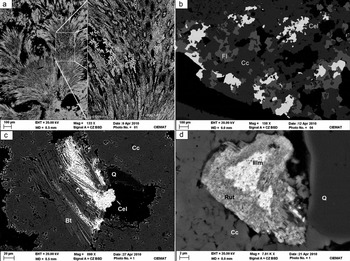
Backscattered electron images showing: (a) micritic shrub textures; (b) secondary celestite and fluorite partially filling the porosity of the sample; (c) secondary celestite substituting a biotite crystal; (d) detrital quartz and ilmenite partially transformed into rutile. Cc – Calcite; Q – Quartz; Cel – Celestite; Fl – Fluorite; Bt – Biotite; Ilm – Ilmenite; Rut – Rutile.

From the analyses determined by XRD it can be concluded that the average calcite content of the travertines varies between 91% and 100% (Fig. 3a and online Supplementary Material A at http://journals.cambridge.org/geo) without significant variations among the different profiles studied. Samples from the Lower Unit consist of 100% calcite. The more abundant accessory minerals, which have only been identified in the Upper Unit, are gypsum, celestite and minor fluorite (Figs 3b, 4e, f, 5b).
Calcite is distributed between the orthochemical fraction, mainly as micrite matrix, and cement. The allochemical fraction is composed of micrite peloids forming clotted textures (Fig. 4a, b). Simple and composite oncolites and carbonate extraclasts are also present in the allochemical fraction, as minor components. The orthochemical fraction is generally more abundant than the allochemical fraction. Micritic shrub structures, which are a common feature in thermogene travertine and responsible for the high intercrystalline porosity of these rocks, are present in less than 5% of the studied samples.
Accessory minerals have only been identified in samples from the Upper Unit. In these profiles (S-1, S-2 and S-3) the existence of gypsum is a common feature, being exclusively identified at the bottom of the Upper Unit, specifically in samples from the S-1 profile and from the bottom of the S-5 profile. Celestite has been detected in samples from the Upper Unit and appears, mostly associated with fluorite, filling the travertine intracrystalline porosity of the carbonate matrix (Figs 4e, f, 5b). Besides this mineral association, neoformed celestite has also been identified filling interlaminar spaces of biotite crystals (Fig. 5c). By contrast, in the Lower Unit no accessory mineral was identified by XRD, while quartz has been detected in just two samples from the Intermediate Unit.
The detrital fraction of the travertine mainly consists of quartz; phyllosilicates, mainly biotite-chlorite and muscovite-illite; schist fragments; and complex fragments of siderite, Fe-oxyhydroxides and kaolinite. Some heavy minerals such as ilmenite, with more or less Fe, rutile, allanite, epidote, zircon, apatite, parisite, celestite and baritocelestite (Fig. 5c, d), are also present in some samples.
Regarding diagenesis, only three minor diagenetic processes have been identified. The most important is the carbonate dissolution that generates a secondary porosity that, in some samples, can be even greater than primary porosity (mainly intergranular and intracrystalline). According to Prado (Reference Prado2011), total porosity of the samples has been estimated at between 12 and 40%.
Besides this dissolution phenomena, two other diagenetic processes have also been identified: (i) calcite cementation, which usually coats the secondary porosity (Fig. 4d); and (ii) recrystallization of the original micrite matrix into microsparite.
4.b. Travertine dating by the U–Th method
The 234U–238U AR of the analysed samples are shown in Table 3. These values are very similar in all samples, ranging between 1.306 and 1.674, and quite similar to those of the Alicún de las Torres thermal waters (Prado & Pérez del Villar, Reference Prado-Pérez and Pérez del Villar2011).
By contrast, major variations have been found in the 230Th/232Th AR, so three different scenarios have been differentiated, and must be taken into account when considering the validity of the absolute calculated ages. The first scenario consists of samples with no or minimal contamination by detrital material, and are characterized by 230Th/232Th > 20. The second scenario is made up of samples with minor detrital material and 230Th/232Th between 7 and 11, and the third group of samples consists of those with 230Th/232Th lower than 7. In terms of absolute ages, nine samples from the Upper Unit have been dated, ranging from 219 ± 30 to 101 ± 11 ka. Up to 11 samples from the Lower Unit were analysed, determining ages from 65.9 ± 4.5 to 39 ± 2.5 ka, and finally, samples from the Intermediate Unit present ages from 25.2 ± 2 and 5.4 ± 0.5 ka (Fig. 6)
Geochronological diagram. Estimated age of samples as dated by alpha spectroscopy. Samples have been grouped according to the corresponding travertine units.

4.c. Palaeoclimatic and palaeoenvironmental implications based on δ18O and δ13C data
The isotopic signatures (δ18O and δ13C) of calcite in the 766 travertine samples were determined and discussed (see online Supplementary Material C at http://journals.cambridge.org/geo) in order to deduce the palaeoclimatic and palaeoenvironmental conditions under which the Alicún de las Torres travertine formation precipitated.
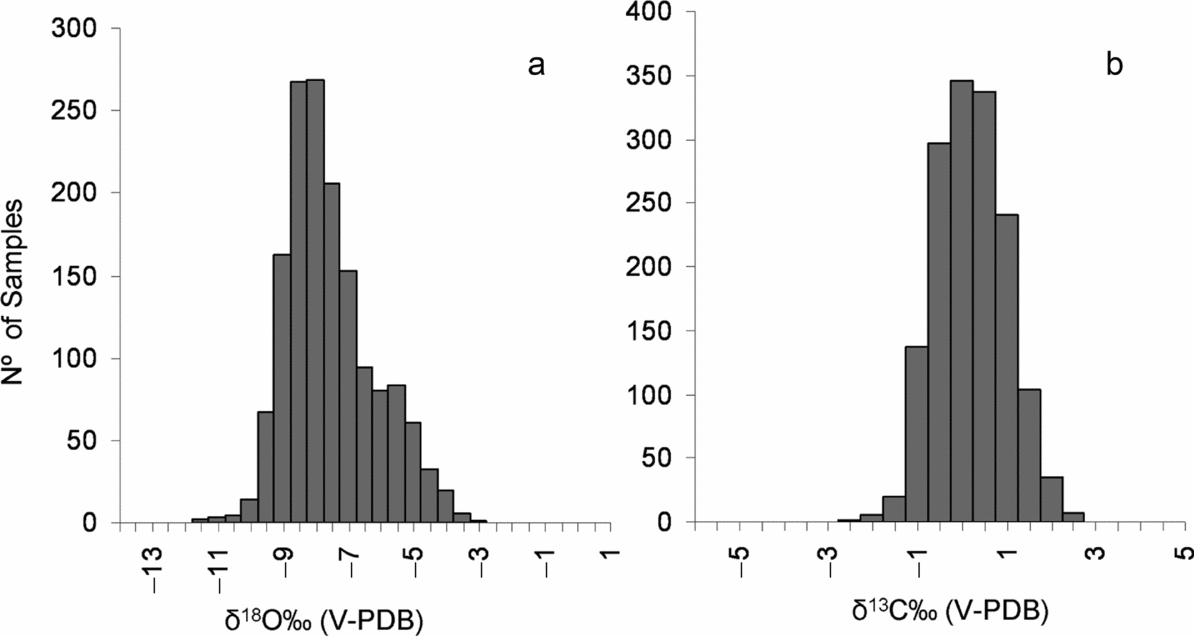
The minimum, maximum and average values, as well as their standard deviations and the frequency histogram of the δ13C and δ18O signatures are shown in Figure 7. The histogram shows that the average δ18O value is approximately −8 ‰(V-PDB), with maximum and minimum values of −3.95 ‰(V-PDB) and −11.64 ‰(V-PDB), respectively. Similarly, the average δ13C value is approximately 0 ‰(V-PDB), showing a smaller dispersion than the δ18O distribution values.
δ18O and δ13C histogram. Histogram of δ18O (a) and δ13C (V-PDB) (b) values.

4.c.1. δ18O record
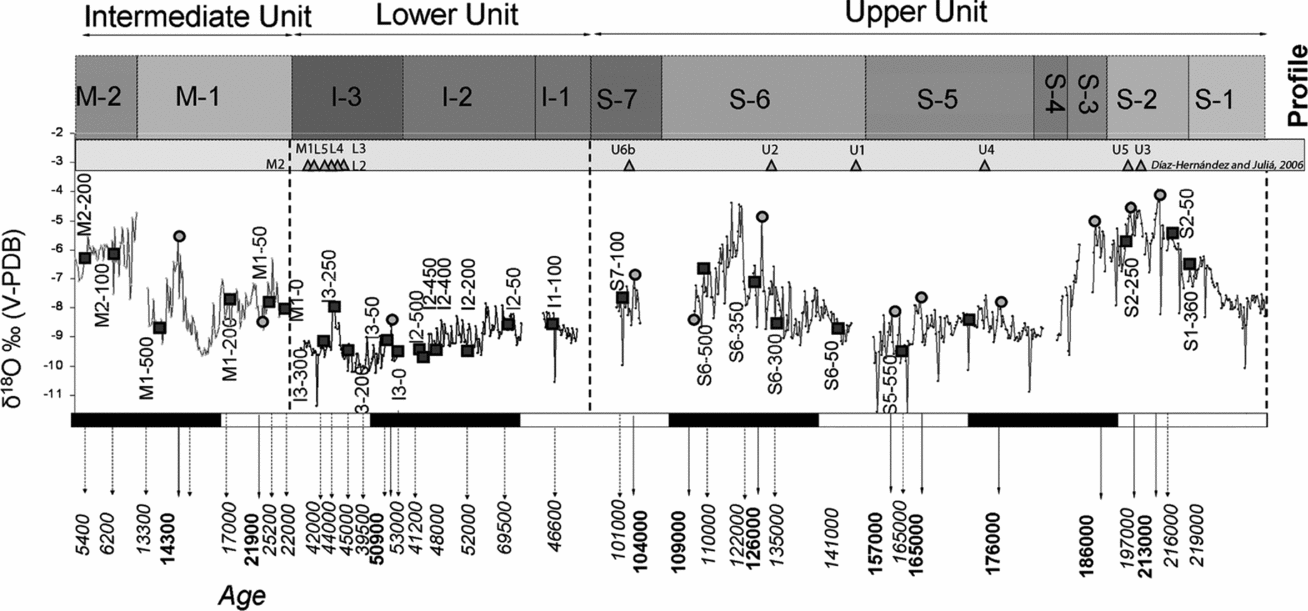
δ18O values are plotted against time in Figure 8. The absolute geochronological data (dark squares in Fig. 8) were complemented by relative data (grey circles in Fig. 8) obtained by comparing the δ18O travertine values with those from both the GRIP and EPICA ice cores (GRIP Members, 1993; Jouzel et al. Reference Jouzel2004), as well as with those geochronological data previously obtained by Díaz-Hernández & Juliá (Reference Díaz-Hernandez and Julia2006) for the same formation.
Geochronological calibration plot of the Alicún de las Torres travertine formation. Absolute ages are represented by figures in italic and by dark squares, while figures in bold and grey circles represent the relative ages.

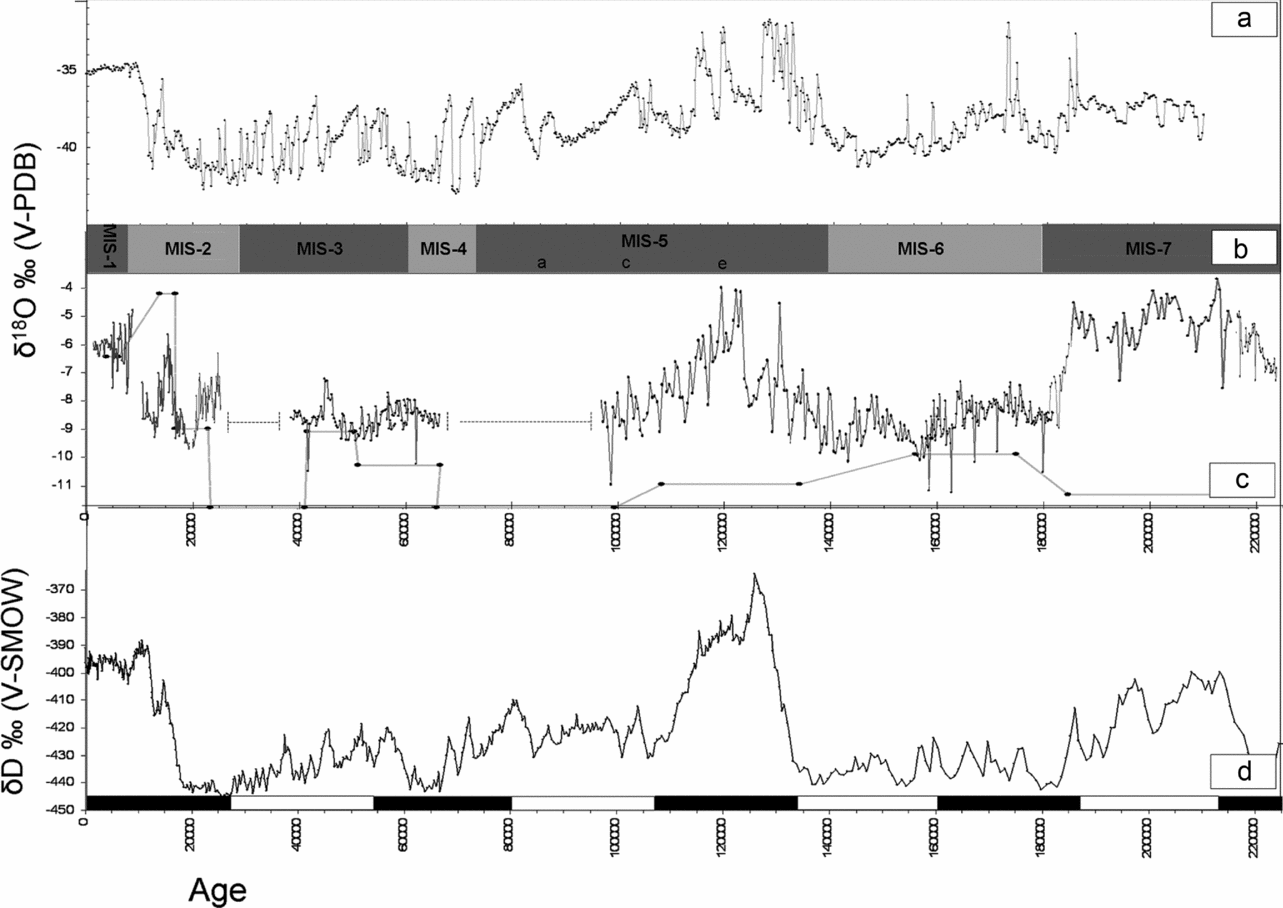
The graphical representation of the oxygen isotopic records (Fig. 9) shows that three main precipitation periods can be identified in the Alicún de las Torres travertine formation: the first, from ~ 220 to 101 ka; the second from ~ 66 to 39 ka; and the third, from ~ 25 ka to the present
Oxygen isotopic record. (a) GRIP δ18O isotopic record (GRIP Members, 1993); (b) Marine Isotope Stages (MIS) (Shackleton & Opdyke, Reference Shackleton and Opdyke1973); (c) Alicún de las Torres δ18O isotopic record; (d) EPICA δD record (Petit et al. Reference Petit, Jouzel, Raynaud, Barkov, Barnola, Basile, Bender, Chappellaz, Davis, Delaygue, Delmotte, Kotlyakov, Legrand, Lipenkov, Lorius, Pepin, Ritz, Saltzman and Stievenard1999).

A detailed summary of the δ18O record is shown in Figures 10 and 11.
Upper Unit oxygen record. Comparison between: (a) oxygen record of the Upper Unit; (b) Marine Isotope Stages and (c) EPICA δD record (Jouzel et al. Reference Jouzel2004). The main climatic trends identified in the Upper Unit, as well as the maximum and minimum δ18O values, are represented by discontinuous and solid arrows, respectively.

Intermediate and Lower Unit oxygen records. Comparison between: (a) GRIP δ18O record (GRIP Members, 1993); (b) oxygen record of the Intermediate and Lower units; (c) Marine Isotope Stages; and (d) EPICA δD record (Jouzel et al. Reference Jouzel2004). The main climatic trends identified in the Intermediate and Lower units, as well as the maximum and minimum δ18O and δD values, are represented by discontinuous and solid arrows, respectively.

Based on the δ18O record, the isotopic record of the Upper Unit (Fig. 10) represents a time span of more than 120 ka, with a resolution higher than 280 years/sample. The highest δ18O values of this unit correspond to periods ranging from ~ 205 to 185 ka and from 140 ka to 124 ka, where the isotopic record presented values around −4 and −5 ‰(V-PDB). However, the period between ~ 179 and 151ka is characterized by higher δ18O variability and shows the lowest δ18O values (around −9 ‰(V-PDB)) of the Upper Unit.
The isotopic record of the Lower and Intermediate units (Fig. 11) represents a time span of ~ 66 ka. The resolution of this record is ~ 151 years/sample. Travertine from the Lower Unit precipitated at the end of the last glaciation, between ~ 66 and 39 ka, and during this period, characterized by the lowest δ18O values (around −9 ‰(V-PDB)), at least three episodes with higher δ18O values (up to −7 ‰(V-PDB)) were also identified. The Intermediate Unit record is more variable than that of the Lower, being characterized by an alternation between periods with low δ18O values (about 19.5 ka and 12 ka ago) and periods in which the highest values of the last 66 ka were identified (14.7–12.5 ka).
4.c.2. δ13C record
Though the accuracy of the δ13C values for temperature estimation is not as great as the δ18O values, the low C fractionation factor during calcite precipitation makes the C isotopic signature (δ13C) an excellent indicator of the C source for each carbonate phase. Moreover, the δ13C values may also be affected by global climate changes, since these values are influenced by the concentration of atmospheric carbon dioxide (p co 2). Consequently, any major climate event may be reflected in the δ13C record obtained from carbonate sediments (Yamamoto, Asami & Iryu, Reference Yamamoto, Asami and Iryu2010). Furthermore, in the case of travertine and similar carbonate rocks, the δ13C isotopic signature is mainly controlled by the dissolved inorganic carbon (DIC) and dissolved organic carbon (DOC) of their parent waters, which, in turn, are influenced by the different C sources existing in the area.
Moreover, variations in the δ13C values may also be related to processes closely linked to climatic events, such as evaporation in arid climates. Under these conditions, a proper vegetal cover development is difficult, while under wetter climatic conditions, when the biomass development is greater, this isotopic signature evolves towards more negative values.
The δ13C values determined in the Alicún de las Torres travertine formation (see Fig. 7) are distributed around an average value close to 0 ‰(V-PDB) (−0.29 ‰(V-PDB)), specifically between −2.72 and 1.97 ‰(V-PDB). These values are represented in Figure 12, where the different sources of C in nature are represented.
Diagram showing the isotopic δ13C signature of samples from the 12 vertical profiles of the Alicún de las Torres travertine formation. In the upper part of the figure, the different surficial sources of C are represented. Only C3 and C4 plants (Deines, Reference Deines, Fritz and Fontes1980), as well as atmospheric CO2 (Friedli et al. Reference Friedli, Lotscher, Oeschger, Siegenthaler and Stauffer1986) are included. Soil CO2 is about 4.5 ‰ heavier than its corresponding plant biomass (C3–C4) (Cerling, Reference Cerling1984, Reference Cerling1991). The isotopic difference between CO2 and DIC depends on pH and temperature. This difference is near 0 ‰ at pH values close to 5, but for pH values between 7.5 and 8, it is relatively independent (Romanek, Grossman & Morse, Reference Romanek, Grossman and Morse1992), becoming enriched at approximately 10 ‰. Therefore, and considering the relatively alkaline environment of the system, the effect of pH can be ignored, and only the temperature effect considered. For the theoretical isotopic calculation (DIC and travertine calcite), a calcite–bicarbonate enrichment of between 1 ‰ and 2 ‰ (independent of the temperature) and the calcite–CO2 equation described by Romanek et al. (Reference Romanek, Grossman and Morse1992), for temperatures of 0°C, 15°C and 30°C, have been considered. Inorganic C sources, as well as the δ13C values of marble and limestone from the system basement are plotted in the bottom of the figure (modified from Reyes et al. Reference Reyes, del Villar, Delgado, Cortecci, Nunez, Pelayo and Cozar1998).

In the Upper Unit record (Fig. 13), from ~ 225 to 214 ka, a period with high input of 12C has been identified, followed by a short period, lasting about 7 ka, during which the organic C contribution was significantly lower, between 5 and 10%. Between ~ 207 and 206 ka, the contribution of 12C decreased below 5%. Between ~ 206 and 184 ka, low and intermediate 12C contribution predominated, always less than 10% and predominantly lower than 5%. From ~ 184 ka to 140 ka, the 12C contribution was always more than 5%, usually above 10%. Approximately 140 ka ago, this last tendency was reversed, turning again to a reduced 12C contribution period, in which three stages with 12C input lower than 5 % have been distinguished, beginning first between ~ 125 and 122 ka. To complete this Upper Unit record, a last stage occurring ~ 117 ka ago has been recognized. During this stage, travertine with a δ13C signature typical of high 12C contribution precipitated once again.
δ13C record from the Upper Unit. Comparison between: (a) main climatic events identified in the Alicún de las Torres site; (b) δ18O record of Alicún de las Torres travertine Upper Unit and (c) δ13C record in the Upper Unit of Alicún de las Torres travertine formation. Dark bars represent the major environmental events that led to an increase in δ13C values, while light bars indicate sharp decreases in this signature.

The δ13C records of the Lower and Intermediate units have also been interpreted (Fig. 14). From these records the following stages have been identified: (i) from ~ 66 to 40 ka, the 12C contribution was higher than 10%, except for the period between ~ 56 and 52.5 ka, when the organic C contribution was lower; and (ii) from ~ 20 ka to the end of the record, an alternation of low 12C input (from ~ 20 to 17.5 ka; from ~ 15.5 to 13.5 ka and from ~ 9 to 6 ka) and high 12C input (from ~ 13.5 to 11 ka and from ~ 6 ka to the end of record) predominated, corresponding to dry and wet seasons, respectively.
δ13C record from the Lower and Intermediate units. Comparison between: (a) main climatic events identified in the Alicún de las Torres site; (b) δ18O record in the Lower and Intermediate units and atmospheric CO2 concentration (smooth grey curve); and (c) δ13C record of the Lower and Intermediate travertine units. In the δ18O record, grey bars represent Heinrich events, while glacial and interglacial periods are represented by light and dark grey, respectively; D-O – Dansgaard-Oeschger event; O.D – Oldest Dryas event; B.A – Bølling-Allerød event; Y.D – Younger Dryas event. In the δ13C record, dark bars represent the major environmental events that led to an increase in δ13C values, while light bars indicate sharp decreases in this isotopic signature.

5. Discussion
5.a. Mineralogy and petrography
The Alicún de las Torres travertine formation shows similar mineralogical, textural and petrographic features to other European thermogene travertine formations (Alonso-Zarza et al. Reference Alonso-Zarza, Martin-Perez, Martin-Garcia, Gil-Pena, Melendez, Martinez-Flores, Hellstrom and Munoz-Barco2011). The XRD study has shown that the travertine composition is eminently calcitic (91–100%), with this mineral distributed between the orthochemical and the allochemical fractions. Moreover, the fact that micritic shrub structures are present in less than 5% of the studied samples may indicate an origin mainly by inorganic precipitation with scarce organic influence.
The occasional presence of gypsum and celestite as secondary minerals can be explained by taking into account the sulphate composition of the Alicún de las Torres thermal waters, as well as the saturation index with respect to both minerals (Prado-Pérez & Pérez del Villar, Reference Prado-Pérez and Pérez del Villar2011). As a consequence, small supplies of SO4 2− may explain the precipitation of both mineral phases. The precipitation of gypsum without celestite may be related to the evaporation processes that took place during the travertine precipitation during the hottest and driest climatic periods. The high F and Ca content in the Alicún de las Torres thermal waters (Prado-Pérez & Pérez del Villar, Reference Prado-Pérez and Pérez del Villar2011) must be responsible for the precipitation of secondary fluorite, which is usually associated with continental carbonates, like celestite.
The detrital fraction of the travertine mainly consists of inherited minerals transported by water, wind or both, and suggests that waters of the thermal system come mainly from the carbonate aquifer hosted in the Alpujárride Complex (Prado et al. Reference Prado2010a ,Reference Prado-Pérez and Pérez del Villar b ; Prado-Pérez & Pérez del Villar, Reference Prado-Pérez and Pérez del Villar2011) where this mineral association is very common (Azañón, García-Dueñas & Goffé, Reference Azañón, García-Dueñas and Goffé1998).
5.b. Travertine dating by the U–Th method
In terms of the calculated ages (see Table 3 and Fig. 6), it is suggested that the Upper Unit was formed from ~ 219 ± 30 to 101 ± 11 ka; the Lower Unit was formed during about 20 ka, between ~ 66 and 39 ± 3 ka; and the Intermediate Unit, which is the younger unit, was formed during the time elapsed between ~ 25.2 ± 2 and 5.4 ± 0.5 ka. However, taking into account the data obtained by Díaz-Hernández, Martín & Juliá (Reference Díaz-Hernández, Martín and Juliá2000) and Díaz-Hernández & Juliá (Reference Díaz-Hernandez and Julia2006) (online Supplementary Material B at http://journals.cambridge.org/geo), this unit could be slightly older.
5.c. Palaeoclimatic and palaeoenvironmental implications based on δ18O and δ13C data
The relatively wide dispersion of the stable isotopic values shown in Figure 7 is consistent with the lack of petrographic evidence for diagenetic processes, which would be expected to result in a homogenization of the isotopic signatures.
5.c.1. Palaeoclimatic implications based on the δ 18O record
It is notable that the identified travertine precipitation periods are consistent with the speleothem precipitation periods compiled by Hennig, Grün & Brunnacker (Reference Hennig, Grün and Brunnacker1983). Periods without carbonate precipitation have also been identified by other authors at middle latitudes in Europe (Atkinson et al. Reference Atkinson, Harmon, Smart and Waltham1978; Hennig, Grün & Brunnacker, Reference Hennig, Grün and Brunnacker1983; Munoz-García et al. Reference Munoz-Garcia, Martin-Chivelet, Rossi, Ford and Schwarcz2007; Martín-Chivelet et al. Reference Martin-Chivelet, Belen Munoz-Garcia, Edwards, Turrero and Ortega2011). The existence of travertine and speleothem precipitation during glacial periods, also identified by other authors (Ford & Williams, Reference Ford and Williams1989; Spötl & Mangini Reference Spötl and Mangini2002; Constantin et al. Reference Constantin, Bojar, Lauritzen and Lundberg2007), can be explained in terms of the latitude at which the Alicún de las Torres thermal system is located. The presence of permafrost during glacial periods at such middle-low latitudes was not as common as it was in Central Europe. At these higher latitudes, the permafrost caused a sharp reduction in available water, while the climatic conditions during glacial periods at lower latitudes should have been be more favourable to travertine precipitation.
The δ18O record (Figs 10, 11) for the travertine precipitation periods was interpreted taking into consideration that this record reflects the palaeoclimatic conditions rather than changes in the precipitation temperature of these travertines (Lister, Reference Lister1988). At middle latitudes, mainly in areas under arid climatic conditions, as in the Guadix-Baza basin, the seasonal influence in the isotopic signature of the rain water is larger than at higher latitudes. During cold and wet periods, when rainfall is higher, the isotopic signature of water is much more negative than during the driest periods (Fontes & Edmunds, Reference Fontes and Edmunds1989; Longinelli & Selmo, Reference Longinelli and Selmo2003).
Taking into account the thermogene character of the studied travertines, the changes observed in the δ18O values do not indicate variations in the precipitation temperature, but instead they suggest changes in the δ18O values of their parent waters (A. Delgado, unpub. Ph.D. thesis, Univ. Granada, 1994). Therefore, according to the equilibrium equation (1) of the calcite–water system (Kim & O'Neil, Reference Kim and O'Neil1987), which relates the δ18O(V-PDB) values of calcite, the δ18O(V-SMOW) values of water in equilibrium and the temperature of carbonate precipitation, the range of δ18O values of water in equilibrium has been calculated.
 \begin{equation}
1000\,\ln \alpha _{({\rm Calcite} - {\rm H}2{\rm O}){\rm }} = 18.03\,(10^3 T^{ - 1} ) - 32.42\quad
\end{equation}
Where: α is the calcite fractionation factor and T is the temperature in K
This equation has been firstly applied to the current travertine deposits, with well-known δ18O values, as well as those of the thermal spring waters. Then, the same methodology has been applied to the ancient travertines, whose δ18O values are also known. Furthermore, a precipitation temperature range similar to the precipitation temperature obtained for the current travertines has been assumed, which is between 21 and 29.5°C (segment A in Fig. 15).
Diagram showing travertine precipitation temperature and δ18O ‰ (V-SMOW) values of the waters. Curves represent the theoretical temperature of calcite precipitation in equilibrium with the waters. The Kim & O'Neil (Reference Kim and O'Neil1987) calcite–water equation has been used for the calculation. From the isotopic data measured in current travertine (samples T−1 to T−4) and thermal current waters (solid line), the precipitation temperature under which current travertines are precipitating has been estimated (segment A).

Consequently, based on the precipitation temperature of the current travertine, and taking into account that the δ18O values of ancient travertine vary between −5.39 and −10.65 ‰ (± 2σ), the range of the δ18O values of the parent waters in equilibrium with ancient travertines varied between −9.4 and −2.4 ‰ (segment B in Fig. 16).
Diagram used to estimate the δ18O ‰ (V-SMOW) values of parent waters. Curves represent the theoretical temperature of calcite precipitation in equilibrium with the parent waters. The Kim & O'Neil (Reference Kim and O'Neil1987) calcite–water equation has been used for calculation. In this case, the travertine δ18O(V-PDB) values as well as the precipitation temperature estimated on the basis of the current travertine/water analysis (see Fig. 7) have been taken into account. For comparison, δ18O values of present thermal waters are represented by a black circle, while present δ18O values of Granada rainwater (pondered average) (Delgado et al. Reference Delgado, Nuñez, Caballero, Jimenez de Cisneros and Reyes1991) is represented by a grey star.

As a result, it is suggested that the travertine with the most positive δ18O values (> −8 ‰(V-PDB)) precipitated in equilibrium with waters with an isotopic signature ranging between −6.6 and −2.4 ‰(V-SMOW) (segment C in Fig. 16). These values are higher than those of the present thermal spring water, and even higher than those of the rain water in Granada, which are approximately −7.5 ‰(V-SMOW) (grey star in Fig. 16) (Delgado et al. Reference Delgado, Nuñez, Caballero, Jimenez de Cisneros and Reyes1991). Therefore, travertines formed in equilibrium with the isotopically more positive parent waters precipitated during periods with the highest evaporation rates, which are characteristic of semiarid environments. Furthermore, these waters are very similar to those of some endorheic lakes in the Iberian Peninsula, which have δ18O values up to +5 ‰ in periods of high evaporation (Valero-Garcés et al. Reference Valero-Garcés, Gonzalez-Samperiz, Delgado-Huertas, Navas, Machin and Kelts2000, Reference Valero-Garcés, Gonzalez-Samperiz, Navas, Machin, Mata, Delgado-Huertas, Bao, Moreno, Carrion, Schwalb and Gonzalez-Barrios2006).
The main interest of the isotopic record of the Upper Unit is that it includes the beginning and the end of the Eemian as well as the end of the MIS-7 stage, which are the last two main interglacial periods until the present time. The beginning of the δ18O record (≈ 219 ka) corresponds with the MIS-7 stage that is characterized, in the Iberian Peninsula, by five alternating warm and cold periods (Florschütz, Menéndez Amor & Wijmstra, Reference Florschütz, Menéndez Amor and Wijmstra1971; Desprat et al. Reference Desprat, Goni, Turon, Duprat, Malaize and Peypouquet2006).
Based on the δ18O record of the Upper Unit, one cold and two warm periods have been identified (Fig. 17). The first warm episode lasted from ~ 205 to 185 ka and corresponds to the end of MIS-7. It is characterized by relative climatic stability, though three short cold episodes have also been identified. Furthermore, a colder period occurred between ~ 179 and 151 ka, which would correspond to the MIS-6 stage, characterized by a higher climatic instability than the previous warm periods. The final section of the δ18O record of the Upper Unit, which lasted from ~ 151 to 107 ka, represents a very important interval of time that includes the MIS-5 stage and the Termination II. This last stage, dated between 140 ka and 124 ka, was characterized by a gradual increase in temperature that is the main feature of the Eemian. Furthermore, the above-mentioned stage includes the transition from the Eemian to the Weichselian (Gibbard & Van Kolfschotten, Reference Gibbard, Van Kolfschoten, Gradstein, Ogg and Smith2004) and the beginning of the last glaciation ~ 115 ka ago.
Main climatic events identified during the Middle and Lower Pleistocene. Glacial and interglacial periods are represented by light and dark grey, respectively. T-1 to T-4 represent the main climatic trends already mentioned in the text, and E-1 and E-2 indicate the main identified climatic events.

This climatic trend suggests that the cooling process occurring from the end of the Eemian was interrupted by several warm episodes, with durations between ≈ 1 and 3 ka. This climatic instability has also been identified elsewhere in Europe and was mainly owing to the alternation of the cold Heinrich and warm Dansgaard-Oeschger events (Sachs & Anderson, Reference Sachs and Anderson2005).
As a consequence, it is suggested that, when the Lower Unit was formed, a minimum of two cold and three warm episodes took place. These episodes correlate with the Heinrich 4 and 5 and to Dansgaard-Oeschger events, respectively.
The Intermediate Unit record begins with some of the most interesting climatic events: the first, which occurred at about 19.5 ka ago, consisted of a sudden cooling that is correlated with the Heinrich 1 event (H-1). This event, also called the Oldest Dryas, lasted until ~ 17 ka ago. It is also identified in other palaeoclimatic records worldwide (Jalut et al. Reference Jalut, Turu i Michels, Dedoubat, Otto, Ezquerra, Fontugne, Belet, Bonnet, Garcia de Celis, Maria Redondo-Vega, Ramon Vidal-Romani and Santos2010; Delmas et al. Reference Delmas, Calvet, Gunnell, Braucher and Bourles2011). At the end of this episode, ~ 17 ka ago, a period of deglaciation that lasted ~ 3 ka began. This period, characterized by warm temperatures and short duration (< 2 ka), correlates with the Bølling-Allerød period (14.7–12.5 ka), which has already been identified in Greenland ice cores (Alley et al. Reference Alley, Meese, Shuman, Gow, Taylor, Grootes, White, Ram, Waddington, Mayewski and Zielinski1993; Rasmussen et al. Reference Rasmussen, Andersen, Svensson, Steffensen, Vinther, Clausen, Siggaard-Andersen, Johnsen, Larsen, Dahl-Jensen, Bigler, Rothlisberger, Fischer, Goto-Azuma, Hansson and Ruth2006).
After this warm period, the climatic trend in the area was reversed again, beginning a new cold episode that lasted up to ~ 12 ka. This episode has also been identified in major palaeoclimatic records and it is known as the Younger Dryas period (Ammann, Reference Ammann2000; Denniston et al. Reference Denniston, Gonzalez, Asmerom, Polyak, Ragan and Saltzman2001). In the Alicún de las Torres site, the Younger Dryas period reached its coldest time between ~ 12.2 and 11.5 ka, ending sharply at the beginning of the last deglaciation episode. This period gave rise to the Holocene in the so-called Termination I.
Contrary to what happened in other sites (Alley et al. Reference Alley, Meese, Shuman, Gow, Taylor, Grootes, White, Ram, Waddington, Mayewski and Zielinski1993; Isarin, Renssen & Koster, Reference Isarin, Renssen and Koster1997), the lack of travertine samples after the Younger Dryas period in Alicún de las Torres has hindered an explanation for this sharp rise in the temperature. However, after this gap, the beginning of the travertine precipitation took place under typical climatic conditions of an interglacial period, similar to those that characterized the Eemian and the Bølling-Allerød. After the Younger Dryas event, and in the overall context of an interglacial period, the travertine precipitated again under cold conditions ~ 9 ka ago. This short episode can be correlated with another similar episode that has been identified between ~ 8.4 and 8 ka, especially affecting Greenland and northern Europe (Barber, Reference Barber1999), and other remote regions, such as China and Africa (Morrill & Jacobsen, Reference Morrill and Jacobsen2005). A summary of all the climatic events identified during the precipitation of the Lower and Intermediate units, which represent a time span of approximately 65 ka, is shown in Figure 18.
Main climatic events identified during Upper Pleistocene and Holocene. Glacial and interglacial periods are represented by light and dark grey respectively; D-O – Dansgaard-Oeschger event; O.D – Oldest Dryas event; B.A – Bølling-Allerød event; Y.D – Younger Dryas event.

5.c.2. Carbon sources and global palaeoenvironmental changes based on the δ13C record
According to Figure 12, C from the studied travertine is essentially inorganic, with δ13C values similar to those of the carbonates from the Blanquizares subunit. These carbonates have δ13C values of approximately 2 ‰(V-PDB) (Prado, Reference Prado2011). In addition, these δ13C values are also consistent with the δ13C values of DIC from the Alicún de las Torres thermal springs, which have an average value of ~ −4 ‰(V-PDB) (Prado, Reference Prado2011). These differences of approximately two δ units between water and travertine can be explained by considering that carbonates are usually enriched in one or two δ units during the precipitation process (Turi, Reference Turi, Fritz and Fontes1986; Romanek, Grossman & Morse, Reference Romanek, Grossman and Morse1992). Besides this, it is necessary to take into account that the recharging water usually incorporates 12C from vegetal cover (Cerling, Reference Cerling1984, Reference Cerling1991), which causes this slight shift towards more negative values.
In this sense, and considering that the C isotopic signature from the vegetal cover is approximately −27‰ (Deines, Reference Deines, Fritz and Fontes1980; Oh-Hama, Reference Oh-Hama1982), and that the δ13C of carbonates from the Blanquizares subunit is ~ 2.55 ‰, the organic C contribution in Alicún de las Torres travertine can be estimated by means of equation (2):
 \begin{equation}
{\rm \% C_{org}} = \frac{{{\rm (100} \times \delta ^{13} {\rm C_{trav}} - \delta ^{13} {\rm C_{Blanq})}}}{{{\rm (}\delta ^{13} {\rm C_{Blanq}} + \delta ^{13} {\rm C_{edaf})}}}\end{equation}
Where: % Corg = organic C in %
δ13Ctrav = travertine isotopic signature
δ13CBlanq = inorganic source isotopic signature (2.55 ‰(V-PDB)) (Prado et al. Reference Prado-Pérez and Pérez del Villar2010b )
δ13Cedaf = organic source isotopic signature (−27 ‰(V-PDB)) (Deines, Reference Deines, Fritz and Fontes1980; Oh-Hama, Reference Oh-Hama1982)
The graphical representation of this equation for the studied samples (Fig. 19) has allowed an estimation of the organic C contribution in the Alicún de las Torres travertine, ranging between 2.4 and 17.5%. These values indirectly indicate the degree of development of vegetal cover in the studied area, directly related to the relative humidity.
Graphical representation of the δ13C isotopic signature depending on the 12C contribution. The maximum and minimum figures represent the extreme δ13C values measured in Alicún de las Torres travertine formation.

Evolution of the δ13C values (see Figs 13, 14) shows alternating cycles with periods characterized by predominantly high δ13C values, similar to those measured in the CO2 from the dissolution of the basement limestone, along with other with more negative δ13C values. This enrichment in 12C may be owing to a greater biomass development in the area, probably during wet periods, which would contribute to a significant decrease in the δ13C values (Cerling, Reference Cerling1984, Reference Cerling1991). Contributions from other processes, such as degassing and isotopic exchange with atmospheric CO2, cannot be discounted.
In order to delimit periods of greater or lesser contribution of 12C, an organic C enrichment of 5 and 10%, as calculated from equation (2), have been chosen as cut-off values.
5.c.3. Integrated interpretation of the δ 18O and δ 13C records
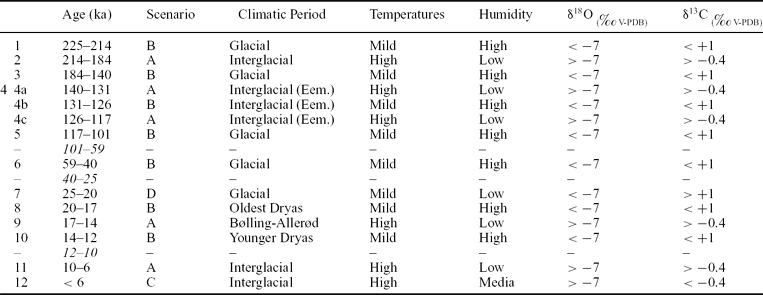
The main palaeoenvironmental periods identified by means of the δ13C record have been integrated with the main palaeoclimatic stages previously identified based on the δ18O record (Figs 20, 21). This interpretation has allowed the establishment of 12 different periods, which are characterized by their own temperature and humidity features (Table 4). Finally these 12 climatic periods have been grouped into four climatic scenarios based on their palaeoenvironmental features, including temperature and relative humidity conditions. These four scenarios have been defined from the representation of δ18O versus δ13C values (Fig. 22)
Identified palaeoclimatic periods in this study

Integrated δ18O and δ13C interpretation (Upper Unit). (a) 1 – Chronostratigraphy. 2 – The main glacial and interglacial periods identified in the travertine Upper Unit. 3 – Estimated 12C contribution from the δ13C record. (b) δ18O record. (c) δ13C record. (d) Major climatic episodes identified in the travertine Upper Unit (see Table 4).

Integrated δ18O and δ13C interpretation (Lower and Intermediate Units). (a) 1 – Chronostratigraphy. 2 – The main glacial and interglacial periods identified in the travertine Lower and Intermediate units; 3 – Estimated 12C contribution from the δ13C record. (b) δ18O record. (c) δ13C record. (d) Major climatic episodes identified in the travertine Lower and Intermediate units (see Table 4).

Climatic scenarios and palaeoclimatic implications. Representation of δ18O values versus δ13C values of Alicún de las Torres travertine formation. The palaeoclimatic implications of these values are represented on the X and Y axes of the graph, while, within the graph, the 766 analysed samples are plotted and grouped into the four climatic scenarios defined for the Guadix-Baza basin.

Scenario A consists of periods characterized by high temperatures and low humidity. These arid conditions hindered the development of vegetal cover leading δ13C values to be higher than −0.4 ‰(V-PDB). Occasionally, these values are even above +1 ‰(V-PDB), which are very similar to those of the limestone and marbles of the Blanquizares Unit that form the basin basement. This scenario has been identified during the major interglacial periods, especially in periods 2, 4a, 4c, 9 and 11 (see Table 4). This climatic scenario correlates with other arid or semiarid periods observed in other climatic records also studied at similar latitude to the Iberian Peninsula, such as in the La Mancha region, specifically in Las Tablas de Daimiel marshlands (Dorado Valiño et al. Reference Dorado Valiño, Valdeolmillos Rodríguez, Blanca Ruiz Zapata, José Gil García and De Bustamante Gutiérrez2002; Valdeolmillos-Rodríguez et al. Reference Valero-Garces and Moreno2011). It also correlates with other periods established in the Guadix-Baza basin (Ortiz et al. Reference Ortiz, Torres, Julia, Delgado, Llamas, Soler and Delgado2004b , Reference Ortiz, Torres, Delgado, Reyes, Llamas, Soler and Raya2006). Similar arid periods have also been identified in the El Padul site (Pons & Reilles, Reference Pons and Reille1988, Ortiz, Reference Ortiz, Torres, Delgado, Julia, Lucini, Llamas, Reyes, Soler and Valle2004a , Reference Ortiz, Torres, Delgado, Llamas, Soler, Valle, Julia, Moreno and Diaz-Bautista2010) and in the surroundings of the Sierra Nevada (Granada) (Jiménez-Moreno & Anderson, Reference Jiménez-Moreno and Anderson2012), both geographical areas with the same arid features.
Scenario B consists of periods within glacial epochs, in which, unlike scenario A, high humidity conditions prevailed, resulting in significant development of vegetal cover. Consequently, these conditions modified the δ13C signature of travertine towards more negative values. This climate scenario has been identified during major glacial periods, especially during periods 1, 3, 4b, 5, 6, 8 and 10 (see Table 4). Similarly to scenario A, there are many other records from the Mediterranean region, in which periods characterized by similar climatic conditions have been identified (Dorado Valiño et al. Reference Dorado Valiño, Valdeolmillos Rodríguez, Blanca Ruiz Zapata, José Gil García and De Bustamante Gutiérrez2002; Ortiz et al. Reference Ortiz, Torres, Julia, Delgado, Llamas, Soler and Delgado2004b , Reference Ortiz, Torres, Delgado, Reyes, Llamas, Soler and Raya2006; Valdeolmillos-Rodríguez et al. Reference Valdeolmillos-Rodriguez, Dorado-Valino, Blanca Ruiz-Zapata and Maria Alonso-Zarza2011; Jiménez-Moreno & Anderson, Reference Jiménez-Moreno and Anderson2012). A climatic amelioration towards a cold and humid climate during the last 13 ka has also been recorded in the El Padul site (Granada) (Pons & Reilles, Reference Pons and Reille1988; Ortiz, Reference Ortiz, Torres, Delgado, Julia, Lucini, Llamas, Reyes, Soler and Valle2004a , Reference Ortiz, Torres, Delgado, Llamas, Soler, Valle, Julia, Moreno and Diaz-Bautista2010).
Scenario C includes interglacial periods with warmer temperatures but, unlike scenario A, with optimal humidity conditions for the proper development of vegetal cover. This scenario has only been identified at the end of the Holocene, especially during the twelfth period (see Table 4). Furthermore, it well correlates with the three episodes identified in the El Padul site (Pons & Reilles, Reference Pons and Reille1988; Ortiz, Reference Ortiz, Torres, Delgado, Julia, Lucini, Llamas, Reyes, Soler and Valle2004a , Reference Ortiz, Torres, Delgado, Llamas, Soler, Valle, Julia, Moreno and Diaz-Bautista2010).
Scenario D consists of a single period characterized by low temperatures, similar to those of scenario B, and low humidity, similar to that of scenario A. This last feature prevented major plant development in the area, leading the δ13C signature of the travertines towards more positive δ13C values. This scenario has only been identified during period 7 (see Table 4), and in the El Padul site during the last 13 ka (Pons & Reilles, Reference Pons and Reille1988; Ortiz, Reference Ortiz, Torres, Delgado, Julia, Lucini, Llamas, Reyes, Soler and Valle2004a , Reference Ortiz, Torres, Delgado, Llamas, Soler, Valle, Julia, Moreno and Diaz-Bautista2010).
Scenarios C and D, although having also been identified in other studies carried out in the Mediterranean region, such as at the El Padul site (Pons & Reilles, Reference Pons and Reille1988; Ortiz, Reference Ortiz, Torres, Delgado, Julia, Lucini, Llamas, Reyes, Soler and Valle2004a , Reference Ortiz, Torres, Delgado, Llamas, Soler, Valle, Julia, Moreno and Diaz-Bautista2010), are more common in studies performed in Atlantic regions and/or at higher latitudes (Jouzel et al. Reference Jouzel, Masson, Cattani, Falourd, Stievenard, Stenni, Longinelli, Johnsen, Steffenssen, Petit, Schwander, Souchez and Barkov2001; Stenni et al. Reference Stenni, Masson-Delmotte, Johnsen, Jouzel, Longinelli, Monnin, Rothlisberger and Selmo2001; Augustín et al. Reference Augustin, Barbante, Barnes, Barnola, Bigler, Castellano, Cattani, Chappellaz, Dahl-Jensen, Delmonte, Dreyfus, Durand, Falourd, Fischer, Fluckiger, Hansson, Huybrechts, Jugie, Johnsen, Jouzel, Kaufmann, Kipfstuhl, Lambert, Lipenkov, Littot, Longinelli, Lorrain, Maggi, Masson-Delmotte, Miller, Mulvaney, Oerlemans, Oerter, Orombelli, Parrenin, Peel, Petit, Raynaud, Ritz, Ruth, Schwander, Siegenthaler, Souchez, Stauffer, Steffensen, Stenni, Stocker, Tabacco, Udisti, Van De Wal, Van Den Broeke, Weiss, Wilhelms, Winther, Wolff, Zucchelli and Members2004; Jalut et al. Reference Jalut, Turu i Michels, Dedoubat, Otto, Ezquerra, Fontugne, Belet, Bonnet, Garcia de Celis, Maria Redondo-Vega, Ramon Vidal-Romani and Santos2010; Jiménez-Moreno & Anderson, Reference Jiménez-Moreno and Anderson2012), where glacial and dry periods prevailed.
6. Conclusions
The integrated study of the δ18O and δ13C records from the Alicún de las Torres travertine formation, as well as the dating of the three units that constitute this formation, suggest the following conclusions:
(1) The travertine began to precipitate in the area at least ~ 219 ka ago. The Upper Unit precipitated between 219 ± 30 and 101 ± 11 ka. The Lower Unit precipitated around 65.9 ± 4.5 to 39 ± 3 ka. The last unit to form was the Intermediate Unit, which precipitated in stratigraphic continuity with the previous units during the period of 25.2 ± 2 to 5 ± 0.5 ka.
(2) Current travertine is precipitating under an equilibrium temperature ranging between 21 and 29.5°C. It has been determined that the δ18O values of waters from the thermal springs ranged between −9.4 and −2.4 ‰(V-SMOW) during the travertine precipitation. This wide range suggests that, during the travertine precipitation process, several major climatic changes took place, from cold periods to others with severe aridity and higher evaporation rates that modified the isotopic composition of the parent waters.
(3) Carbon involved in the travertine precipitation comes mainly from the dissolution of limestone and marble belonging to the Alpujárride Blanquizares subunit. However, a small 12C proportion from the vegetal cover influenced the δ13C signature of the travertines. The estimated 12C contribution has allowed the determination of the humid or arid palaeoenvironmental conditions that prevailed during all the identified climatic periods.
(4) The integrated study of the δ18O and δ13C signature of the travertine formation has also permitted a comprehensive palaeoclimatic reconstruction of the last 219 ka in the Guadix-Baza basin. During this time, 12 climatic periods have been distinguished and grouped into four climatic scenarios: (i) scenario A, consisting of periods characterized by high temperatures and low humidity (warm and dry periods); (ii) scenario B, composed of glacial periods, during which more humid conditions prevailed (cold and humid periods); (iii) scenario C, that includes the interglacial periods with warm temperatures but with optimal humidity conditions, under which a significant vegetal cover was developed (warm and humid periods); and (iv) scenario D, characterized by glacial conditions as scenario B, but with less relative humidity (cold and dry periods). Among them, the most common scenarios are A and B, in which up to four warm and dry periods (scenario A) and six cold and humid periods (scenario B) have been identified. This palaeoclimatic evolution suggests that glacial periods in the Mediterranean regions were characterized by higher precipitation, and that more arid conditions prevailed during interglacial periods
This result is consistent with other palaeoclimatic studies conducted at similar low latitudes where the climatic conditions were characterized by an alternation between arid and high temperature periods with other warmer and more humid periods. The palaeoclimatic conditions identified in both scenarios are the opposite of those defined in higher latitudes, where permafrost conditions prevailing during glacial periods drastically reduced the amount of available water, and available water was high during interglacial periods leading to a greater biomass. This fact suggests that, during the last 219 ka, the palaeoclimatic evolution in the Mediterranean region widely diverged from that defined at higher latitudes.
Acknowledgements
This work has been carried out in the framework of a Singular Strategic Project (PSE-120000-2008-6) devoted to the CCS's technologies, especially in the sub-project PSS-120000-2008-31, focused on the CO2 storage, as well as projects CGL2010-21257-C02-01 and CGL2007-65572-C02-01/BTE. The former project has been supported by the Spanish Ministry of Science and Innovation and the EU FEDER funds. The authors are very grateful to Raul Saldaña and Dr Arsenio Granados for their collaboration in the field campaigns, as well as to the technical and management team of the Alicún de las Torres spa for the facilities provided during the sampling. We want also to thank the two anonymous referees for their suggestions and interest shown in ameliorating this work, as well as Dr M. J. Herrero and Dr T. Smith for the English revision of the manuscript. Finally, we acknowledge the editor of Geological Magazine Dr Phil Leat for his comments and suggestions that also undoubtedly improved the manuscript.