1 Introduction
Research from many countries around the world shows not only that individuals display low levels of financial literacy but also that financial illiteracy can be linked to lack of financial planning and insufficient resources in retirement (Lusardi and Mitchell, Reference Lusardi and Mitchell2011a , Reference Lusardi and Mitchell2014). Using the data recently collected via a questionnaire especially designed to be comparable with surveys administered in a number of other countries (Australia, France, Germany, Italy, Japan, the Netherlands, New Zealand, Romania, Russia, Sweden, Switzerland, and the USA, which have participated in the Financial Literacy around the World (FLat World) project), this paper aims to assess how Canadians fare in terms of financial literacy and retirement planning.
The Canadian case is important for many reasons. For decades, Canada has had some of the lowest levels of poverty among seniors (see, e.g., OECD, 2011). Although old-age poverty seems to be changing according to recent and forecasted trends (Fréchet, Reference Fréchet, Rheault and Poirier2012; OECD, 2013; Clavet et al., Reference Clavet, Duclos, Fortin and Marchand2013), public retirement programs provide a high income replacement ratio, typically from 60% to 90% or more, for workers with earnings below the median.Footnote 1 For those individuals, retirement planning may be relatively simple.Footnote 2
On the other hand, retirement planning can be particularly important for Canadians earning above the median income. Income floor programs (the so-called first pillar) in combination with compulsory public savings plans (the second pillar) do not guarantee a sufficiently high replacement ratio. Indeed, these programs provide retirement income capped at approximately CA$19,000 per year in 2014, meaning that replacement ratios decline to well below 50% for those earning above the median. Hence, workers in these earnings brackets need to put aside additional savings (the so-called third pillar) to ensure that their retirement income adequately replaces earnings, for example through an employer-sponsored pension plan or tax-sheltered vehicles. In recent years, much of the policy debate has revolved around the question of whether middle- and high-income Canadians are saving enough for retirement. Other important trends are also taking place, including a shift from defined-benefit (DB) to defined-contribution (DC) pension plans, though this has been more limited in Canada than elsewhere (Gougeon, Reference Gougeon2009),Footnote 3 and a decline in the coverage of private-sector employer-sponsored plans, which may have stabilized (Milligan and Schirle, Reference Milligan and Schirle2014).
Proposed reforms have followed two strands. The first strand has focused on expanding the second pillar (the contributory Canada Pension Plan and its sister Quebec Pension Plan; see for instance Wolfson, Reference Wolfson2011, Reference Wolfson2013; Milligan and Schirle, Reference Milligan and Schirle2014, for an overview), and sometimes the first and third pillars (see, respectively, Ambachtsheer, Reference Ambachtsheer2008; Townson, Reference Townson2009, for examples). One argument often made is that Canadians have low levels of financial literacy and thus expansion of relatively simple mandatory programs may be advantageous. Conversely, it is of course possible that enhancing Canadians’ financial literacy may lead to improvement in their financial situation and savings.
The second strand focuses on voluntary savings plans. One change to the third pillar is currently being gradually implemented at the federal level and in some provinces: Pooled Retirement Pension Plans (PRPPs), which are being legislated under various names in each province. PRPPs are individual accounts with ‘group investment options’ offered by private financial institutions. Accounts include additional features such as automatic enrollment and default options, and the inclusion of these options can be linked to the notion that purely voluntary savings programs are unlikely to be effective due, among other factors, to lack of financial knowledge. Yet again, financial literacy could also be beneficial to promote retirement savings in these accounts.
The Task Force on Financial Literacy recommended in its 2010 report ‘that employers offer automatic saving programs and tools to facilitate increased lifelong saving by Canadians, drawing on international best practices in this area’ (Task Force on Financial Literacy, 2010). The report also emphasized the importance of financial literacy – not merely for retirement planning but for other reasons as well – and recommended ‘the appointment of a Financial Literacy Leader to coordinate efforts in the implementation of a national strategy for financial literacy in Canada’ (FCAC, 2014). Legislation was adopted in 2013 to appoint such a person within the Financial Consumer Agency of Canada (FCAC),Footnote 4 thus expanding for the third time since 2007 the mandate of this federal agency, which ‘was created in 2001 to protect and educate consumers of financial services’ (ibid.). In June 2015, the FCAC launched Count me in, Canada, its National Strategy for Financial Literacy, which aims to help Canadians manage money and debt wisely, plan and save for the future, and prevent fraud and financial abuse. This paper addresses FCAC's ‘planning and saving’ goal by investigating the extent to which financial literacy is associated with retirement planning, and comparing Canadians’ results with those from other countries.
Existing evidence revealed low levels of financial literacy in Canada (Task Force on Financial Literacy, 2010; MacKay, Reference MacKay2011; Mullock and Turcotte, Reference Mullock and Turcotte2012; Lalime and Michaud, Reference Lalime and Michaud2014). However, this evidence drew mostly from the 2009 Canadian Financial Capability Survey, which did not use questions comparable with those used in other countries. Comparisons can be useful as they highlight similarities and differences across countries. They can also draw attention to important features of the data, for example the groups that consistently display the lowest levels of financial literacy, irrespective of institutional setting, and the effects of financial illiteracy.
In Section 2, we discuss the survey and data collection method. In Section 3, we present the empirical evidence on the level of financial literacy and retirement planning. We then compare results with those obtained from other countries and discuss the implications of our findings for public policy.
2 The survey
In Canada, securities regulation and oversight is done at the provincial level. Consequently, there are 13 provincial and territorial securities administrators, collectively known as the Canadian Securities Administrators (CSA). In 2012, the CSA sponsored a third edition of a survey that had been fielded in 2006 and 2009, mainly aimed at investigating and measuring various aspects of investment knowledge and behavior among Canadians.
The survey was conducted over the Internet between May 17 and May 31, 2012, in both French and English, using a national panel run by Innovative Research. Respondents were drawn from nationally representative samples and were offered a chance to win CA$1,000. Data were weighted to ensure the sample was representative of the Canadian population.Footnote 5 A total of 6,911 Canadians were interviewed. Important for our purpose is that 2012 was the first year in which the survey included the three specific questions designed to measure financial literacy that have been used in more than 12 other countries.Footnote 6
3 Empirical evidence
3.1 How financially literate are Canadians?
3.1.1 Measurement of financial literacy
We report below the wording of the three questions – taken from the questionnaire originally designed by Lusardi and Mitchell (Reference Lusardi, Mitchell, Lusardi and Mitchell2011b ) – that were used to measure financial literacy among Canadian respondents.
Understanding of Interest Rates
Suppose you had $100 in a savings account and the interest rate was 2% per year. After 5 years, how much do you think you would have in the account if you left the money to grow? More than $102; Exactly $102; Less than $102; Don't know.
Understanding of Inflation
Imagine that the interest rate on your savings account was 1% per year and inflation was 2% per year. After 1 year, how much would you be able to buy with the money in this account? More than today; Exactly the same; Less than today; Don't know.
Understanding of Risk and Diversification
Is the following statement true or false? Buying a single company's stock usually provides a safer return than a stock mutual fund. True; False; Don't know.
The first question measures numeracy/interest compounding, or the capacity to do a simple calculation related to interest rates. The second question measures understanding of inflation, again in the context of a simple financial decision. The third question is a joint test of knowledge about stocks and stock mutual funds and about risk diversification, since knowing the answer to this question requires knowledge of what a stock is and that a mutual fund is composed of many stocks, in addition to knowing about the workings of risk diversification.
These questions are relevant for most respondents in Canada, albeit with different degrees of salience for different age groups. For instance, only older individuals (40 or 50 years and older at the time of survey) are likely to have experienced high inflation, since the last inflationary episode took place in the early 1980s (during that period, inflation was at 10%–12%). Since 1991 the Bank of Canada has followed a monetary policy based on a 2% inflation target. Older respondents may also have the most experience with the power of interest compounding, as individuals over 40 – and even more so, those over 60 – will likely remember the high mortgage rates of the same period.
Topics such as compound interest, inflation, and the stock market have been taught in varying ways across Canada over the years, and many middle-aged individuals are likely to have had some exposure to these topics in school. In Quebec, for instance, these topics were taught for several decades as part of a mandatory 12th grade economics course; however, this course was dropped from the curriculum in 2009, meaning that individuals under 20 in 2012 will not have been exposed to it. On the other hand, a new optional course is being contemplated; British Columbia introduced a mandatory course in 2004; and Ontario specifically introduced financial literacy elements into its curricula in 2011. Moreover, since Canada – Quebec in particular – performs well in mathematics on the Programme for International Student Assessment (PISA; see Knighton et al., Reference Knighton, Brochu and Gluszynski2010), one may expect a relatively high level of financial literacy among the adult population (Jappelli, Reference Jappelli2010; Jappelli and Padula, Reference Jappelli and Padula2013).
From the early 1990s onwards, incentives for individuals to contribute to retirement savings plans have been enhanced with the expansion of tax-deferred vehicles and other initiatives (for example, indexation of the contribution ceiling for the Registered Retirement Savings Plan, or RRSP,Footnote 7 and creation of the Tax-Free Savings Account, or TFSAFootnote 8 ). As a result, the value of households’ direct investments in financial markets – as opposed to those held through a collective vehicle, such as a pension plan – has risen significantly as a multiple of earnings over the last 30 years (Horner, Reference Horner2009). The proportion of households owning direct equity is now among the highest in the world (Grout et al., Reference Grout, Megginson and Zalewska2009), so Canadians should be rather familiar with concepts related to risk and portfolio diversification.
3.1.2 Evidence on financial literacy
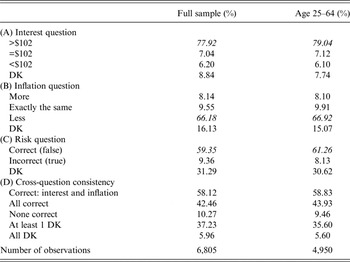
In Table 1, we present the distribution of answers to each of the three financial literacy questions as well as the distribution of answers to all three questions. Over three-quarters of survey respondents correctly answered the compound interest question and more than one in ten got this question wrong. About two-thirds correctly answered the question about inflation and more than 17% of respondents got this question wrong. The question that elicited the lowest number of correct answers was the question about risk diversification: 59% of respondents answered this question correctly. Moreover, the pattern of responses changes when looking at risk diversification; more than 30% of respondents indicated they did not know the answer to this question, while the proportion of ‘do not know’ answers was much lower for the questions on interest rates and inflation (9% and 16%, respectively). Results are very similar whether looking at individuals of working age (age 25–64) or at the population as a whole. Considering all questions together, only about 42% of respondents correctly answered all three questions and more than 37% of respondents answered with at least one ‘do not know’ response.
Summary statistics on the three financial literacy questions

Notes: Distribution of responses to the financial literacy questions in full sample and for those age 25–64. All figures are weighted. DK indicates respondent does not know the answer. Italics indicate the correct answer to each question.
These findings are strikingly similar to those from other countries. For example, studies from the USA, Germany, and Japan – to mention but a few countries that are geographically diverse but have similar financial markets – report similar findings, with a higher rate of correct responses to the interest rate and inflation questions, but a lower one for the risk diversification question. Moreover, the question about risk diversification is the one that elicits the highest number of ‘do not know’ responses across countries. For example, ‘do not know’ responses are 34% and 32% in the USA and Germany, respectively, and as high as 56% in Japan. In many countries, the number of respondents who can correctly answer all questions is rather low; for example 30% in the USA and 45% in the Netherlands.Footnote 9 Percentages are somewhat higher in Germany, with 53% of respondents able to answer all three questions correctly.
3.2 Who knows the least?
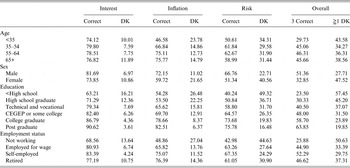
Table 2 shows the distribution of responses to the financial literacy questions across demographic groups. To be able to compare with other countries, we considered the distribution of responses across age, sex, educational attainment, and employment status. Although in a single cross-section we cannot distinguish between age and cohort effects, there is an inverse U-shaped pattern of responses across age, with the young normally having the lowest percentage of correct answers, and the rate of correct answers again showing a (small) decline with age. In all cases however, individuals younger than 35 performed worse than older individuals.Footnote 10
Distribution of responses to financial literacy questions by age, sex, education level, and employment status

Notes: All figures are weighted. DK indicates respondent does not know the answer. ‘Not working’ includes students, homemakers, and the unemployed.
Women performed worse than men on all three questions. Not only is the proportion of correct answers lower for women, but for each question, women were more likely than men to have selected the ‘do not know’ option, with the proportion particularly high for the risk diversification question, to which more than 40% of women replied ‘do not know.’
There is also a strong education gradient, with individuals with greater educational attainment displaying a higher level of financial literacy. The proportion of respondents answering with ‘do not know’ decreases as education level increases.
Retired respondents had the highest proportion of correct answers to the inflation question. But on the other questions, the self-employed performed best. These two groups performed somewhat better than employed respondents on inflation and overall, but on interest and risk, employed individuals were more knowledgeable than retirees. Individuals who were not working (students, homemakers, and the unemployed) performed worst on all questions.
These findings are again very consistent with the evidence from other countries; the young, women, those with low educational attainment, and individuals who are not working are consistently found to display low levels of financial literacy internationally. In particular, there are striking similarities in the gender differences in financial literacy; the pattern that is found in Canada very closely mirrors the evidence from other countries. These patterns are one reason why international comparisons can be quite informative.
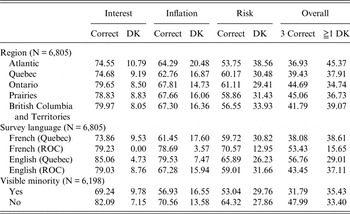
Given the regional differences that have been found in Italy, Russia, and the USA, we looked at financial literacy differences by Canadian province/region.Footnote 11 We also looked at differences by self-reported visible minority status, and according to the language in which the respondent took the survey. Results are shown in Table 3.
Distribution of responses to financial literacy questions by region, language, and self-reported visible minority status

Notes: All figures are weighted. DK indicates respondent does not know the answer. ROC refers to Canada outside Quebec (‘rest of Canada’).
There are slight differences in financial literacy across regions: respondents in Quebec and the Atlantic provinces performed poorly on the interest and inflation questions, while respondents on the coasts (British Columbia and Atlantic) did worse on risk diversification. Overall, respondents from Ontario and the Prairies performed best, while those from the Atlantic Provinces did the worst. Differences were not very large, however; there was no single question on which the difference between the ‘most literate’ and the ‘least literate’ region exceeded 10 percentage points.
The picture is somewhat different when looking at the results according to language (i.e., whether the survey was taken in French or English).Footnote 12 French respondents in Quebec do worse than English respondents in Quebec. French respondents in the rest of Canada do better than French respondents in Quebec and even than English respondents in Quebec and the rest of Canada, apart from the question on risk diversification. The picture is also different when comparing language minorities (English in Quebec vs. French in other provinces) and majorities (French in Quebec vs. English elsewhere). Among the minorities, English respondents do better on risk and overall, while their results are similar to French respondents on interest and inflation. English respondents from outside Quebec do better than French respondents from Quebec, except on risk. In all cases except on risk, English respondents from Quebec fare best, while French respondents from Quebec fare worst. These are only univariate statistics, not controlling for the other differences that are mentioned earlier in the table. Given the importance of these findings, we also perform a multivariate analysis. Interestingly, regional and language differences apparent in Table 3 all but disappear when controlling for educational attainment in a regression framework.Footnote 13 Hence, the gap is almost entirely explained by differences in education across regions.
Finally, self-declared ‘visible minority status’ seems to be strongly correlated with lower financial literacy. Respondents who identify themselves as belonging to a visible minority fare much worse, on average, than those who do not. The success rate is much lower on all questions (by 11–15 percentage points) as well as overall (16 percentage points). Contrary to the regional/language differences, this result does not go away when controlling for income, employment status and, most importantly, educational attainment.
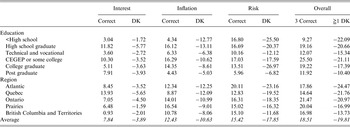
Given that regional differences seem entirely attributable to differences in educational attainment, we investigate the extent to which regional and educational differences could be at play with the observed male-female gap in Canada. We do this by first reporting, in Table 4, the male-female differences in success rates on the financial literacy questions, broken down by language and educational attainment. Other than a possibly smaller gap at the higher education levels and in British Columbia, the table shows no clear patterns in the male-female differences. We therefore carry out the same exercise as above (for regional differences). We find that gender differences in financial literacy do not hinge on differences in educational attainment, or on regional differences.Footnote 14 The gender gap in financial literacy seems to hold regardless of the many variables we include in the regressions.
Male-female differentials in financial literacy by education level and region, in percentage points

Notes: The differential is between male and female proportions (male % – female %), so a positive (negative) figure indicates that the difference is in favor of males (females). All figures are weighted. DK indicates the respondent does not know the answer. ROC refers to Canada outside Quebec (‘rest of Canada’).
3.3 Does financial literacy matter?
We turn next to examining the link between financial literacy and retirement planning. Planners are defined as those who have any type of voluntary savings. This is a broad measure, but the wording of the survey question makes it appropriate as far as retirement planning is concerned (we label as planners respondents who select answers #1, #2 or #3 to the question below):Footnote 15
Do you personally have any savings or investments set aside for the future? This could be either in or outside of an RRSP, Registered Retirement Income Fund (RRIF) or Tax-Free Savings Account (TFSA). Check all that apply.
-
1. Savings or investments IN an RRSP, RRIF or pension plan.
-
2. Savings or investments IN a TFSA.
-
3. Savings or investments OUTSIDE an RRSP, RRIF, pension plan or TFSA.
-
4. Currently do not have any savings or investments set aside for the future.
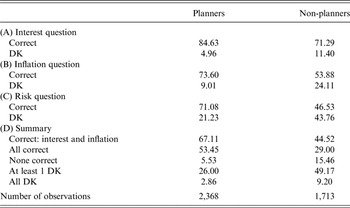
As did the studies in other countries, we restrict our sample to non-retired respondents age 25–64.Footnote 16 Table 5 shows the relationship between retirement planning and financial literacy. Results indicate that higher levels of financial literacy are associated with a higher likelihood that the respondent plans for retirement. The fraction who correctly answered all questions is much higher at 53.5% among planners vs. 29.0% among non-planners, and the fraction who answered with at least one ‘do not know’ is much lower among planners at 26.0% vs. 49.2% among non-planners.
Financial literacy of planners and non-planners

Notes: Sample consists of non-retired respondents age 25–64. DK indicates the respondent does not know the answer. Planners are individuals who have any voluntary savings.
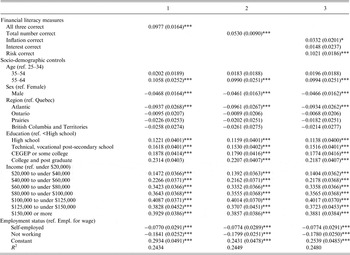
In Table 6 we show the results of regressions to assess the impact of financial literacy on retirement planning – this time controlling for a rich set of demographic characteristics and income.Footnote 17 As in the studies in other countries, we use three different specifications for financial literacy: (1) whether the respondent answered all three questions correctly; (2) the number of questions the respondent answered correctly; and (3) dummies for each of the questions the respondents answered correctly.
Linear probability models for retirement planning

Notes: Robust standard errors in parentheses; ***p < 0.01; **p < 0.05; *p < 0.10. Sample consists of 4,082 non-retired respondents age 25–64. ‘Not working’ includes students, homemakers, and the unemployed.
Income information is reported using eight broad categories, rather than as a continuous variable. These categories are coded using dummy variables (one dummy for each income category).Footnote 18 The same is true for age, which is represented as a set of dummies for age groups rather than as a continuous variable.
We do not use visible minority status as a control because of the large number of ‘do not know/prefer not to say’ responses (almost 10%). The survey does not provide information regarding marital status and, as a result, we cannot use this variable in our regressions.Footnote 19
Even after controlling for many demographic characteristics, including income, Table 6 shows there continues to be a strong link between financial literacy and retirement planning. Specifically, those who answered all three questions correctly are about 10 percentage points more likely to have savings, including in an RRSP, RRIF, pension plan, or TFSA. Similarly, those who can answer one extra financial literacy question have an increased probability (5.3 percentage points) of having savings. The concept that matters the most for retirement planning is risk diversification: those who correctly answered the risk diversification question have a 10.2-percentage-point-higher probability of having savings. This finding is similar to what is found in other papers (Lusardi and Mitchell, Reference Lusardi and Mitchell2014).
Both higher income and higher educational attainment are associated with higher levels of planning. These variables have positive and generally large and significant effects on retirement planning, which is again consistent with the findings of many other countries (see, e.g., Lusardi and Mitchell, Reference Lusardi and Mitchell2011c , Reference Lusardi and Mitchell2014). Age also has a significant effect, with older individuals being more likely to hold retirement savings. When controlling for other personal characteristics, including income, education, and financial literacy, we find that women are more likely to plan for retirement. This finding is consistent with evidence from other countries, such as Japan (Lusardi and Mitchell, Reference Lusardi and Mitchell2011a ).
Because of possibly differing incentives to plan for retirement according to the level of income in Canada, we have split the sample according to income, at CA$60,000. As an alternative strategy, we have included an interaction term between financial literacy (each of the three measures in turn) and a dummy indicating that an individual has a high income, i.e., over CA$60,000. We reach the same qualitative conclusion using both methods: all else equal, financial literacy appears to have a greater impact on retirement planning for individuals with lower income. This makes sense to the extent that higher-income individuals are more likely to be aware of the basic features of the retirement income system, and thus of their need to save, regardless of their measured level of financial literacy. But this finding may warrant further research.
Financial literacy can itself be an endogenous variable. One framework used to conceptualize financial literacy is described in Lusardi et al. (Reference Lusardi, Michaud and Mitchell2013). Financial literacy is a form of human capital, which may enhance returns on savings but which is costly to acquire. In such a model, financial literacy affects savings by raising the returns on available assets, but both are a choice variable. Finally, there is the possibility that individuals acquire financial literacy by planning for retirement, a learning-by-doing mechanism. One common strategy used to address these issues is to rely on instrumental variables estimation. Unfortunately, we do not have information that would enable us to construct instruments for financial literacy, such as whether respondents have been exposed to financial education, either in school or at work (Lusardi and Mitchell, Reference Lusardi and Mitchell2014). Nevertheless, in most of the countries covered in the international comparison, instrumental variables estimation has yielded consistently higher estimates of the relationship between financial literacy and planning than those measured by the OLS estimates (Lusardi and Mitchell, Reference Lusardi and Mitchell2014, Table 4).
4 Discussion and conclusions
In this paper, we examine financial literacy via responses to questions that have been used in surveys in many other countries. We report several important findings. First, only 42% of respondents in Canada correctly answer basic questions relevant to personal financial decisions. This is low but not very different from findings in other countries where the same questions were asked. For example, only 30% of American respondents correctly answered the same questions while 53% of German respondents did so.
Second, Canada is no different from other countries when it comes to the groups who know the least: financial literacy is lower among the young and the old, women, minorities, and those with lower educational attainment. It is also lower in Quebec and Atlantic provinces and, in particular, low among those speaking French in Quebec. However, these differences seem mostly due to differences in educational attainment among regions and language groups. Financial literacy increases with education, but even among those with high levels of education, for example college-educated respondents, only 60% could answer all three questions correctly. This is particularly relevant for the debate over how to reform the retirement income system in Canada. It is also important in identifying potentially vulnerable groups.
Retirement planning is strongly associated with financial literacy. This result has been found in many countries and the estimates in Canada are similar to those of other countries. This is relevant in the Canadian context because of the relatively low level of financial literacy, even among the more fortunate Canadians (i.e., those with higher education and income), who may need to rely more and more in the future on voluntary savings programs to fund their accustomed level of consumption in retirement. Furthermore, enhanced financial literacy among lower-earning individuals may subsequently improve their general financial situation and retirement and, hence, benefit them more as they move to higher earning categories.
Appendix A: Weighting procedure
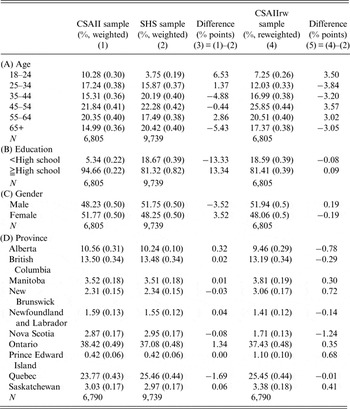
To ensure that our sample is representative of the Canadian population, we reweighted it using the weights of the Survey of Household Spending (SHS) as calculated by Statistics Canada, and the weights of the CSA Investor Index (CSAII) survey. Initially, the latter were based on three census variables: age group (3 categories), sex (2), and province of residence (10). Because education is important for our analysis, we added it to this list. To implement this, for the two surveys we found the distribution by age, sex, region of residence, and educational attainment. We considered three categories for age: 18–34, 35–54, and 55+; five regions of residence: Quebec, Ontario, Prairies, British Columbia and Territories, and Atlantic; and two levels of educational attainment: less than high school and high school and more. Letting Nc,csa be the number of observations obtained from the CSAII survey and Nc,shs those obtained from the SHS for each of the 60 groups, we came up with the new weight: Wc = Nc,shs/Nc,csa, c = 1,…,60. Using this new weight, we obtained column 4 of Table A1.
Distributions differences

Appendix B: Income imputation
About 15% of respondents to the CSA Investor Index (CSAII) survey did not report their income (i.e., they said that they did not know or preferred not to answer). Because income is an important variable in our analyses, we imputed the missing observations to be able to rely on the full sample. We did so by using ordered logit estimation for those individuals who did provide their income, where the dependent variable was income as reported in the categories originally used in the CSAII survey. The regressors included age, gender, survey language, visible minority status, province of residence, educational attainment, and employment status – all with their original categories, as provided by the survey firm. Using the coefficients obtained from this regression, we then imputed an income to respondents who had answered ‘do not know’ or ‘prefer not to say’. Thus these individuals were attributed an income category based on their age, gender, survey language, visible minority status, province of residence, educational attainment, and employment status.
Appendix C: Descriptive statistics
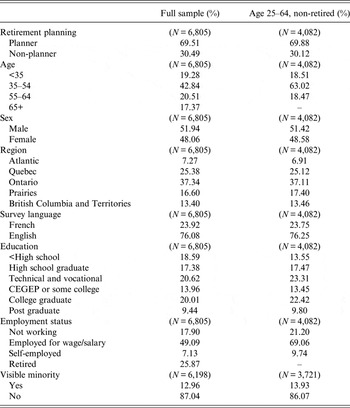
Table C1 presents descriptive statistics for the survey variables used in this paper. Statistics are provided for both the full sample and our regression sub-sample of non-retired individuals age 25–64.
Descriptive statistics