1. Introduction
The implementation of reform has clearly transformed China's urban economy. Nominal per-capita income in urban households has increased from 343 yuan in 1978 to over 10,000 yuan in 2005 – more than a six-fold increase in real terms – with consumption and expenditures showing similar increases. These gains, however, have also come with certain environmental and social costs. A number of Chinese cities have appeared on the World Health Organization's (WHO) list of the world's worst cities for air pollution. In addition, the uneven distribution of economic gains and inflation for items such as food and health care, as well as the uncertainties associated with enterprise reform, have implications in terms of income equality.
Looking first at environmental issues, a number of studies verify that urban air pollution is a problem in China. Epidemiological studies are establishing links in China between various pollutants and adverse health outcomes (see ISOC, 2004 for a summary of such studies). Other studies note the substantial health costs from pollution across much of China. These findings are robust across a number of studies examining China generally (Ho and Nielsen, Reference Ho and Nielsen2007; World Bank, 2007; Zhang et al., Reference Zhang, Song, Cai and Zhou2008), for individual cities (Peng et al., Reference Peng, Wu, Liu, Johnson, Shah and Guttikunda2002; Kan and Chen, Reference Kan and Chen2004; Mead and Brajer, Reference Mead and Brajer2008), or across age groups (Brajer and Mead, Reference Brajer and Mead2004; Mead and Brajer, Reference Mead and Brajer2005).
Juxtaposed with this growing literature is an ambiguous record in terms of China's environmental management. On paper, China has made substantial progress in terms of creating the State Environmental Protection Administration (SEPA) and promulgating environmental laws and regulations. Examples of air quality legislation include moving from controlling coal-based emissions to the monitoring of the total volume of pollutants, establishing emission standards and annual checks for motor vehicles and prohibiting the use of leaded gasoline (see Beyer, Reference Beyer2006). In addition, the use of strategic environmental assessment became a mandatory practice in 2003 (Zhu and Ru, Reference Zhu and Ru2008), and efforts are underway to expand publicly available information regarding environmental conditions (e.g., air quality reports) or firm level environmental ratings (Wang et al., Reference Wang, Bi, Wheeler, Wang, Cao, Lu and Wang2004; Zhang and Wen, Reference Zhang and Wen2008).
Issues, however, exist in terms of enforcement which is delegated in a top-down fashion to local level officials who may view environmental concerns as conflicting with economic growth (Beyer, Reference Beyer2006; Roumasett et al., Reference Roumasset, Burnett, Wang, Brandt and Rawski2008). There exist a multitude of stories where large cleanup campaigns were initiated with extensive public fanfare and media promotion culminating in some sort of official designation of success, but with little or no real improvement in the local environmental situation (e.g., Schwartz, Reference Schwartz2003; van Rooij, Reference van Rooij2006).
As a result, there has been mixed progress in terms of improving urban air quality. For sulfur dioxide and particulates, emissions are down from peak levels, but nitrogen oxide levels have increased continuously (Ho and Nielsen, Reference Ho and Nielsen2007). In terms of ambient air quality, levels of particulates and sulfur dioxide decreased through the 1990s, but sulfur dioxide and nitrogen oxide levels have shown signs of increasing more recently (World Bank, 2007).
The social costs of economic reform, especially in terms of income inequality, have also generated a substantial literature. Though some studies have noted a decline or leveling in terms of urban income inequality (Khan and Riskin, Reference Khan and Riskin2005) or that income inequality is overstated (Démurger et al., Reference Démurger, Fournier and Li2006), there are a number of findings of increased urban income inequality in China. For example, Meng et al. (Reference Meng, Gregory and Wang2005) argue that reductions in social welfare provision and employment uncertainty from enterprise restructuring, along with food inflation and increased inequality, have led to increased urban poverty. Okushima and Uchimura (Reference Okushima and Uchimura2006) note that age, education and regionalized benefits of economic reform have contributed to urban income inequalities. Wan et al. (Reference Wan, Lu and Chen2007) contend that globalization and the regionalization of capital flows have created increased inequality within China.
Given the extensive attention separately paid to the environmental and social costs in urban China, it is interesting to note that little attention has been paid to any relationship which may exist between the two. Such discussion, however, would seem to have certain natural linkages. As mentioned above, pollution has established health consequences. At the same time, health (in particular, access to health care) and income appear to be related. However, before exploring the potential impact of the health effects of urban air pollution upon inequality in China, we must first explore whether inequality has an effect upon health.
It turns out that a large literature has emerged considering the question of whether income inequality affects health or vice versa. Early findings contend that a person's relative (not absolute) income is key (Marmot et al., Reference Marmot, Smith, Stansfeld, Patel, North, Head, White, Brunner and Feeney1991; Wilkinson, Reference Wilkinson1998), and that income inequality is harmful to a person's health (Wilkinson, Reference Wilkinson1996). Over the past decade, however, this notion has been seriously challenged (see, for example, Wagstaff and van Doorslaer, Reference Wagstaff and van Doorslaer2000; and Mellor and Milyo, Reference Mellor and Milyo2003). In an extensive multidisciplinary review article, Deaton (Reference Deaton2003) examines the theoretical basis and empirical evidence for the income inequality–health relation, and concludes that ‘there is no direct link to ill health from income inequality’. Instead, ‘it is low incomes that are important, not inequality’. Similar results are found in specific country studies for Britain (Balia and Jones, Reference Balia and Jones2008; Lorgelly and Lindley, Reference Lorgelly and Lindley2008), Sweden (Gerdtham and Johannesson, Reference Gerdtham and Johannesson2004) and the United States (Mellor and Milyo, Reference Mellor and Milyo2003), among others.
Returning to our focus on China, we again find evidence consistent with the idea that absolute income, and not relative income, affects health. In two studies, Li and Zhu (Reference Li and Zhu2006) find that self-reported health status increases with income, and Zhao (Reference Zhao2006) notes that financial considerations are a frequently given reason for declining in-hospital care for lower income areas but seldom in higher income areas. Hence, our reading of this extensive literature finds that inequality does not have a causal effect upon health, allowing us to explore the equity issue as to the potential magnitude of pollution and health effects upon income inequality.
In fact, the relationship between social economic status and environmental damage has spawned a fairly broad literature looking at issues of environmental justice or equity – the ‘principle that all people and communities are entitled to equal protection of environmental and public health laws and regulations (Bullard, Reference Bullard1996)’.Footnote 1 In the United States, environmental equity studies have examined how socioeconomic factors relate to various environmental issues such as regulatory activities on pulp and paper mills (Gray and Shadbegian, Reference Gray and Shadbegian2004), air pollution (Brajer and Hall, Reference Brajer and Hall2005) and hazardous waste treatment (Lejano and Iseki, Reference Lejano and Iseki2001).Footnote 2 Outside the United States, studies have looked at environmental equity issues in Canada (Buzzelli and Jerrett, Reference Buzzelli and Jerrett2004) and New Zealand (Salmond et al., Reference Salmond, Howden-Chapman, Woodward and Salmond1999).
In the case of China, however, only minimal environmental equity discussions have taken place. Tu and Shi (Reference Tu and Shi2006) describe how changes in the Shanghai economic structure have mitigated some environmental costs, but also note that environmental equity or sustainability issues are absent from this process. Ma (Reference Ma2007) and Pannell (Reference Pannell2007) debate the need for a more activist environmental equity approach to Chinese research, but focus more upon a philosophical approach to research agendas rather than China's environmental equity issues.
A brief mention of environmental equity issues can be found in the executive summary of the World Bank's (2007) report, where they mention that China's poor are disproportionately affected by environmental burdens. One foundation of this claim is that air pollution is higher in some of the poorer provinces. However, this claim is based only upon higher levels of particulate pollution in Ningxia, Xinjiang and Inner Mongolia, as compared to the southern coastal provinces. Moreover, relying solely upon particulates ignores the adverse effects of sulfur dioxide, a long-standing pollution problem for China, and the growth in automobile-related nitrogen dioxide pollution (Mead and Brajer, Reference Mead and Brajer2006).
Given the extensive discussion of China's air pollution and urban income inequality, this paper seeks to explore the existence of environmental equity across Chinese cities. Do pollution-induced health costs in China exacerbate an intercity urban income inequality problem or are these health costs the result of economic growth? Also, does the impact of these pollution induced costs change between the years 1995 and 2004 as environmental policy evolves? In order to answer these questions, we estimate pollution-induced health costs to derive several pollution-adjusted welfare inequality measures for China. Here, we are expanding the notion of income inequality to the more inclusive welfare inequality, with our basic argument being that overall welfare depends on more than just income – in this case, it also depends on the health levels (quality of life) of the population. Our operational hypothesis is that if this pollution-based adjustment causes an increase in inequality, then China's urban pollution disproportionately affects the poorer cities. An unchanged or decreased inequality measure suggests that pollution and its resulting health effects are implicit costs of economic success.Footnote 3
The rest of the paper proceeds as follows: A methodological overview is offered in section 2, followed by a brief discussion in section 3 of the data used. Sections 4 and 5 describe the derivation of the health equations and economic values used to adjust the income measures for pollution effects followed by some descriptive statistics in section 6. Then, section 7 explains the inequality measures used and section 8 presents the results. The final section offers some concluding thoughts.
2. Methodological overview
Our plan is to first calculate traditional measures of income inequality (Gini coefficients, Theil's T index and Theil's L index) for China's major urban areas using real per-capita GDP (see section 7). We then estimate ‘pollution-adjusted’ GDP measures. To do this, we use China-based health (epidemiological) functions and estimate the number of pollution-related adverse health outcomes (premature deaths and a variety of morbidity effects) that occurred in each city for each year. We consider three primary pollutants: sulfur dioxide (SO2), particulates,Footnote 4 and nitrogen dioxide (NO2). All three have been linked to a variety of health outcomes, including emergency room visits, and a myriad of symptoms (cough, asthma and bronchitis), with premature death of course being the most severe.Footnote 5 Next, we value the premature deaths using a value of statistical life developed from the Chinese valuation literature and value morbidity outcomes using several different cost estimates.Footnote 6 (Both the health functions and economic values used are discussed in more detail below). This total monetary value is then subtracted from each city's total GDP, giving us a ‘pollution-adjusted’ GDP. Thus, a city with high pollution levels (and high levels of health damage) will see its income figures reduced substantially, while a relatively cleaner city will realize less reduction.
Of course, pollution results in a much wider array of adverse outcomes, including damage to materials/crops and reduced visibility. We simply use the health calculations to proxy a ‛quality of life’ adjustment to each city's GDP.
3. Data
While pollution levels are being reported with increasing regularity, historical pollution levels in China tend to have been published irregularly. As a result, pollution levels are collected from a variety of sources covering the period 1995–2004. We start with the air quality levels collected from various municipal environmental Web sites and other sources, as reported by Brajer and Mead (Reference Brajer and Mead2004) and Mead and Brajer (Reference Mead and Brajer2005, Reference Mead and Brajer2006). Additional cities and years are then added by referencing the World Bank's (1998) compilation of pollution in a number of Chinese cities, Fridley (Reference Fridley2001), and recent editions of China Environmental Yearbooks.Footnote 7
In addition, reported pollutants also change somewhat over time, requiring some adjustments. For the entire time period, SO2 is consistently reported. Particulate pollution is initially reported as total suspended particulates (TSP), but then the reporting metric changes to PM10 around 2001. Similarly, nitrogen pollution is reported as all nitrogen oxides (NOx) before changing to NO2 pollution in the latter years. For some cities, there is overlap where both types of particulates or nitrogen pollution are reported, which we use to develop conversion ratios.
City-specific economic and demographic data, for the period 1995 to 1998, are collected from the 50-year compilation of China's cities (China City Statistics, 1999). The post-1998 city-specific population numbers, and total GDP levels, are obtained from an online Chinese data source (China City Statistics, 1998–2004). To convert these nominal income figures into real (inflation-adjusted) numbers, we use a set of urban, provincial level price deflators developed by Brandt and Holz (Reference Brandt and Holz2006) for the years 1984–2004. We thus express all of our per-capita GDP figures in 2004 yuan. Finally, various issues of the China Statistical Yearbook (2005, 2006) provide death rates measured at the provincial level. Based on Zhao and Svanström (Reference Zhao and Svanström2003), the nonaccidental death rate is assumed to be 89 per cent of the overall death rate. Baseline (prevalence) rates for the various morbidity outcomes that we consider are obtained from the Chinese health literature, as explained in the next section.
4. Calculation of health effects
Calculating expected changes in pollution-related deaths involves the derivation of China-specific, concentration-response health functions. To accomplish this, we employ the commonly used natural exponential functional form: ΔC = C(eβ ΔP − 1), where C is the number of baseline cases (here, the nonaccidental death rate or the prevalence rate of a particular morbidity effect), ΔP is the change in pollution level and β is an exponential ‘slope’ risk factor (derived from the Chinese health literature, as discussed below). This β is related to the odds ratio or relative risk (RR) factor, which links changes in pollution levels to the increased odds of the health outcome. We derive the β-values in the following manner: β = [ln(RR)]/ΔP, where again ΔP represents the change in ambient pollution. For this study, the β-values are derived exclusively from China-based epidemiological studies which examine the health impacts of pollution.Footnote 8
4.1. Mortality effects
For TSP mortality, we pool the results of two Chinese health (epidemiological) studies which examine the relationship between particulate air pollution and daily mortality in two major urban areas: Beijing (Xu et al., Reference Xu, Gao, Dockery and Chen1994); and Shenyang (Xu et al., Reference Xu, Yu, Jing and Xu2000). Using Poisson regression, each study regresses daily death counts against pollution, along with other confounding variables. Using the estimated coefficients from these regressions, each paper then calculates RR factors for TSP (1.013 for the Shenyang work and 1.04 for the Beijing study). We, in turn, combine the results of these two studies, using an inverse variance weighting procedure, to generate a β-value of 0.0001219 for TSP-related mortality.
For SO2-related mortality, we again use the work of Xu et al. (Reference Xu, Gao, Dockery and Chen1994) and Xu et al. (Reference Xu, Yu, Jing and Xu2000), but also include a more recent time-series study in Shanghai (Kan and Chen, Reference Kan and Chen2003a), which allows for the derivation of an RR factor (1.016) for nonaccident mortality. We pool this factor with the RRs calculated from the Xu et al. (Reference Xu, Gao, Dockery and Chen1994) and Xu et al. (Reference Xu, Yu, Jing and Xu2000) studies (1.11 and 1.0188 for Beijing and Shenyang, respectively), again using inverse variance weighting, and derive an SO2 mortality β-value of 0.0004222.
Finally, for NO2 mortality, our analysis relies on two recent studies: Qian et al. (Reference Qian, He, Lin, Kong, Liao, Dan, Bentley and Wang2007), who employ Poisson regression and find acute and consistent effects for NO2 on daily mortality in Wuhan, China, and Kan and Chen (Reference Kan and Chen2003b), who use a case-crossover design to confirm a statistical association between NO2 and daily mortality in Shanghai. From each study, we take multipollutant regression results for NO2, adjusted for the effects of PM10 and SO2, to derive RR factors for nonaccident mortality (RR = 1.0139 from the Wuhan study and RR = 1.012 from Shanghai). Once again, we use inverse variance weighting to calculate an exponential NO2 mortality β-value of 0.001347.
4.2. Morbidity effects
In this section, we briefly describe the health studies used for developing exponential slope (β) factors for a variety of morbidity outcomes. These same studies also provide us with the baseline (prevalence) rates which are necessary for our calculations of expected health improvements.
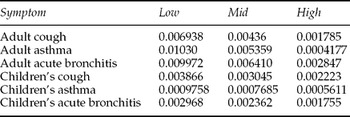
To derive concentration-response functions for adult TSP-related asthma, cough and acute bronchitis, we draw from the work of Zhang et al. (Reference Zhang, Qian, Kong, Zhou, Yan and Chapman1999). This study uses logistic regression models to consider the associations between outdoor levels of particulates and the above-mentioned symptoms in three large Chinese cities (Guangzhou, Wuhan and Lanzhou). From this work, we develop β-values for Wuhan, Lanzhou and a Wuhan–Lanzhou average (see table 1), with Guangzhou providing the baseline case, from which odds ratios can be calculated for the other two cities. We apply these values, along with the reported baseline rates, to our sample of cities, based on their TSP levels (categorized as low, medium, or high TSP).
Concentration response β-values

For children's asthma, cough and bronchitis, we combine the results of two health studies, i.e., Zhang et al. (Reference Zhang, Hu, Wei, Wu, Korn and Chapman2002) and Qian et al. (Reference Qian, Chapman, Tian, Chen, Lioy and Zhang2000). These authors find significant associations between particulate levels and the symptoms listed above. Table 1 presents the children's β values that we derive from these two studies; again, we estimate low, mid and high βs, based on the Wuhan and Lanzhou (relative to Guangzhou) results.
For hospital emergency room (ER) visits, we draw from the work of Xu et al. (Reference Xu, Li and Huang1995), who use linear regressions and find significant associations between SO2 and ER visits. From this work, we derive an SO2 β-factor of 0.0003668.
5. Calculation of economic unit values
The ultimate goal of this study is to analyze the degree of welfare inequality existing across urban China, taking into account the health damage caused by the nation's high pollution levels. As noted earlier, we use a variety of pollution-related mortality and morbidity estimates, as calculated by various Chinese epidemiological functions, to estimate this damage. We must next convert the estimated number of adverse health outcomes into monetary figures in order to adjust our city-specific per-capita GDP numbers.
5.1. Value of statistical life
Early attempts by economists to value lost lives, or averted deaths, relied on human capital accounting estimates, which focused on lost future income. However, these estimates only provide a partial measure of the value of a human life or the loss to society of reduced life expectancy. A preferred, more comprehensive economic measure can be derived from willingness-to-pay (WTP) studies. These either observe individual preferences (hedonic studies) or survey people (contingent valuation studies) to determine the collective value placed on reducing the probability of dying earlier than would otherwise be expected. The economic expression commonly used to depict this value is value of a statistical life (VSL). While most of the health (VSL) valuation work over the past two decades has been conducted in the United States and Western Europe, a few China-based WTP studies have emerged in recent years. It is to this work that we turn for our monetary estimates of avoiding premature mortality.
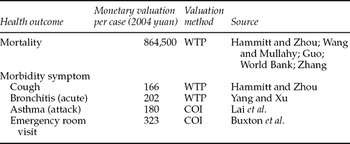
In the case of China, we find five studies looking at WTP and VSL conducted across several cities and during varying years from 1995 to 2006 (see table 2). These are studies for Chongqing (Wang and Mullaley, Reference Wang and Mullahy2006); Beijing (Zhang, Reference Zhang2002); Beijing, Anqing and rural surroundings of Anqing (Hammitt and Zhou, Reference Hammitt and Zhou2006); Chengdu and the entire nation (Guo, Reference Guo2006); and Shanghai and Chongqing (study by Krupnick, reported in World Bank, 2007). Values range from a lower bound mean estimate of 66,320 yuan to values as large as 6.2 million yuan. For our China-based VSL, we average the reported values from each study and then update the figure to 2004 using the Chinese consumer price index (CPI). In the case of the Shanghai and Chongqing study by Krupnick, we project the values back one year using the Chinese CPI. Averaging across these studies gives us a benchmark (middle) VSL for China of 864,500 yuan.Footnote 9
Per-case valuations of various health outcomes in China

5.2. Morbidity values
To calculate the morbidity valuations, we use a combination of WTP and cost of illness (COI). While the WTP values are theoretically preferred because they are based upon individual preferences and behavior, they generally are harder to obtain because they require surveying or observing individual behaviors or preferences. COI estimates, on the other hand, which measure direct medical costs are often easier to find or estimate, but may omit intangible welfare costs captured in WTP calculations.
For cases of cough, we use the results of contingent valuation research by Hammitt and Zhou (Reference Hammitt and Zhou2006) in Beijing, Anqing and rural areas around Anqing. Using the reported values, and updating to 2004, we generate a value of 266 yuan. For acute bronchitis, we obtain a 2004 value of 202 yuan from Yang and Xu's (Reference Yang and Xu2004) contingent valuation survey of Tianjin residents on the prevention of a case of respiratory illness. For acute cases of asthma, we use the China-specific information from Lai et al.'s (Reference Lai, Kim, Kuo, Spencer and Williams2006) study of the Asia–Pacific region and arrive at a 2004 value of 180 yuan. For emergency room visits, we take Buxton et al.'s (Reference Buxton, Sullivan, Andersson, Lamm, Liljas, Busse, Pedersen and Weiss2004) cost in Shandong and update to a 2004 value of 323 yuan. All values are also presented in table 2.
These VSL and morbidity values are next used to calculate the per-capita pollution-induced health costs for each city. Subtracting these costs from real per-capita GDP provides an array of ‘pollution-adjusted’ welfare measures.
6. Descriptive statistics
Excluding all missing values for pollution and income variables, there are 76 cities in 1995 and a different set of 76 cities in 2004. In order to perform a direct and consistent comparison, we include a balanced panel of only those cities that have pollution and income data available for the entire time period from 1995 to 2004. As a result, the final sample consists of 45 cities. The complete list of these 45 cities and descriptive statistics of their income and pollution levels appear in the Appendix (available at http://journals.cambridge.org/EDE). Out of this sample, 25 are Northern cities and 19 are coastal. Overall, 45 cities are located in 25 different provinces, and therefore, they provide a reasonable geographical representation of all Chinese cities.Footnote 10
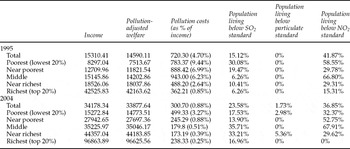
Table 3 presents descriptive statistics of income and pollution-adjusted welfare for the entire population and the income quintile groups. The estimated pollution-generated health costs per person total to 720 yuan for 1995 and 300 yuan for 2004. However, not every member of the society has been affected equally. Health costs account for a much higher proportion of income in the lower quintiles. In 1995, health costs would have reduced income of the lowest quintile by 9.44 per cent (783 yuan) as opposed to only 0.85 per cent (362 yuan) of the richest quintile. By 2004, estimated health costs have overall become a smaller percentage of income. However, they still constitute a reduction of 3.27 per cent of income (499 yuan) for the poorest quintile and only 0.25 per cent (238 yuan) for the richest quintile.
Income and pollution-adjusted welfare by income quintile in 1995 and 2004

Notes: Income = mean per-capita GDP measured in 2004 yuan; Pollution-adjusted welfare = mean per-capita real GDP adjusted for pollution; pollution costs (measured in yuan) = income − pollution-adjusted welfare; and percent of income = (pollution costs/income)*100%.
In addition, overall air quality seems to have improved somewhat between 1995 and 2004. The proportion of the population living in areas where the SO2 levels are below the WHO health standards (i.e., cleaner) has gone up from 15 per cent in 1995 to almost 25 per cent by 2004. In 1995, all the cities in our sample had particulate levels exceeding the WHO standards; however, by 2004, close to 2 per cent of the population resides in areas with lower particulate levels. On the other hand, since NO2 is largely produced by automobile emissions, NO2-related pollution has risen as the economy has grown. Notice that even though the higher income groups tend to suffer from higher levels of NO2 concentration, as income grows rapidly for all quintiles over the years, the bottom groups actually have seen the most drastic increases in their NO2 pollution levels.
7. Measures of income inequality
In order to specifically calculate income (and welfare) inequality, we apply several commonly used measures: the Gini coefficient and Theil's T and L indices. The Gini coefficient is a standard measure of inequality due to its easy interpretation. One key feature of the two Theil entropy measures is that they are additively decomposable across different subgroups of the population; therefore, they are also widely used in the literature.
There are a number of different formulae for computing the Gini index. Deaton (Reference Deaton1997: 139) proposes a computationally convenient form for the Gini when all individuals are ranked in a descending order by their income y i

where Y denotes the mean income, ρi represents the rank of each individual (with the best-off person ranked 1) and N is the total number of individuals.Footnote 11
However, given that we only have city-level data, we need to convert city ranks into individual ranks in order to calculate the individual-level Gini (Deaton, Reference Deaton1997: 154). Start with the first person in the richest city (ρ 1 = 1): if the number of people in city c is nc and everyone in the same city is assigned the same income, then the rank of the first person in city c + 1 can be specified as

The average rank of all the people in city c is

Therefore, the Gini for individuals is as follows:

where y c is the average per-capita income for city c, and in our case, c = 1, 2, 3, . . ., 45. Of course, the value of the Gini coefficient varies between 0 and 1, with a Gini coefficient of 0 denoting perfect equality and a Gini of 1 standing for total inequality.
Both the Theil's T and Theil's L indices are part of the generalized entropy (GE) class of inequality measures. Since individuals in each city are assumed to have the same income (yi = yc for each city c with population nc), the Theil's T statistic is computed as follows:

The value of the Theil's T falls between 0 and ln(N), with 0 indicating complete equality and ln(N) being the highest inequality. Intuitively, the Theil's T statistic combines each city's contribution to the total measure of inequality with its population share (nc/N), its proportional distance from the mean income (yc/Y) and the sign of its contribution (lnyc/Y) (positive, zero, or negative).
The Theil's L index is also called the mean log deviation measure and is calculated as

The Theil's L ranges from 0 to infinity and a higher value of Theil's L corresponds to a higher level of inequality.Footnote 12
Using these measures, the impact of pollution on income (and welfare) inequality is analyzed for both 1995 and 2004. Moreover, in order to determine the statistical significance of the estimated inequality measures as well as the difference in inequality measures as a result of pollution adjustment, the bootstrap technique (Efron, Reference Efron1979, Reference Efron1982; Efron and Tibshirani, Reference Efron and Tibshirani1993) is utilized to estimate standard errors. More specifically, a random drawing of a sample with replacement from the n-observation original dataset is repeated a sufficient number of times (for instance, k times). The standard error can then be calculated based on the resulting k number of bootstrap samples. In our case, we compute the standard errors for all the inequality measures (the Gini, Theil's T and Theil's L) using 2,000 repetitions (k = 2,000). More importantly, following Efron and Tibshirani (Reference Efron and Tibshirani1993) and Mills and Zandvakili (Reference Mills and Zandvakili1997), the distribution of the differences between the income inequality and the pollution-adjusted income inequality measures are also bootstrapped based on 2,000 replications.
8. Results
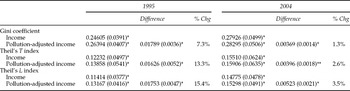
Table 4 reports the inequality measures based on real per-capita income and pollution-adjusted counterfactual real per-capita income (welfare), as well as changes in the inequality measures after adjustment for pollution.Footnote 13 Bootstrapped standard errors are included in parentheses.Footnote 14 In both 1995 and 2004, the Gini coefficient and the Theil's T and L, adjusted for pollution, are all larger than otherwise, with the range of increase between 1.3 per cent and 15.4 per cent. Specifically, for 1995, when adjusted for pollution costs, inequality measured by the Gini, Theil's T and Theil's L worsened by 7.3 per cent, 13.3 per cent and 15.4 per cent, respectively. For 2004, these same indices increase by only 1.3 per cent, 2.6 per cent and 3.5 per cent. Note that these increases in welfare inequality as a result of accounting for pollution costs are all highly statistically significant. Also notice that the differences between income and welfare measures based on the Theil's L index are more pronounced than those using the Theil's T index. This reinforces the finding that pollution has negative redistributive impacts on inequality, given that the Theil's L is most sensitive to changes in the lower end of the income distribution. All in all, the results from table 4 clearly suggest that pollution has impacted the lower income cities disproportionately and has statistically significant and negative redistributive effects on welfare inequality.
Impact of pollution on income inequality, 45 cities, 1995 and 2004

Notes: The impact of pollution on inequality is measured as the difference in and the percentage change of inequality measures based on pollution-adjusted counterfactual per-capita real income compared to inequality measures based on the observed factual per-capita real income.
Bootstrapped standard errors are in parentheses. *, **: significance at 1 per cent and 5 per cent levels, respectively.
Another notable aspect of table 4 is that the magnitude of urban income inequality (not adjusted for pollution) has increased between 1995 and 2004 across all three inequality indices. For instance, the Gini coefficient has gone up from 0.246 to 0.279 over this 10-year time period. Interestingly though, while inequality has overall worsened, the negative redistributive impacts of pollution on inequality have actually diminished over time, as the differences between income and welfare measures are much smaller in 2004 than in 1995. This reduced impact of pollution on inequality is consistent with the observation from table 1 that air quality overall seems to have improved somewhat between 1995 and 2004.
Furthermore, it is worthwhile to point out that our Gini and Theil figures based on real per-capita GDP (income) are all statistically significant and broadly in line with those from previous studies on urban inequality in China (see, among others, Meng, Reference Meng2004; Khan and Riskin, Reference Khan and Riskin2005; and Démurger et al., Reference Démurger, Fournier and Li2006).
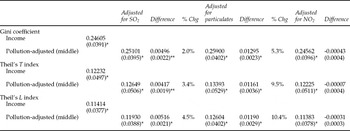
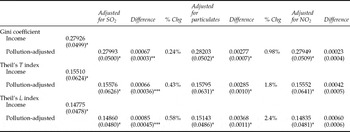
Next, we decompose the impact of pollution on inequality by looking at the three pollutants (SO2, particulates and NO2) separately. The results for 1995 and 2004 are shown in tables 5 and 6, respectively. Regardless of which year is considered and across all three measures of inequality, the effects of particulate and SO2 pollution are statistically significant. Moreover, particulate pollution appears to have the largest negative redistributive impact on welfare though SO2-related pollution also magnifies the extent of inequality. For instance, based on the Gini values, in 1995, pollution from particulates exacerbated welfare inequality by 5.3 per cent, while pollution from SO2 raised inequality by 2 per cent. By 2004, the effects of particulate- and SO2-related pollution were 0.98 per cent and 0.24 per cent, respectively, suggesting that China's environmental management efforts had made some progress toward mitigating these sources of inequality.
Decomposition of the impact of pollution by pollutants, 45 cities, 1995

Bootstrapped standard errors are in parentheses. *, **: significance at 1 per cent and 5 per cent levels, respectively.
Decomposition of the impact of pollution by pollutants, 45 cities, 2004

Bootstrapped standard errors are in parentheses. *, **, and ***: significance at 1 per cent, 5 per cent, and 10 per cent levels, respectively.
In contrast, an examination of the individual effects of NO2 pollution on inequality shows some mixed results. In 1995, NO2 actually had a positive redistributive effect on inequality, indicating that NO2 was higher in wealthier cities where the residents were much more likely to own cars. However, by 2004, the effect of NO2 on welfare has become regressive. One possible reason for this turn of events could be that while both income and vehicle sales have increased rapidly nationwide, those previously less well-off cities have seen a much larger proportionate increase in automobiles. Nevertheless, NO2 pollution does not have any statistically significant effects on welfare distribution in 1995 or in 2004.
9. Conclusion
Noting two distinct literatures on China's environmental issues and changes in income equality, this paper examines whether the two discussions might have an environmental equity connection. By calculating the health costs of urban air pollution, we first construct a health-adjusted measure of per-capita GDP. We then calculate several measures of inequality using the health-adjusted and nonhealth-adjusted welfare measures.
In constructing these measures, we observe several findings. First, intercity income inequality in our sample has increased from 1990 to 2004. Second, air pollution does seem to influence the degree of inequality across Chinese cities. However, Chinese cities in general appear to be getting somewhat cleaner overall and cleanup efforts appear to have diminished the degree to which air pollution adversely affects welfare inequality.Footnote 15 More specifically, as the number of cities with cleaner air increases during this time period, we find that size of the increased inequality arising from the pollution is now smaller. That is, as pollution cleanup efforts gain traction, the regressive consequences of pollution diminish.
Third, different pollutants seem to have different impacts. Particulates and sulfur dioxide make a significant contribution to increased welfare inequality. This finding suggests that economic growth efforts should target green activities with respect to these two pollutants. The impact of nitrogen dioxide is less clear. Indications are that it may have an equalizing effect, but the statistical significance of this equalizing effect is unconfirmed. Even so, the change in signs between the comparison years suggests that promoting economic growth in poorer areas in ways that minimize NO2 production may have an overall positive effect on welfare equality.
Putting these various findings together generates one final observation and encouraging note for developing countries: improving welfare distribution can coexist with an improving environment. In the case of our China observations, we observe that even in a situation where the inequality of income distribution may be increasing, efforts to clean up pollution suggest a path to a positive redistribution effect on overall welfare.