1. Introduction
A surface tension gradient on a free liquid surface initiates Marangoni spreading, a surface shear flow associated with convection in the bulk (Chen & Xu Reference Chen and Xu2023), which thermal and solutal effects can induce. Physicochemical energy released by the solutes drives the latter, which does not require external energy input, benefiting interfacial transport in many fields, such as pulmonary drug delivery (Stetten et al. Reference Stetten, Iasella, Corcoran, Garoff, Przybycien and Tilton2018), inkjet printing (Lohse Reference Lohse2022), surface pattern formation (Kim et al. Reference Kim, Boulogne, Um, Jacobi, Button and Stone2016; Mouat et al. Reference Mouat, Wood, Pye and Burton2020), hydrogen detachment in electrocatalysis (Park et al. Reference Park, Liu, Demirkir, van der Heijden, Lohse, Krug and Koper2023), self-propulsion (Meredith et al. Reference Meredith, Moerman, Groenewold, Chiu, Kegel, Van Blaaderen and Zarzar2020), and regulation of slippage on superhydrophobic surfaces (Li et al. Reference Li, Li, Tan, Wang, Huang, Xiang, Lv and Duan2020). It has recently been applied to chemical engineering at interfaces, e.g. in the manufacturing of ultrathin films and filaments (Tang et al. Reference Tang, Gong, Shi, Wen and Zhao2022; Shi et al. Reference Shi, Li, Tsunematsu, Ozeki, Kano, Yamamoto, Kobayashi, Abe, Chen and Osada2024), as well as in forming functional microstructures and colloidal crystals (Xiao et al. Reference Xiao, Ribe, Zhang, Pan, Cao and Shum2022). These interfacial reactions can be regulated by mixing at the interface, where solubility between the fluids plays a key role.
The studies on the mechanisms of the Marangoni spreading started with non-miscible interfaces. Oil spreading on the sea surface is driven by gravity or surface tension, and reduced by inertia or viscous effects, depending on the time scale of the process (Hoult Reference Hoult1972). Surfactant molecules possessing both hydrophilic and hydrophobic parts adsorb onto the interface and reduce the local surface tension, initiating a Marangoni spreading. The flow generates surface waves (Sauleda et al. Reference Sauleda, Hsieh, Xu, Tilton and Garoff2022), fingering instability at the contact line of a thin film (Craster & Matar Reference Craster and Matar2009), recirculation flow within a deep layer (Xiao et al. Reference Xiao, Ribe, Zhang, Pan, Cao and Shum2022), and surface and bulk transport of surfactants. For insoluble surfactants, Gaver & Grotberg (Reference Gaver and Grotberg1990) established model equations for the spreading film thickness and surfactant interfacial concentration. This model captures the primary features of the spreading process, and illustrates the temporal evolution of surface deformation and surfactant distribution.
Most surfactants are soluble in the bulk fluid, as characterised by the critical micelle concentration (CMC). The CMC is the volume concentration of the surfactant at which the number of micelles increases abruptly. Consequently, the CMC is higher for surfactants with higher solubility. Roché et al. (Reference Roché, Li, Griffiths, Le Roux, Cantat, Saint-Jalmes and Stone2014) showed that the transport of soluble surfactants away from the free surface through mixing into the bulk weakens the surface tension gradient and limits the spreading radius. Le Roux et al. (Reference Le Roux, Roché, Cantat and Saint-Jalmes2016) considered the molecular diffusion from the surface to the bulk in their theory for viscous flow at steady spreading. They deduced a scaling law for the static radius and maximum spreading speed. Outside the stable spreading region, an unstable region characterised by equally spaced mixing plumes forms along the circumferential direction. This results from the spreading instability and is offset by the viscous shear, thus impeding radial momentum transfer (Le Doudic Reference Le Doudic2022; Pant Reference Pant2024). In a similar situation, instability during the spreading of a volatile droplet on an aqueous subphase disrupts the radial symmetry of the vortex flow underneath the surface, leading to the formation of a faceted droplet shape at a specific Marangoni number (Li et al. Reference Li, Pahlavan, Chen, Liu, Li, Stone and Granick2023).
Motivated by drug delivery in the airways, numerous investigations have focused on surfactant-induced spreading at the free surface of complex fluids. The spreading flow provides a high shear rate up to
 $10^{4}\, {\textrm{s}}^{-1}$
. The spreading of a viscoelastic fluid exhibits fingering instability at the contact line (Ma et al. Reference Ma, Zhong, He, Liu and Li2020, Reference Ma, Huang, Huang, Liu, Li and Floryan2023), reminiscent of a new interfacial instability driven by elasticity (Hwang, Altomare & Stone Reference Hwang, Altomare and Stone2025). Although both droplet and bulk represent aqueous phase and are miscible with each other, it is shown that the slow mixing between the droplet and the bulk causes the droplet to form a static lens on the free surface (Sharma et al. Reference Sharma, Corcoran, Garoff, Przybycien, Swanson and Tilton2013), while the surfactants escape from the droplet and generate the surface spreading. The morphology of the spreading droplet is primarily determined by the droplet’s physical properties and the bulk, such as solubility and constitutive relations.
In addition to surfactant-induced spreading, a volatile droplet placed on a free surface also undergoes Marangoni spreading. The evaporation rates at the triphasic contact line and the droplet apex differ, creating a surface tension gradient. When the droplet–bulk interface is immiscible, evaporation is the primary factor in generating spreading (Keiser et al. Reference Keiser, Bense, Colinet, Bico and Reyssat2017; Wodlei et al. Reference Wodlei, Sebilleau, Magnaudet and Pimienta2018; Lohse Reference Lohse2022). In another situation, if an alcohol is placed near the free surface of a water film without contacting it, then the adsorption of the evaporated alcohol molecules into the water induces a surface tension gradient that dominates the Marangoni spreading (Kim, Kim & Kim Reference Kim, Kim and Kim2019). However, when the spreading droplet is both volatile and miscible with the substrate, such as alcohols spreading on an aqueous solution, both evaporation and mixing contribute to the removal of molecules from the interface during spreading, creating further complications. In such a situation, the dependence of spreading radius on the alcohol’s solubility was shown to be similar to the CMC dependence of spreading radius on soluble surfactants (Le Roux et al. Reference Le Roux, Roché, Cantat and Saint-Jalmes2016).
At a miscible interface, the continuous delivery of alcohol droplets to a water surface does not exhibit any triphasic contact line (Suciu, Smigelschi & Ruckenstein Reference Suciu, Smigelschi and Ruckenstein1967). Instead, the droplet and the water substrate mix and form a rim on the interface, whose radius increases as
 $r\sim t^{1/2}$
in the case of thin water films. This effect results from an interaction of surface tension gradient and viscous stress (Hernández-Sánchez et al. Reference Hernández-Sánchez, Eddi and Snoeijer2015). In the case of a deep layer, the spreading radius increases with time as
 $r\sim t^{3/4}$
, due to the same force balance but with the thickness of shear layer determined by viscous diffusion (Koldeweij et al. Reference Koldeweij, Van Capelleveen, Lohse and Visser2019). Kim et al. (Reference Kim, Muller, Shardt, Afkhami and Stone2017) reported a quasi-steady state during the spreading of isopropanol (IPA) droplets on an aqueous bulk surface. A balance of surface force and inertia drives the spreading dynamics, and a scaling law revealed that the diffusion coefficient reduces the spreading radius. Regulating the spreading at the miscible interface would help to control interfacial reactions, especially at interfaces between fluids with different solubilities.
Salting-out is one of the most common effects used for regulating the solubility of solutes in an aqueous solution (Wang et al. Reference Wang, Liu, Ji, Yang, Qian and Yan2021), and it is of interest due to the wide availability of salts in nature. Salts are hydrated in aqueous solution, weakening the hydrogen bonding between water and the solutes, thereby reducing their solubility. Their presence affects the transport and reactivity of organic compounds in hydrometeors (cloud droplets, fog droplets and aerosols) (Ervens, Turpin & Weber Reference Ervens, Turpin and Weber2011) and on the sea surface (Fu et al. Reference Fu, Ciuraru, Dupart, Passananti, Tinel, Rossignol, Perrier, Donaldson, Chen and George2015). In chemical processes, phase separation induced by the salting-out effect benefits both catalytic reactions and nanofibril formation (Hua et al. Reference Hua, Wu, Ma, Zhao, Chen, Frenkel, Strzalka, Zhou, Zhu and He2021; Wang et al. Reference Wang, Liu, Ji, Yang, Qian and Yan2021). Nearly identical macromolecules can be selectively adsorbed onto a solid surface due to their differences in affinity for salt (Reis et al. Reference Reis, Pereira, Ramos, Pereira, Morgado, Calvário, Henriques, Serrano and Pina2024). Salts with hydroxyl groups in biological liquid films, such as the tear film, significantly influence the dynamics of thin films through Marangoni flow (Borkar et al. Reference Borkar, Baumli, Vance, Sharma, Shi, Wu, Yao, Myung and Fuller2024). The spreading of a hydrophilic organic droplet on the free surface of a saline solution serves as a reference process for surface-tension-governed fluid dynamics at a miscible interface with regulated solubility.
In this work, we experimentally investigate the Marangoni spreading of a droplet of hydrophilic organic liquid (referred to in the remainder of the text as organic liquid) on the free surface of a deep layer of a saline solution, accompanied by diffusion into the saline bulk and evaporation into the air above the spreading droplet. It is found that the diameter of quasi-steady spreading varies with the type and concentration of salt, and is primarily determined by the solubility of the organic liquid in the saline solution. The experimentally measured spreading diameter can be used to assess the potential of salting-out, a method for controlling the spreading process. The morphology of the spreading free surface is measured with micron precision, showing a rim forming at the droplet periphery during a temporary non-miscible state. The evaporation field is captured semi-quantitatively, illustrating the reduced evaporation due to mixing. The evaporation remains if the salting-out effect reduces mixing. Existing theories predict the salting-out coefficient, but its magnitude has been determined only for one type of organic liquid and a specific type of salt. Theoretical determination of the salting-out coefficients becomes excessively complicated and unreliable when aqueous solutions of different salts are used. The experimental results reported in this paper will help to determine the salting-out degree and coefficients, thereby providing valuable information for controlling chemical reactions.
2. Experiments
2.1. Solutions used in the experiments
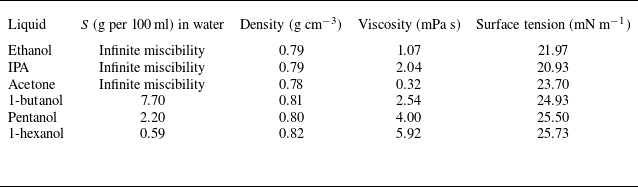
Six types of organic liquids with different solubility in water were used in this work: IPA (from Shanghai Meryer Chemical Technology Co.), ethanol and acetone (from Beijing Tong Guang Fine Chemicals Co.), 1-butanol, pentanol and 1-hexanol (from Sigma–Aldrich). Salts used for the creation of salines at different concentrations were NaCl, LiCl, MgCl2 (from Hong Kong JiSiEnBei International Trade Co.), CH3COONa, Na2CO3, Na2SO4 (from Hebei Pinkeyan Biotechnology Co.), Li2SO4, KCl (from Shanghai Aladdin Biochemical Technology Co.), and CaCl2 (from Sigma-Aldrich). The viscosity and surface tension of saline solutions for different salt types and concentrations are listed in table 1 in Appendix D. The values for organic liquids are listed in table 2 in the same Appendix. The viscosity of liquids was measured using a rheometer (Anton Paar MCR302) with a 15° cone-plate rotor (CP50-1) at 25 °C. The surface tension of liquids was measured by the pendant droplet method (Dataphysics OCA 25).
2.2. Side-view observation and the quasi-steady spreading
In the experiment, a millimetric droplet of an organic liquid with a fixed volume is deposited on the free surface of a 4.5 mm deep saline layer. The surface tension differences between the bulk–air and droplet–air interfaces induce Marangoni spreading. This phenomenon is observed using a side-view set-up (figure 1 a). The surface is illuminated from the side by an LED panel (OPT-DPA 1024 E-4, 48 W), which must be carefully adjusted to ensure a clear image of the spreading droplet. The fast camera (Photron FASTCAM Mini AX50) records free-surface movement at an angle slightly inclined to the horizontal plane.
The experimental set-up and Marangoni-driven spreading of an IPA droplet on the free surface of a thick layer of saline solution. (a) The set-up used for the side-view observation. (b) Typical phenomena of spreading of an IPA droplet on a free surface of 5 wt % NaCl solution, with a blurred periphery. (c) Spreading of an IPA droplet on a free surface of 24 wt % NaCl aqueous solution, with a clear periphery.

A spreading liquid lens (a zone containing spreading organic liquid) is made visible through variations in the interface shape. It is found that a lower salt concentration (5 wt %) in the bulk solution results in a smaller liquid lens diameter with a blurred (but still distinguishable) periphery (see figure 1(b) and supplementary movie 1 are available at https://doi.org/10.1017/jfm.2026.11181). In contrast, a higher salt concentration (24 wt %) results in a larger lens diameter with a distinct periphery border (figure 1(c) and supplementary movie 1).
The experimental conditions correspond to spreading on a thick saline layer. To show that, we note that the viscous dissipation depth is
 $l\sim \sqrt{\upsilon t}$
, with the kinematic viscosity of the bulk fluid
 $\upsilon$
being of the order of
 $5\times 10^{-6}$
m2 s−1, giving
 $l\sim 1.2$
mm at approximately
 $t=300$
ms, which is smaller than the saline depth. The bottom of the saline layer would be reached after 4 s from droplet deposition, whereas spreading is almost complete after 1 s due to mixing between the droplet and the saline.
2.3. The transmission speckle method for measuring free-surface morphology
2.3.1. Experimental set-up
The transmission speckle method is an optical method that measures variations in speckle patterns to extract information about surface deformations. It profits from the refraction of light at the interface between two media with differing refractive indices. When the free liquid surface is perturbed, minor surface undulations occur, refracting light and causing subtle deformations in the transmitted speckle pattern. The experimental set-up is shown in figure 2(a). A polyethylene terephthalate (PET) film printed with speckles (75 % randomness and average dot diameter 0.4 mm) is positioned beneath the liquid container (a 170 mm × 170 mm PMMA chamber) and illuminated from below by an LED panel. The camera is placed on top and focused on the speckle pattern. Digital image correlation (DIC) is used to analyse deformation in speckle images.
The transmission speckle method. (a) Side-view of the experimental set-up. (b) Schematic of the light path (orange arrows). Light refracts at the solid–liquid and liquid–air interfaces, leading to deformation of the transmitted speckle pattern, where
 $s$
signifies the speckle displacement.

2.3.2. Image processing and data analysis
A height reconstruction model was applied to convert the speckles’ displacement field into liquid surface morphology. The acquired images were analysed using DIC. The two-dimensional virtual displacement field of the speckles was computed by comparing each frame’s image to the reference image. Based on Snell’s law and geometric relations, the refraction angles at the interfaces are related to the apparent speckle displacement
 $s$
observed by the camera (figure 2
b) by the following formulas:
 \begin{equation} \begin{aligned} n_{a}\sin \alpha &=n_{l}\sin \beta ,\\ n_{l}\sin \gamma &=n_{g}\sin \theta ,\\ \alpha =\beta &+\gamma\\ s=h_{1}\tan &\gamma +h_{2}\tan \theta .\end{aligned} \end{equation}
Here,
 $n_{a}$
,
 $n_{l}$
and
 $n_{g}$
denote the refractive indices of air, the liquid and the glass container, respectively,
 $h_{1}$
and
 $h_{2}$
represent the depth of the deformed liquid surface and the thickness of the glass container bottom, θ and γ denote the incident and refractive angles at the glass–liquid interface, respectively, and β and α represent the incident and refractive angles at the liquid–air interface. Angle α also represents the local slope of the interface, i.e.
 $h^{\prime}_{1}=\tan \alpha$
(see figure 2
b). A small amplitude of the interface deformation (of the order of microns) allows the use of linearisations
 $h^{\prime}_{1}\approx \alpha$
,
 $\alpha n_{a}=\beta n_{l}$
,
 $n_{l}\gamma =n_{g}\theta$
.
The light passes through two interfaces. The computational complexity associated with double refraction is reduced through the introduction of a fictitious glass surface at a depth
 $h_{0}$
below the bottom of the saline layer. The light ray displacement within this surface is denoted as
 $u$
(see inset in figure 2
b). Linearisations in the form
 $u/h_{2}= \tan\theta \approx \theta$
and
 $u/h_{0}= \tan\gamma \approx \gamma$
lead to
 $h_{0} =h_{2}n_{l}/n_{g}$
and show that the total equivalent liquid layer depth is
 $h_{0}+h_{1}$
. The speckle deformation
 $s$
can thus be treated as resulting from refraction only at the liquid–air interface, but with a liquid layer thickness
 $h_{0}+h_{1}$
. Linearisation of the geometric relation
 $\gamma =\alpha -\beta =\arctan ({s}/({h_{1}+h_{0}}))\approx {s}/({h_{1}+h_{0}})$
combined with
 $\alpha =({n_{l}}/{n_{a}})\beta$
leads to
 \begin{equation}\alpha =\left(\frac{s}{h_{1}+h_{0}}\right)\left(\frac {n_l}{n_l-n_a}\right)=h^{\prime}_{1}.\end{equation}
The liquid layer thickness may be represented as
 $h_{1}=h_{1,0}+\varepsilon$
, where
 $h_{1,0}$
is the thickness before droplet deposition, and
 $\varepsilon$
is the surface deformation, with
 $\varepsilon /h_{1,0}\ll 1$
. The use of this information in (2.2) results in a further simplification, i.e.
 \begin{equation}\alpha =\left(\frac{s}{h_{1,0}+h_{0}}\right)\left(\frac{n_l}{n_l-n_a}\right)=h^{\prime}_{1},\end{equation}
which shows explicitly that the slope of the free surface
 $h^{\prime}_{1}$
is determined by
 $s$
, the measured speckle deformation.
The same arguments can be easily extended to two dimensions, as free-surface shape determination is based on a two-dimensional speckle deformation. The derivatives in the
 $x\hbox{-}$
and
 $y\hbox{-}$
directions are approximated using central finite differences
 \begin{equation}\frac{\partial h_{1}}{\partial x}\left(x_{n},y\right)=\frac{h_{1}\left(x_{n+1},y\right)-h_{1}\left(x_{n-1},y\right)}{2\,{\textrm d}x}, \!\quad\! \frac{\partial h_{1}}{\partial y}\left(x, y_{n}\right)=\frac{h_{1}\left(x,y_{n+1}\right)-h_{1}\left(x,y_{n-1}\right)}{2\,{\textrm d}y},\end{equation}
with
 ${\partial h_{1}}/{\partial x}$
and
 ${\partial h_{1}}/{\partial y}$
determined from the speckle deformation (2.3), and
 ${\textrm d}x$
and
 ${\textrm d}y$
being the step sizes corresponding to one pixel in the experiment. Forward and backward finite differences are applied at the borders. Equation (2.4) can be written in a linear system
 $Ah_{1}=h^{\prime}_{1}$
(Moisy, Rabaud & Salsac Reference Moisy, Rabaud and Salsac2009), where
 $A$
is a sparse matrix with size
 $2N^{2}\times N^{2}$
,
 $h_{1}$
is a vector with size
 $N^{2}$
, and
 $h^{\prime}_{1}$
is a vector with size
 $2N^{2}$
, with
 $N^{2}$
being the total number of pixels. The least squares method is used to solve the overdetermined linear system to reach the minimum of
 $\left\| Ah_{1}-\left.h^{\prime}_{1}\right\| \right._{2}$
, leading to the determination of the two-dimensional height
 $h_{1}(x,y)$
. The computed height of the spreading free surface and radial variations of the surface height are shown and discussed in § 3.2.
Potential errors arise primarily from device alignment and algorithmic factors. Device errors are associated with misalignment between the lens and the imaging plane, while algorithmic errors primarily result from inaccuracies in DIC and the assumption of vertical light incidence. These factors collectively contribute to the observed measurement errors. The digital speckle correlation method has been extensively developed, with numerous studies demonstrating its sensitivity exceeding 0.05 pixel (Schreier Reference Schreier2000; Pan et al. Reference Pan, Xie, Xu and Dai2006). In this experiment, with pixel size 0.0388 mm, the digital speckle correlation technique achieves sensitivity 1.9 μm. The sensitivity of the height measurement, determined from in-plane error 1.9 μm, is 0.7 μm.
2.4. Evaporation at the interface
As shown in § 3, the time the organic liquid remains on the free surface before being mixed into the bulk increases with increasing salt concentration. It is likely that the evaporation, which enhances molecular transport away from the free surface, decreases the quasi-static spreading diameter. The IPA evaporation is detected using a single-mirror schlieren system (Luftvis) with an optical path sketched in figure 3(a). The light emitted from an LED is reflected by a beam splitter to a spherical mirror, which then reflects it, and it passes through the beam splitter again. It is focused on the mirror’s focal point, where a blade is placed, and ultimately forms an image on the high-speed camera. The system is placed on an optical table covered with black cloth, supported by an aluminium frame that minimises airflow and ambient light effects on the vapour field. The droplet was deposited near the optical path’s central axis to reduce the impact of non-parallel optical paths. When the optical path is undisturbed, the schlieren system generates a uniform grey level background on the image plane.
Single mirror schlieren method for detecting the vapour layer of the IPA. (a) The top view of the single mirror schlieren set-up. The droplet spreads in the
 $(x,y)$
-plane, and the evaporation occurs in the
 $z $
-direction. (b) Schlieren image of the vapour layer above the IPA droplet spreading on a free surface of 25 wt % NaCl solution.

After the IPA droplet deposition on the surface, the density of the IPA vapour
 $\rho _{v}$
modifies the refractive index
 $n$
of the medium, which changes linearly with
 $\rho _{v}$
as described by the Gladstone–Dale relation (Settles Reference Settles2001), i.e.
 $n-1=k\rho _{v}$
, where
 $k$
is a proportionality constant. A gradient of refractive index
 $\partial n/\partial z$
is created due to droplet evaporation, and light is deflected away from the focal point and shielded by the blade, reducing the grey level and forming a darkened layer visible above the free surface (figure 3
b). The schlieren method is a semi-quantitative technique for detecting the vapour layer (Settles Reference Settles2001), with the thickness of the darkened zone dependent on the method’s sensitivity, which is influenced by the blade position. Despite this uncertainty, the thickness (
 $H$
) of the darkened layer provides a measure of the thickness of the vapour layer (Kelly-Zion et al. Reference Kelly-Zion, Pursell, Booth and Vantilburg2009). The dependence of evaporation on bulk salt concentration will be discussed in § 3.3.
Diameter of the Marangoni-driven spreading of a hydrophilic organic droplet on the free surface of a thick layer of saline solution. (a) Time variations of the IPA droplet’s mean diameter for different NaCl solution concentrations. Error bars show the variation in results across three independent measurements for each NaCl solution concentration. The vertical dashed line indicates the time (300 ms) when the diameters are assumed to represent the quasi-static spreading diameters
 $2R$
. (b) Variations of
 $2R$
as a function of the salt molar concentration for three types of salts. Dots identify concentrations used in the experiments. Results for other salts are shown in figure 11 of Appendix A. The lines connecting the experimental points facilitate data interpretation. Dashed lines represent the theory (3.1) from Kim et al. (Reference Kim, Muller, Shardt, Afkhami and Stone2017). (c) Schematic representation of the coupled dynamics induced by organic droplet deposition on a free surface of saline solution, including the Marangoni-driven spreading, convective flow within the bulk of the saline, diffusion of IPA molecules into the bulk, and evaporation.

3. Results and discussion
3.1. Diameter of the quasi-steady spreading of a hydrophilic organic droplet on the free surface of saline
For each spreading droplet, the lens diameter increases initially. Eventually, it reaches a quasi-static state, as shown in figure 4(a) for an IPA droplet on an NaCl solution at different concentrations. The temporal variations of spreading radius for other pairs of organic liquids and salts are shown in Appendix A (figure 10). Scaling laws describing the temporal variations of the spreading radius are given in Pant (Reference Pant2024) and Jia et al. (Reference Jia, Peng, Wang, Wang and Sun.2024). This work analyses variations of the quasi-steady state resulting from changes in the solute properties. Kim et al. (Reference Kim, Muller, Shardt, Afkhami and Stone2017) studied the spreading of IPA droplets on the free surface of a viscous fluid. They provided a scaling law for the characteristic time to reach the quasi-steady spreading state, which is determined by molecular diffusion of IPA into the saline solution. The characteristic time is defined as
 $\tau =[\eta _{0}^{1/3} \rho _{b}^{1/3}V^{1/2}/\pi ^{1/2}\rho _{d}^{1/6}{D_{0}}^{1/3}\,\Delta {\gamma _{0}}^{1/2}]$
, where
 $\rho _{b}$
and and
 $\rho _{d}$
stand for the densities of the bulk and the drop, respectively,
 $V$
stands for the volume of the organic droplet,
 $\Delta\gamma _{0}$
denotes the spreading parameter defined as
 $\Delta\gamma _{0}=\gamma _{\textit{bulk-air}}-\gamma _{\textit{IPA-air}}$
, subscript 0 signifies the absence of salt in the bulk of the fluid, and
 $D_{0}$
denotes the diffusion coefficient of IPA molecules in the bulk described by the Stokes–Einstein equation, i.e.
 $D_{0}=k_{B}T/6\pi \eta _{0}a$
. Here,
 $\eta _{0}$
denotes dynamic viscosity of the bulk,
 $a$
stands for the IPA molecular radius,
 $k_{B}$
is the Boltzmann constant, and
 $T$
denotes the temperature. In our work, the saline solutions at different concentrations result in
 $\tau$
in the range 50–200 ms. However, as shown in figure 4(a), the quasi-steady state had not been reached at 200 ms, especially for the salines at high concentrations. This can be attributed to a smaller diffusion coefficient due to the presence of salt, which will be discussed in § 3.4. Here, we adopt the spreading diameter at 300 ms as a measure of the quasi-steady state, and refer to it as the quasi-static lens diameter (
 $2R$
). This is the moment when the organic droplets on low-concentration saline solutions reach a quasi-static radius. The spreading is not yet terminated for droplets on high-concentration saline solutions, but the droplets are close enough to the quasi-steady state so that the experiment and the theory remain valid, as discussed later. It is demonstrated that the quasi-static diameter increases with increasing saline concentration for all salt–organic liquid combinations used in the experiment (see figure 4(b), and figure 11 in Appendix A). Furthermore, it is shown that the quasi-static diameter depends on the type of salt. For instance, LiCl, with the smallest positive ion and the fewest charges, leads to a slow increase in the quasi-static diameter with increasing salt concentration. The Na2SO4 and Na2CO3 solutions with the two positive ions produce the largest increase in the quasi-static diameter (figures 4(b) and 11).
Based on an interplay between the effect of surface tension and inertia, the scaling law developed by Kim et al. (Reference Kim, Muller, Shardt, Afkhami and Stone2017) estimates the quasi-static spreading radius to be
 \begin{equation}R_{0}\approx \left(\frac{\Delta\gamma _{0}V^{3}}{\pi ^{3}\rho _{d}{D_{0}}^{2}}\right)^{1/8}.\end{equation}
In our work, the addition of salt to the bulk increases both the surface tension difference
 $\Delta\gamma$
and the bulk viscosity η (see tables 1 and 2 in Appendix D). The variations in the resulting quasi-static diameter
 $2R$
as a function of the salt molar concentration are determined using (3.1) and illustrated in figure 4(b) (see dashed lines). The theoretical line has a significantly smaller slope than the lines constructed based on experimental data. Equation (3.1) was developed under the assumption of infinite miscibility between the droplet and the bulk solution. The difference between the theoretical and experimental results suggests that the solubility of the organic liquid in a saline solution should be considered.
Further complications arise from the fact that Marangoni spreading induces convection in the bulk of the saline and is accompanied by the transport of organic molecules from the free surface into the bulk by molecular diffusion and into the air by evaporation, as shown in figure 4(c).
3.2. Morphology of the free surface during spreading
As shown in figures 1(b) and 1(c), the salt concentration in the bulk affects the morphology of the free surface of the spreading droplet, which may or may not involve a contact-line-like periphery that can be visually observed with the naked eye. The free-surface elevation can be measured with
 $1\, \mu \textrm{m}$
accuracy using the transmission speckle method (Liu et al. Reference Liu, Guo, Shi, Huang and Xie2015), which relies on measuring the deformation of the speckles’ image caused by light refraction on the deformed free surface (figure 2). The reader may note that the droplet and the bulk have similar refractive indices, so the image deformation is due to the light refraction at the free surface. Figure 5(a) shows an experimentally recorded image of an IPA droplet spreading on the free surface of a 24 wt % NaCl aqueous solution, which is then analysed using the DIC method. Figure 5(b) displays the three-dimensional reconstruction of the free surface, showing a quasi-static rim at the droplet periphery, and radial waves propagating outwards (see also supplementary movie 2). The free-surface profile in the radial direction (figure 5
c) permits the determination of the height of the rim, which is of the order of 5
 $\mu \textrm{m}$
. The diameter of the rim is nearly the same as the diameter of the quasi-static lens seen in the side view (inset of figure 5
c), suggesting that the contact-line-like periphery observed by naked eye (figure 1
c) corresponds to a free-surface perturbation with amplitude
 $5\, \mu \textrm{m}$
.
Measurements of the surface morphology of the spreading droplet using the transmission speckle method. (a) Image of the speckle pattern (lower half) for IPA droplet spreading on NaCl aqueous 24 wt % solution, and the displacement field extracted from this image using the DIC method (upper half). (b) A three-dimensional reconstruction of the shape of the surface of the spreading droplet, showing a quasi-static rim with a nearly time-independent radius and waves propagating radially outwards. (c) Radial variation of the free-surface height during droplet spreading on the saline bulk. The orange dashed lines mark the rim positions, and the grey shaded regions denote the uncertainty bands corresponding to radial standard deviations of 1.3 mm, which result from four identical experiments. The side-view image (inset) shows that the rim diameter matches the visually measured spreading diameter, as in figure 4(a).

The results of measurements of the IPA spreading droplet diameter at quasi-steady state by both the side-view method and the transmission speckle method at different NaCl concentrations are consistent, as demonstrated in figure 6. The double-direction arrows in this figure represent the measured spreading diameter using the side-view set-up (see figure 1). Results indicate that no rim occurs for droplet spreading on the free surface of pure water bulk; for surfaces of saline bulk, the rim location corresponds to the visual periphery (see figures 1(b,c) in § 2.3).
Radial profiles of the free-surface height during the spreading of an IPA droplet on NaCl solutions of varying concentrations, taken 300 ms after deposition: (a–h) concentrations of 0 wt %, 5 wt %, 10 wt %, 15 wt %, 17 wt %, 19 wt %, 20 wt %, and 25 wt %, respectively. For each concentration, two independent experiments are performed to demonstrate reproducibility. The orange dots mark the rim positions, and the grey-shaded regions denote the uncertainty bands corresponding to the radial standard deviations in the determination of the rim location. The double-headed arrows indicate the spreading diameters obtained from side-view measurements (see figure 1), and show good agreement with the rim diameters determined by the transmission speckle method.

As previously reported, the rim forms near the triphase contact line when a droplet spreads on a non-miscible substrate (Keiser et al. Reference Keiser, Bense, Colinet, Bico and Reyssat2017; Li et al. Reference Li, Pahlavan, Chen, Liu, Li, Stone and Granick2023; Jaberi, Debenest & Plouraboué Reference Jaberi, Debenest and Plouraboué2023), leading to contact line instability. However, the experiments reported in this paper have no real contact line, as the organic liquid and water are miscible. The addition of salt renders the organic liquid temporarily non-miscible, resulting in a bump in the interface shape but no real contact line, as this effect is too weak.
3.3. Evaporative field of the IPA droplet above the free surface
Supplementary movie 3 illustrates the process of IPA evaporation captured by the schlieren method. The darkened layer above the evaporating IPA droplet on the free surface thickens, then thins and eventually disappears over time. To eliminate problems related to non-uniform incident light, we use grey level variation
 ${\unicode[Arial]{x0394}} I$
, which refers to the instantaneous grey level change compared to the background. Figure 7(a) illustrates variations of the difference between the grey level at the current time and the background
 ${\unicode[Arial]{x0394}} I_{({y}=0)}$
along the vertical line (
 $z$
-direction) above the droplet. Coordinates are defined in figure 3(b). Here,
 $z=0$
corresponds to the position of the free surface before droplet deposition, as explained in figure 12 in Appendix B. The inset of figure 7(a) illustrates explicitly an increase and subsequent decrease of the vapour layer thickness
 $H$
, which is defined as the thickness of the zone where
 ${\unicode[Arial]{x0394}} I_{(y=0)}\gt 10$
.
The evaporation of the spreading IPA droplet measured by the schlieren method. (a) An IPA droplet spreading on NaCl solutions at different concentrations. Grey level variation
 ${\unicode[Arial]{x0394}} I_{y=0}$
along the vertical direction (
 $z $
) above the droplet deposition point at different times during spreading. The red and blue arrows indicate the initial thickening and subsequent thinning of the vapour layer, respectively. The inset shows the temporal evolution of the vapour layer thickness (darkened zone), where
 $H$
denotes the thickness of the layer with
 ${\unicode[Arial]{x0394}} I_{y=0}\gt 10$
. (b) The time variation of
 ${\unicode[Arial]{x0394}} I_{y=0,\,{z}={0^{+}}}/2R$
(proportional to the evaporation flux
 $J$
) just above the free surface (at
 $z=0.82$
mm) for different concentrations of NaCl solution. Results for a glass surface are added for reference. The blue arrow indicates the direction of decreasing evaporation flux
 $J$
with decreasing salt concentration. The inset shows an initial increase and then a decrease of
 ${\unicode[Arial]{x0394}} I_{y=0,\,{z}={0^{+}}}$
until the total mixing of the IPA droplet into the saline bulk. (c,d) Similar results for an IPA droplet spreading on an Na2SO4 free surface at different concentrations.

The free surface vibrates after droplet deposition, which significantly affects the grey level in its vicinity. As a result, the grey level was measured slightly above the free surface, where the effect of vibrations was negligible. The selected location was
 $z=0^{+}=0.82$
mm, and
 ${\unicode[Arial]{x0394}} I_{z={0^{+}}}$
denotes
 ${\unicode[Arial]{x0394}} I$
measured there. This height represents a suitable compromise, allowing observation of the vapour field above and near the free surface while minimising vibration-induced grey level perturbations.
After the IPA droplet deposition on the free surface, the grey level
 ${\unicode[Arial]{x0394}} I_{y=0,\, z={0^{+}}}$
(at the position
 $y=0$
and
 $z=0^{+}$
) increased and then decreased over time until the droplet was completely mixed with the saline (see the coloured curves in the inset of figure 7
b). In the experimental set-up, local
 ${\unicode[Arial]{x0394}} I$
is determined by integrating the first spatial derivative of the refractive index along the light path – specifically, along the distance that scales with the spreading diameter
 $2R$
(see Appendix B). The grey level can be estimated at a given
 $z$
elevation as
 ${\unicode[Arial]{x0394}} I\sim 2R\,\partial n/\partial z\sim 2R\,\partial \rho _{v}/\partial z$
. Since the vapour density gradient at
 $z=0^{+}$
reflects the evaporative flux
 $J=D_{v}\,\partial \rho _{v}/\partial z$
above the free surface, with
 $D_{v}$
denoting the IPA diffusion coefficient in the air, we have
 ${\unicode[Arial]{x0394}} I_{y=0,\,{z}={0^{+}}}/2R\propto J/D_{v}$
, i.e. the normalised grey level variation
 ${\unicode[Arial]{x0394}} I_{y=0,\,{z}={0^{+}}}/2R$
is an indicator of the evaporative flux
 $J$
. The temporal variations of
 ${\unicode[Arial]{x0394}} I_{y=0,\,{z}={0^{+}}}/2R$
are shown in figure 7(b) for salines with different NaCl concentrations, including data for the same droplet deposited on a solid hydrophilic glass surface. The results indicate that the
 ${\unicode[Arial]{x0394}} I_{y=0,\,{z}={0^{+}}}/2R $
which represents the evaporative flux
 $J$
(the evaporated mass per unit of surface and unit of time) is the highest on a solid surface and decreases with decreasing salt concentration, as shown by the blue arrow in figure 7(b). Note here that
 $R$
is taken from the spreading radius measured in the side-view experiment (figure 1). Since
 $R$
is no longer measurable at time intervals when
 ${\unicode[Arial]{x0394}} I_{y=0,\, z={0^{+}}}$
decreases, the curves in figure 7(b) only show the increase of
 ${\unicode[Arial]{x0394}} I_{y=0,\,{z}={0^{+}}}/2R$
. Similar results for Na2SO4 solutions are shown in figures 7(c) and 7(d). These results indicate that mixing IPA with the aqueous solutions significantly inhibits the evaporative flux. They also demonstrate that increasing the salt concentration delays mixing and partially retains the evaporative flux.
The measured grey level variations above and close to the free surface at
 $z=0.82$
mm (here denoted as
 $z=0^{+}$
) along the
 $y$
-direction are plotted in figure 8 for NaCl and Na2SO4 solutions at different concentrations. The curves have been smoothed out to illustrate a clear trend and facilitate comparisons among different solutions. The extent of evaporation in the
 $y$
-direction increases with increasing salt concentration, consistent with the observed increase in the spreading diameter
 $2R$
, as documented in the side-view experiment (figure 4).
Grey level variation
 ${\unicode[Arial]{x0394}} I_{z={0^{+}}}$
along the
 $y$
-direction at the elevation
 $z=0.82$
mm above the initial free surface after 600 ms from the moment of droplet deposition. Colours represent different concentrations of saline solutions: (a) NaCl bulk and (b) Na2SO4 bulk.

The schlieren analysis is not quantitative in measuring the evaporation flux. However, since the only variable in the experiments reported here is the concentration of salt in the saline, variations in darkened area with salt concentration indicate differences in evaporation flux.
Although the Marangoni spreading, combined with IPA mixing into the bulk, significantly inhibits evaporation, the evaporation itself has a negligible effect on the spreading process. The time the IPA droplet remains on the free surface (less than 1 s) is approximately two orders of magnitude shorter than that on the solid surface (up to 100 s), as shown in figure 7(b). Supposing that the evaporation rate on the solid surface is constant, the evaporated volume within 1 s eliminates less than 1 % of the total droplet volume. We estimate that the evaporated volume on the free liquid surface within 1 s eliminates at most 3 % of the deposited droplet. Therefore, we can conclude that evaporation does not significantly affect the spreading process. This conclusion is supported by comparing the characteristic times. A spreading droplet with volume
 $V\approx 3\, \mu \textrm{l}$
can be assumed to be in the form of a pancake with diameter
 $2R\approx 20$
mm, and thickness
 $h_{0}\approx 8\, \mu \textrm{m}$
. The characteristic evaporation time is
 $t_{e}=h_{0}\rho _{d}/J_{\textit{a}v\textit{e}}\sim 0.2$
s, where the average evaporation flux
 $J_{\textit{a}v\textit{e}}$
was taken from an analogous situation where an IPA droplet was deposited on a water layer and evaporated into moist air (Yang et al. Reference Yang, Pahlavan, Stone and Bain2023). The characteristic molecular diffusion time is
 ${{t_{d}}=h_{0}}^{2}/D\sim 64$
ms, where the diffusion coefficient of IPA molecules in water is
 $D\sim 10^{-9}$
m2 s−1. The characteristic convection time is
 $t_{c}=R/v\sim 0.1$
s, with the velocity of spreading taken as
 $v\sim 0.1$
m s−1. The fact that
 $t_{e}$
is large compared with
 $t_{d}$
and
 $t_{c}$
suggests that the spreading process is dominated by mixing and convection in the saline, and not by evaporation. Besides, the Bond number, which indicates the relative importance between buoyancy and surface tension, is at
 $O(10^{-4})$
, for a density gradient established in the vicinity of the free surface due to the addition of organic liquid.
3.4. The salting-out effect regulates the quasi-steady spreading diameter
We propose an explanation for why the diameter of the quasi-static spreading lens increases in the presence of salt, as shown in figure 4(b). Equation (3.1) (Kim et al. Reference Kim, Muller, Shardt, Afkhami and Stone2017) provides a reference point, which is the spreading diameter at an infinitely miscible interface. It needs to be modified to account for the organic liquid’s finite solubility in saline solution. The solubility, which is a thermodynamic term, represents the degree of mixing at equilibrium. Diffusion, which is a dynamic term, represents the rate of mixing. The diffusion flux of a solute in a solvent for a binary system is defined by (Taylor & Kooijman Reference Taylor and Kooijman1991)
 \begin{equation}\boldsymbol{J}_{1}=-D\boldsymbol{\nabla }c_{1},\end{equation}
where
 $c_{1}$
denotes the molar concentration (
 $\textrm{mol}\ \textrm{l}^{-1}$
) of the solute in the solvent, and
 $D$
is the Fick diffusion coefficient, which incorporates the effects of the inverse drag and the thermodynamic non-ideality (Taylor & Krishna Reference Taylor and Krishna1993). To decouple the contributions, the diffusion coefficient is defined as
 \begin{equation}D=D_{\textit{M-S}} \varGamma,\end{equation}
where
 $D_{\textit{M-S}}$
is the Maxwell–Stefan diffusion coefficient obeying the Stokes–Einstein relation when the solute is infinitely diluted in the solvent (Taylor & Krishna Reference Taylor and Krishna1993). Since this work involves a small amount of organic liquid diffusing into the saline solution,
 $D_{\textit{M-S}}=k_{B}T/6\pi \eta a$
, expressing the significance of the inverse drag acting on the solute molecules by molecular collision. Herein,
 $\eta$
denotes the dynamic viscosity of the saline solution,
 $a$
stands for the organic molecular radius,
 $k_{B}$
is the Boltzmann constant, and
 $T$
stands for the temperature. On the other hand, thermodynamic non-ideality is essential for phase separation; it arises when the mixture’s volume no longer satisfies simple additivity, and heat exchange occurs during mixing. The thermodynamic non-ideality is described by the thermodynamic factor
 $\varGamma$
. In this work, where a binary mixture of the organic solute and the saline solution (where the saline solution is treated as a single component) is considered,
 $\varGamma$
is defined as (Taylor & Kooijman Reference Taylor and Kooijman1991)
 \begin{equation}\varGamma =1+x_{1}\frac{\partial\!\ln \gamma _{1}}{\partial x_{1}},\end{equation}
where
 $x_{1}$
and
 $\gamma _{1}$
denote the mole fraction and the activity coefficient of the organic solute in the mixture, respectively. The activity coefficient describes the extent to which a real solution with thermodynamic non-ideality deviates from the ideal solution. According to the Setschenow equation, the activity coefficient is related to the solubility of the organic liquid in the saline solution (McDevit & Long Reference McDevit and Long1952):
 \begin{equation}\log _{10}\frac{\gamma _{1}}{\gamma _{0}}=\log _{10}\frac{S_{0}}{S}=K_{s}C^{\circ},\end{equation}
where
 $\gamma _{0}$
is the activity coefficient of the organic solute in pure water. Since the organic droplets are sufficiently small in quantity relative to the saline solution,
 $\gamma _{0}$
can be approximated as
 $\gamma _{0}\approx 1$
, according to Henry’s law (Atkins, de Paula & Keeler Reference Atkins, de Paula and Keeler2018). In the above,
 $S_{0}$
(
 $\textrm{mol}\ \textrm{l}^{-1}$
) and
 $S$
(
 $\textrm{mol}\ \textrm{l}^{-1}$
) stand for the solubilities of the organic liquid in pure water and in saline solution, respectively,
 $C^{\circ}$
denotes the molar concentration of the salt in the solution, including organic liquid, and
 $K_{s}$
denotes the Setchenow coefficient (or the salting-out constant), which characterises the ability of salt to regulate the solubility of the organic liquid in the aqueous solution. The molar concentration of the salt in the mixture (including organic liquid) is expressed as
 \begin{equation}C^{\circ}=\frac{x_{2,S}\left(1-x_{1}\right)}{V_{m}},\end{equation}
where
 $x_{2,S}$
denotes the mole fraction of salt in the saline, and
 $V_{m}$
(
 $\textrm{l}\ \textrm{mol}^{-1}$
) denotes the molar volume of the mixture. Substituting (3.5) and (3.6) into (3.4), we arrive at the relation
 \begin{equation}\varGamma =1-\ln 10 \cdot K_{s} \cdot \frac{x_{2,S}}{V_{m}} \cdot x_{1}.\end{equation}
We assume that the addition of a small amount of the organic solute does not induce a significant change to the molar volume
 $V_{m}$
, which implies that
 $x_{1}$
is small compared to 1, and
 ${C^{\circ}}\approx x_{2,S}/V_{m}$
and reduces to
 $C$
, which is the molar concentration of the salt in the saline solution. Therefore, (3.7) simplifies to the form
 \begin{equation}\varGamma =1-\ln 10 \cdot K_{s}C \cdot x_{1}=1- \ln 10 \cdot \log _{10}\frac{S_{0}}{S} \cdot x_{1},\end{equation}
where advantage was taken of (3.5). When a local saturation of the organic solute in the saline solution is achieved at the interface during the droplet spreading, we have
 $x_{1\_ sat}=SV_{m\_ sat}$
, where the subscript ‘sat’ signifies the saturation state, and the thermodynamic factor at the free surface with local saturation can be expressed as
 \begin{equation}\varGamma _{\textit{sat}}=1-SV_{{m\_{\textit{sat}}}} \ln 10 \cdot \log _{10}\frac{S_{0}}{S}=1+S_{0}V_{{m\_{\textit{sat}}}}\frac{S}{S_{0}}\ln \frac{S}{S_{0}}.\end{equation}
The product
 $S_{0}V_{m\_ sat}$
represents the saturated mole fraction of the organic liquid in pure water, where we assume that
 $V_{m\_ sat}$
remains unaffected by the addition of salt, so that
 $S_{0}V_{m\_ sat}\approx 1$
due to their infinite miscibility. Consequently, the final simplified expression for
 $\varGamma _{\textit{sat}}$
becomes
 \begin{equation}\varGamma _{\textit{sat}}=1+\frac{S}{S_{0}}\ln \frac{S}{S_{0}}.\end{equation}
As
 $S/S_{0}$
decreases from 1, which corresponds to an increasing concentration of salt,
 $\varGamma _{\textit{sat}}$
varies non-monotonically, i.e. it decreases from 1 to
 $1-1/{\textrm e}$
, which is the minimum value at
 $S/S_{0}=1/{\textrm e}$
, and then increases as
 $S/S_{0}$
further decreases. For
 $S/S_{0}$
in the interval between
 $1/{\textrm e}$
and 1, the thermodynamic factor
 $\varGamma$
can be further approximated as
 $\varGamma _{\textit{sat}} \approx S/S_{0}$
. This approximation is valid for organic liquids with evident solubility, even in the presence of salt. It can therefore be applied to correct the Fick’s diffusion coefficient used in this work, i.e.
 \begin{equation}D=D_{\textit{M-S}}\frac{S}{S_{0}}.\end{equation}
If we replace the diffusion coefficient in (3.1) with (3.11), then we obtain the expression for the diameter of the quasi-static organic liquid lens on the surface of the saline in the form
 \begin{equation}R\approx \left(\frac{{\unicode[Arial]{x0394}} \gamma V^{3}}{\pi ^{3}\rho _{d}\left(D_{\textit{M-S}}S/S_{0}\right)^{2}}\right)^{1/8}=A\frac{{\unicode[Arial]{x0394}} \gamma ^{1/8}\,{\eta} ^{1/4}}{\left(S/S_{0}\right)^{1/4}},\end{equation}
where
 ${\unicode[Arial]{x0394}} \gamma =\gamma _{\textit{bulk-air}}-\gamma _{\textit{drop-air}}$
,
 $\eta$
stands for the dynamic viscosity of the saline solution, and
 $A=(V^{3}/\pi ^{3}\rho _{d})^{1/8}(6\pi a/k_{B}T)^{1/4}$
is a constant determined by the type of the organic liquid (the volume, density and organic molecule size remain unchanged). The normalised radius of organic liquid spreading on saline solution can be written as
 \begin{equation}R/R_{0}=\left(\frac{{\unicode[Arial]{x0394}} \gamma }{{\unicode[Arial]{x0394}} \gamma _{0}}\right)^{1/8}\left(\frac{\eta }{\eta _{0}}\right)^{1/4}\exp{\left(\frac{(\ln 10)\, (K_{s} C)}{4}\right)},\end{equation}
where
 $R_{0}\approx ({{\unicode[Arial]{x0394}} \gamma _{0}\,V^{3}}/{\pi ^{3}\rho _{d}(D_{0})^{2}})^{1/8}=A({{\unicode[Arial]{x0394}} \gamma _{0}}^{1/8}\,{{\eta} _{0}}^{1/4})$
is the radius of the quasi-static organic liquid lens on pure water. Variations of
 $R/R_{0}$
are plotted for fifteen different salt–organic liquid pairs in figures 9(a–c), in which
 $R$
and
 $R_{0}$
are experimentally measured. Each curve in figures 9(a–c) is fitted with an exponential curve, leading to the determination of the Setchenow coefficient
 $K_{s}$
. The experiments conducted in this study yielded salting-out constants for 15 pairs of salts and organic liquids. We note that the choice of the characteristic time to reach the quasi-steady state (300 ms in figure 4
a) might affect the radii used for the exponential fitting. We verified that the standard deviation of the
 $K_{s}$
value obtained from an interval of characteristic time between 250 ms and 350 ms is less than 3 %, indicating that a fluctuation in the characteristic time of the quasi-steady state plays a minor role in the determination of the salting-out constant.
Quasi-static lens diameter used to determine the salting-out constant. (a–c) Variations of
 $R/[R_{0}({\unicode[Arial]{x0394}} \gamma /{\unicode[Arial]{x0394}} \gamma _{0})^{1/8}(\eta /\eta _{0})^{1/4}]$
as a function of the molar salt concentration in saline for fifteen different combinations of salt and organic liquid. Distinct points represent experimental data, and solid lines represent the results of exponential fittings used to determine the salting-out constant
 $K_{s}$
. (d) Comparison between the
 $K_{s}$
values determined experimentally and from the IPT. The solid line represents the linear fitting.

Several theoretical models were proposed for the determination of
 $K_{s}$
, such as the Debye–Macaulay theory based on the electrostatic effects, the Conway–Desnoyers–Smith theory, the internal pressure theory (IPT), and the scaled particle theory, which were reviewed and compared by Xie et al. (Reference Xie, Li and Zhu2024). Theories give, in general, similar but not the same values of
 $K_{s}$
. The IPT (McDevit & Long Reference McDevit and Long1952) is based on the volume change of the liquid caused by the addition of salt and non-electrolyte, and gives the salting-out constant in the form
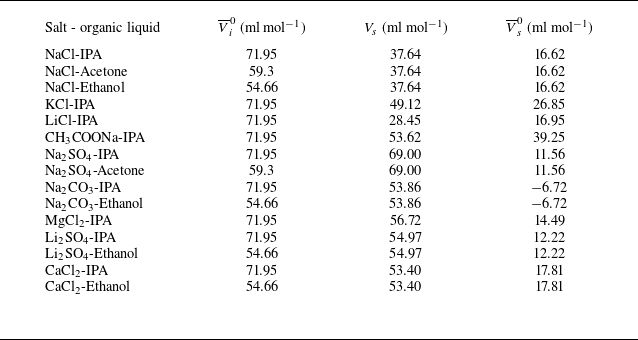
 \begin{equation}K_{s}=\frac{\overline{V}_{i}^{0}\left(V_{s}-\overline{V}_{s}^{0}\right)}{2.3\beta _{0}\mathcal{R}T},\end{equation}
with
 $\overline{V}_{i}^{0}$
and
 $\overline{V}_{s}^{0}$
being the partial molar volumes at infinite dilution for the non-electrolyte and the salt, respectively. The partial molar volumes at infinite dilution signify the change of solution volume when 1 mol of a substance is added to an infinitely diluted solution. Here,
 $V_{s}$
stands for the molar volume of salt in a molten liquid state, and
 $V_{s}-\overline{V}_{s}^{0}$
signifies the compression in total volume that occurs during the mixing of salt and water, which increases the difficulty of inserting non-electrolyte molecules and results in salting-out. In short, IPT states that the degree of salting-out is proportional to the organic liquid’s ability to occupy volume in aqueous solution and to the salt’s ability to compress the solution volume. Also,
 $\beta _{0}$
stands for the compressibility of pure water,
 $\mathcal{R}$
is the ideal gas constant, and
 $T$
is the temperature. Values of
 $\overline{V}_{i}^{0}$
for organic liquids, and
 $V_{s}$
and
 $\overline{V}_{s}^{0}$
for the salts used in these experiments, are provided in table 3 in Appendix D. The experimentally determined
 $K_{s}$
, and values obtained from IPT, are shown in figure 9(d). Their comparison demonstrates that the
 $K_{s}$
values determined using two independent methods display a linear correlation with slope 0.485.
At low salt concentrations, where the Setchenow equation (3.5) is valid, the solubility of the organic liquid in saline solution decreases exponentially with increasing salt concentration, slowing its mixing into the bulk. As a result, the radius of the spreading droplet remaining on the free surface increases. Measuring the spreading radius provides a means of assessing the ability of salt to regulate the solubility of organic liquids in an aqueous solution and estimating the salting-out ability of a particular salt–organic liquid combination.
Equation (3.5) is not satisfied at high salt concentrations (close to the saturation for Na2SO4 and Na2CO3 solutions), in which the measured quasi-static lens radius decreases with an increased salt concentration (i.e. with decreasing solubility of the organic liquid; see figures 4(b) and 11(d)). A similar phenomenon occurs when alcohols with different carbon chain lengths are spread on pure water, demonstrating that increasing carbon chain length decreases their solubility in water (see figure 14 in Appendix C). For example, 1-butanol, with a solubility in water smaller than that of IPA, shows a larger lens radius, whereas pentanol and 1-hexanol, with significantly lower solubilities, exhibit a smaller lens radius. To explain this, we refer to (3.10) for the expression of the thermodynamic factor at saturation
 $\varGamma _{\textit{sat}}$
. It increases when the normalised solubility
 $S/S_{0}$
decreases for
 $S/S_{0}\lt 1/{\textrm e}$
, thus leading to a larger diffusion coefficient
 $D$
and therefore a smaller spreading radius. The salts with a larger salting-out constant
 $K_{s}$
, such as Na2SO4 and Na2CO3, have smaller solubility than other salts with the same molar concentration
 $C$
, so their spreading radius decreases more significantly when
 $C$
further increases, as shown in figure 4(b).
4. Summary
In this work, we show that the quasi-steady state of Marangoni spreading on a miscible interface can be significantly altered by the solubility of hydrophilic organic liquid in the saline solution. At the Marangoni spreading time scale, the salting-out effect reduces solubility, leading to a larger spreading diameter as salt concentration increases. Additionally, different salts exhibit varying salting-out abilities for the same organic liquid. A surface morphology measurement suggests a temporarily immiscible interface. The Marangoni spreading terminates when the organic liquid is completely dissolved in the saline, driven by the convective flow (Chong et al. Reference Chong, Li, Ng, Verzicco and Lohse2020), which continuously replenishes the pure saline solution at the interface. The evaporative flux of the organic liquid is significantly inhibited by Marangoni spreading and associated mixing, with negligible effect on the spreading radius. The Marangoni spreading experiments, combined with the use of exponential fitting, can be a practical method to determine the salting-out constants
 $K_{s}$
for pairs of salt and organic liquid of interest, especially for saline solutions containing multiple salts, such as seawater and human body fluids, in which the classical theoretical methods for estimating the salting-out constants might be too complex to succeed. This work presents experimental data that can be used to construct theoretical models and numerical simulations of Marangoni spreading at a miscible interface with regulated solubility.
Supplementary movies
Supplementary movies are available at https://doi.org/10.1017/jfm.2026.11181.
Acknowledgements
We thank G. Chen, Q. Wang, J. Li and S. Xie for their helpful discussions. We also thank Q. Tian, K. Luo and Y. Ju for their generous support with equipment and chemicals. Additionally, we appreciate the support of the State Key Laboratory of Tribology at Tsinghua University for the measurements of fluid viscosity and surface tension.
Funding
This work is supported by the National Natural Science Foundation of China (NFSC) under grant nos 12472269, 12325206 and 12072033.
Declaration of interests
The authors report no conflict of interest.
Appendix A. Temporal variation of spreading diameter and quasi-static diameters
The temporal variations of the spreading diameter for different combinations of organic liquids and saline are shown in figure 10 for various saline concentrations. The dependence of diameters on saline concentration at quasi-steady state is shown in figure 11.
Temporal variations of spreading diameter for hydrophilic organic droplets spreading on saline solutions with different salt concentrations: (a–c) CaCl2-IPA, CaCl2-Ethanol, CH3COONa-IPA, respectively; (d–f) KCl-IPA, Li2SO4-IPA, Li2SO4-Ethanol, respectively; (g–i) LiCl-IPA, MgCl2-IPA, Na2CO3-Ethanol, respectively; (j–l) Na2CO3-IPA, Na2SO4-IPA, Na2SO4-Acetone, respectively; (m,n) NaCl-Ethanol, NaCl-Acetone, respectively. Dashed vertical lines represent the state of quasi-steady spreading.

Variations of the quasi-static spreading diameter
 $2R$
as a function of the salt molar concentration
 $C$
for 12 pairs of salt–organic liquid combinations. Dots identify experimental points, while solid lines connecting them aid data interpretation. Dashed lines represent theoretical results obtained using (3.1) (Kim et al. Reference Kim, Muller, Shardt, Afkhami and Stone2017). Theoretical data are multiplied by a constant to match the experimental
 $2R$
at
 $C=0$
to illustrate the trends. Measured viscosity and surface tension of saline solutions are given in table 1 in Appendix D.

Appendix B. Discussion of the schlieren method used in the investigation of the evaporation process
It is difficult to determine the position of the free surface in the schlieren experiments. The enlargement of the vicinity of the free surface, as displayed in figure 12, shows the ‘bright’ and ‘dark’ vibrating zones with total thickness 4 pixels, or approximately 0.51 mm. This means that the schlieren image can establish the position of the free surface with accuracy 0.51 mm. Since we measure
 ${\unicode[Arial]{x0394}} I$
along the
 $z$
-direction, the determination of the location corresponding to
 $z=0$
is essential but can be determined only with uncertainty 0.51 mm.
During the same set of experiments with different salt concentrations, when the spreading radius is larger (at higher salt concentration), the vapour begins appearing in the optical path closer to the spherical mirror, and the light begins to be deflected there. In this appendix, we estimate the impact that the spreading radius has on the greyscale.
As shown in figure 13, the non-deflected light departed from the spherical mirror is focused onto point A. The angle to the horizon is
 $\theta _{1}=\arctan (H/l_{2})$
. The air refractive index is
 $n_{1}=1$
, and that of liquid IPA is
 $n_{2}=1.378$
. The IPA droplet is deposited 400 mm from the mirror. The thickness of the vapour layer is
 $O_{1}O_{2}=H\leq 4\, \textrm{mm}$
, and the axial distance between the mirror and the blade is
 $AE=l=1500\, \textrm{mm}$
. In the optical path, the axial distance of the first appearance of vapour relative to the mirror is
 $O_{1}E=l_{1}=400\, \textrm{mm}-R$
, with
 $R$
denoting the spreading radius. The axial distance from the blade is
 $AO_{1}=l_{2}=1100\, \textrm{mm}+R$
.
Enlargement of the zone near the free surface. The darkest bottom areas represent the saline bulk. Bright and dark zones above that saline have a thickness of two-pixel lines each, in total corresponding to 0.51 mm. This determines the uncertainty in the free-surface position, which is 0.51 mm. We consider the position of the free surface at rest (before droplet deposition) as located at
 $z=0$
, which is the border between the bright and the dark zone marked using a cross with subscript 1. The position
 $z=0^{+}$
corresponds to
 $z=0.82$
mm, which is located where the grey level is not perturbed by surface vibration and identified using a cross with subscript 2.

Optical path in the schlieren system illustrating the light deflection.

The refraction angle
 $\theta _{2}$
can be obtained from Snell’s law,
 $n_{1}\sin\theta _{1}=n_{2}\sin\theta _{2}$
. The vertical distance of the point of light on the image plane from the point
 $O_{2}$
is
 ${d=l_{2}}\tan \theta _{2}$
. Here,
 $H-d$
is the deflection distance, which is already overestimated because the liquid IPA optical index
 $n_{2}$
is applied here instead of the vapour IPA.
For different spreading radii, the deflection’s starting position and magnitude vary. We use the NaCl maximum static-state radius
 $R_{1}\approx 7\ \text{mm}$
and minimum static-state radius
 $R_{2}\approx 3\ \text{mm}$
for comparison, with corresponding
 $\theta _{1}^{R=7\, mm}=0.20703^{\circ}$
and
 $\theta _{1}^{R=3 mm}=0.20778^{\circ}$
, respectively. The vertical distances
 $d$
can be obtained as
 $d_{R=7\, mm}=2.90274978\ \text{mm}$
and
 $d_{R=3\, mm}\, =2.90273879\ \text{mm}$
, respectively. The relative difference
 $(d_{R=7\, mm}-d_{R=3\, mm})/d_{R=7\, mm}=3.786\times 10^{-6},$
which can be ignored. Therefore, the starting position of the light deflection has a negligible effect on the grey level variation
 ${\unicode[Arial]{x0394}} I$
. The different
 ${\unicode[Arial]{x0394}} I$
observed for different saline solutions result from variations in vapour flux and its integration along the spreading diameter, while
 ${\unicode[Arial]{x0394}} I$
is less influenced by the optical path.
Spreading diameter of alcohol droplets with low solubility in water on the surface of pure water. (a–c) Images of spreading droplets of 1-butanol, pentanol and 1-hexanol, respectively, with the visually distinct periphery. (d) Temporal variations of spreading diameters of different alcohols.

Appendix C. Quasi-static spreading radius of alcohols at very low solubility
As shown in the main text, an alcohol droplet spreading on the free surface of saline solution has a spreading radius that increases with decreasing solubility. However, this is not the case at very low solubility, as is the case for high concentrations of Na2SO4, Na2CO3 and Li2SO4 close to salt saturation, as illustrated in figures 9(a) and 9(c). Similarly, the solubility of the 1-butanol, pentanol and 1-hexanol in pure water decreases in the order these alcohols are listed, while the spreading radius also decreases, as shown in figure 14. The material properties of alcohols are listed in table 2.
Appendix D. Fluid physical properties
Tables 1 and 2 listed the physical properties of the saline solutions and of the organic liquids, respectively. Table 3 listed the molar volumes of salt at molten state, and the partial molar volumes of salt and organic liquids.
Density, viscosity and surface tension for different concentrations of salts used in the experiments.

Physical properties of the organic liquids studied in this work (from PubChem).

The partial molar volumes at infinite dilution for different combinations of salts and organic liquids, and the molar volumes of salts at the molten liquid state. Here,
 $\overline{V}_{i}^{0}$
and
 $\overline{V}_{s}^{0}$
represent the partial molar volumes of organic liquid and salt, respectively,
 $\overline{V}_{s}^{0}$
results from the partial molar volumes of ions (Millero Reference Millero1971), and
 $V_{s}$
represents molten salt molar volume, which is calculated based on the molten salt density (Janz et al. Reference Janz, Dampier, Lakshminarayanan, Lorenz and Tomkins1968).