INTRODUCTION
Perennial ryegrass (Lolium perenne L.) is a cross-pollinated species, therefore breeding results in a heterogeneous population of differing phenotypes, with each seed being a unique genotype (Brock & Thomas Reference Brock and Thomas1991). In order for a perennial ryegrass cultivar to be commercially marketed it must be shown to be distinct, uniform and stable (DUS). This means that every cultivar must be proven to be distinguishable from all other cultivars in ‘common knowledge’ (UPOV 2014). In the European Union (EU) this is normally defined as those cultivars already registered on the EU common catalogue (European Commission 2014). The candidate cultivar must also be uniform in its essential morphological characteristics (Grogan & Gilliland Reference Grogan and Gilliland2011). The standard for uniformity is set in comparison with existing stable cultivars and so a uniform cultivar is not a collection of identical individuals but comprises individuals within a limited range of expression, across the characteristics examined within the DUS test. The objective of DUS trials is to ensure that a candidate cultivar is a single inter-crossing population of similar morphological types, so that it can be reproduced true to type. This, by implication, also validates the third ‘stability’ requirement.
Although the DUS system ensures that cultivars are stable during seed production, it is not known whether they are also stable during years of utilization as a growing sward. It has been shown that perennial ryegrass cultivar populations can have significant genetic differences in intra-population diversity (Guthridge et al. Reference Guthridge, Dupal, Kölliker, Jones, Smith and Forster2001). The question therefore arises whether inter-plant competition is sufficient to result in a differential survival across the range of morphological and physiological characteristics in ‘uniform’ cultivars. Given that the performance of a cultivar can decline over time under any sward management, it is clear that some change within the sown cultivar population must occur. Stresses such as defoliation and treading along with management factors such as nutrient availability, defoliation frequency and defoliation intensity have the potential to favour certain plant phenotypes. Hazard & Ghesquière (Reference Hazard and Ghesquière1997), in a mixed perennial ryegrass sward, noted a shift towards larger-leaved genotypes over smaller-leaved genotypes under infrequent defoliation. Charles (Reference Charles1970) observed that as a sward ages, the genetic variance of the remaining population will reduce from that present at the initial sowing, while McNeilly & Roose (Reference McNeilly and Roose1984) found only 10% of the plants sown survived after 10 years.
Cultivar population adaption to a particular environment or defoliation regime could, in theory, result in genetic differentiation within cultivars. If selection does occur following sowing, understanding the adaptive process and its impact on important agronomic characteristics of forage grasses is essential to ensure sown species continue to demonstrate their desirable characteristics. It is unclear if population differentiation occurs within ryegrass cultivars and if it does, whether it involves a directional change as a result of selection pressure or simply a chance effect due to a random loss of genotypes. Brock & Thomas (Reference Brock and Thomas1991) hypothesized that weaker genotypes could be out-competed by stronger genotypes within a perennial ryegrass sward. Although Easton et al. (Reference Easton, Stewart, Kerr and Mercer2011) recognized the potential for natural selection to shift the mean characteristics within a perennial ryegrass cultivar population, they found little evidence of this effect. Nonetheless, the possibility remains, at least in theory, for selection to occur within a single cultivar of a perennial ryegrass. Furthermore this could potentially adapt it to the environment or management in which it is established. This could be a contributing factor to the conclusion by Charles (Reference Charles1973), that there is no biologically prohibiting reason why swards established from a persistent perennial ryegrass cultivar could not maintain full production indefinitely under a suitable management, assuming the optimum environmental conditions are present (e.g., nutrients, water and temperature). There is some evidence of this from previous studies into the composition of swards sown as mixtures of either different species or different cultivars. Hazard & Ghesquière (Reference Hazard and Ghesquière1995) demonstrated that in ryegrass cultivar mixtures, competition for light caused domination of long-leaved cultivars under infrequent cutting (IC) while under frequent cutting (FC) a change towards shorter leaves occurred, though at a much slower pace. This suggests that the direction of change of phenotypes can be influenced by the management to which a plant is exposed. Similarly, Briske et al. (Reference Briske, Boutton and Wang1996) concluded that a prostrate growth habit allowed prairie grasses to avoid grazing, which was the mechanism that aided their survival compared with erect plants that were likely to be more severely grazed by animals. This creates the possibility for selection to occur within a grazed sward in favour of these plants and create a detectable shift in the plant population phenotype over time, compared with swards that were cut.
While the above evidence proves that selective changes do occur in swards where the level of diversity spans across species or between ryegrass cultivars, there have been fewer studies showing similar responses when the degree of diversity was only within a ryegrass cultivar. Hazard et al. (Reference Hazard, Barker and Easton2001) found that space plants (i.e. isolated plants sown at 0·75 m row spaces) taken from a rotational grazed sward of the cultivar Grassland Nui had a more erect growth habit and fewer tillers compared with space plants established from seed. Similarly, Gardner (Reference Gardner1960) reported a later time of ear emergence in a sward of the cultivar S23 rotationally grazed for 11 years compared with a new seed of S23, when genotypes were examined as space plants. This is consistent with the observations by Hazard et al. (Reference Hazard, Betin and Molinari2006) who reported that intensive grazing favours short and ‘late-heading’ plants. Furthermore, Charles (Reference Charles1970) also found some evidence suggesting that competitive pressures within swards may be selecting plants within a cultivar, due to their production capability. He reported that the population from the most productive grazed ley of S23 was also most productive when reproduced and grown as space plants. The survivor populations had higher or lower yield and reduced variance in yield within populations when compared with breeder's seed sown as space plants. Furthermore, Charles (Reference Charles1973) also found that S23 plants sampled from a sward given 1000 kg N/ha annually had 35% higher yield than plants derived from a sward given 500 kg N/ha annually, when grown under the same spaced plant conditions. This also suggests that directional selection might be possible, as it appears that the higher nitrogen application caused a differential population shift to genotypes with a higher DM yield capability when compared under the same conditions as space plants. These findings have been further substantiated by Pike et al. (Reference Pike, McNeilly and Putwain1979), who found increasing proportions of leaf relative to stem when S23 space plants from older zero-grazed swards were compared with those from seed. Interestingly, the same trend was not replicated in space plants taken from set-stocked swards. Zero grazing is the mechanical defoliation and collection of grass; normally the sward is allowed to achieve canopy closure before complete defoliation. Set stocking is the constant grazing of swards by animals; these swards have no recovery period during the grazing season.
Previous studies have only examined small numbers of cultivars, with a limited number of phenotypic characters measured. Understanding which genotypes can persist in a managed sward may be beneficial to understanding the changes in agronomic performance as a sward ages. If genotypes with a lower yield potential persist under certain conditions, this may reduce the yield potential of that sward. Lee et al. (Reference Lee, Matthew, Thom and Chapman2012) noted that there was an urgent need for systematic, scientific information on changes in population biology, the genetic structure of the sown population and plant phenotypes to understand in what way sown swards change over time. The objective of the current study was to investigate if perennial ryegrass populations managed under frequent or IC management demonstrate genetic differentiation and if change does occur, to define the direction and magnitude of this change.
MATERIALS AND METHODS
Experimental design and layout
An experiment was conducted at the Animal and Grassland Research and Innovation centre, Teagasc Moorepark, Fermoy, Co. Cork, Ireland (52°16′N; 8°26′W, 50 m a.s.l.). The soil type was a free-draining acid brown earth of sandy loam-to-loam texture. Average rainfall at the site was 1050 mm. Twelve cultivars were investigated, comprising four diploids (D) and eight tetraploids (T) with differing heading dates: Alto (D; 15 May), Arrow (D; 22 May), Bealey (T; 22 May), Dunloy (T; 8 June), Dunluce (T; 31 May), Glencar (T, 6 June), Greengold (T; 31 May), Lismore (T; 28 May), Malone (T; 22 May), Navan (T; 9 June), Portrush (D; 14 June) and Tyrella (D; 8 June). All cultivars were endophyte free.
Plots were sown in autumn 2006. Each plot was 5 × 1·5 m (7·5 m2). The plots were mechanically defoliated using a motor Agria to a height of 4 cm (Etesia UK Ltd., Warwick, UK) from 2007 to 2011, inclusive. Two defoliation managements were applied separately to all 12 cultivars: FC and IC. All plots were arranged in a single randomized complete block design with three replicates. All 24 treatments were randomized within each block.
The FC management consisted of ten defoliations each year, representing a rotationally grazed sward, beginning on the 20 March and then every 3–4 weeks until final harvest in late October. The IC management consisted of five defoliations, with the first taken on 25 May and the second and third cuts taken at 6-week intervals with the final two cuts at the start of September and October. All plots in their respective management were defoliated on the same date. Nitrogen fertilizer was applied at a total annual rate of 315 and 305 kg N/ha for the FC (ten applications – January–September) and IC managements (six applications – February–September), respectively. Soil pH, P and K levels were maintained at optimum soil fertility indexes in accordance with annual soil fertility tests.
In September 2011, 35 perennial ryegrass tillers were extracted randomly from each of the plots for every cultivar, creating a total of 105 tillers for each cultivar from each sward management treatment. Sampling was sufficiently widely distributed across each plot to ensure that a plant could only be sampled once, while avoiding the boundary areas. Each tiller was then planted in a multi-pot tray (modules: depth 6 cm, diameter 3 cm). At the same time, plants of each cultivar were also established from seed into separate multi-pot trays. This created two aged accessions and one control (seed) accession for each of the 12 test cultivars. Seed was acquired from the official UK germplasm reference seedbank. Plants were housed in a glasshouse over winter before the trays were moved outside in March 2012. Tillers were cut to a height of 3 cm with shears each month and fertilized to maintain healthy plants and encourage tillering. In August 2012, a ley area was ploughed and cultivated. A random selection of 80 plants from each accession was planted in a complete randomized block design. The experimental unit was one row of ten plants with eight blocks included in the complete randomized block design. Each plant was spaced 0·75 m from each of the plants surrounding it. The residual plants were used to create a surround of non-experimental guard plants around the perimeter of the experiment to negate boundary effects on plants used for measurement.
Plant measurements
Plants were subjected to a number of phenotypic measurements, the majority of which are described in the UK National List (NL) DUS testing protocol (FERA 2014), and for those that are not reported by FERA (2014), i.e. ‘not a UK NL characteristic’ a description is provided in the following list of all characters examined.
Nine phenotypic measurements were recorded during the vegetative period in April 2013, recorded after vernalization but before any reproductive growth had occurred:
-
(1) Spring growth habit (visual estimation of angle of growth scale 1–9 where 1 = prostrate, 9 = erect);
-
(2) Tiller density (not a UK NL characteristic: visual estimation of tiller density scale 1–9, where 1 = few tillers, 9 = many tillers);
-
(3) Spring natural height (mm) (undisturbed plant height after vernalization);
-
(4) Spring width (mm) (undisturbed plant width after vernalization);
-
(5) Spring height (mm) (plant height after vernalization with the tillers of each plant fully extended);
-
(6) Vegetative development (spring height minus spring natural height);
-
(7) Vegetative growth habit (spring height divided by spring width);
-
(8) Vegetative attitude (spring height divided by spring natural height);
-
(9) Vegetative shape (spring natural height divided by spring width).
During the reproductive period a further 11 measurements were recorded across the plants. For these characters the plants were observed for ear emergence on each Monday, Wednesday and Friday, beginning on 1 May. A plant was deemed to have ‘headed’ when three ears had visibly emerged beyond the ligule. At this point in time the following characters were recorded on that plant:
-
(10) Timing of inflorescence;
-
(11) Emergence natural height (mm) (undisturbed plant height at inflorescence emergence);
-
(12) Emergence width (mm) (undisturbed plant width at inflorescence emergence);
-
(13) Flag leaf length (mm);
-
(14) Flag leaf width (mm);
-
(15) Vigour (not a UK NL characteristic: visual assessment of plant condition, colour, turgor, etc. scale 0–9, where 0 = dead plant, 9 = high vigour);
-
(16) Flag leaf size (√ (flag leaf length × flag leaf width)), where √ denotes square root;
-
(17) Flag leaf length/width ratio (flag leaf length divided by flag leaf width);
-
(18) Emergence growth habit (emergence natural height divided by emergence width);
-
(19) Plant seasonal width (√ (emergence width × spring width));
-
(20) Plant volume (√(emergence width × emergence natural height)).
The final phenotypic measurements were recorded 30 days after the mean time of inflorescence emergence for the experimental unit of ten space plants. These measurements were:
-
(21) Length of longest stem (mm) (length of longest tiller in each plant from the base to the tip of the terminal spikelet);
-
(22) Stem diameter (mm) (not a UK NL characteristic: measured on the longest tiller as the diameter at its base using a micrometre (Quick-mini Series 700, Mitutoyo, U.S.A.));
-
(23) Inflorescence length (mm) (measured on the longest tiller as length from the basal spikelet to the tip of the terminal spikelet).
Statistical analysis
Analysis was conducted using the DUST program (Weatherup Reference Weatherup1998), with the modules ANAL9, SUMM9 and DUST9 used to analyse the data. The experimental configuration of ten plants in eight blocks for each of the 36 accessions provided a data set of 2880 plants, exceeding the minimum 20 d.f. recommended by UPOV (2012) as necessary for the accurate calculation of mean squares within the analysis of variance and provision of an LSD statistic for each pair comparison, as described in detail by UPOV (2014) using the DUST software package as described by Watson (Reference Watson2012). Overall phenotypic distance between the 36 accessions was also calculated using unweighted pair-group average method (UPGMA), based on the mean values for each character (Kaufman & Rousseeuw Reference Kaufman and Rousseeuw1990).
In all accession pair comparisons, distinction was deemed to have been achieved if there was a significant (P < 0·001) difference in one or more characters. This is the equivalent standard adopted in official DUS tests to establish distinctness between candidate cultivars and existing registered cultivars. Uniformity analysis was performed using the UNIF9 module in the DUST program (Watson Reference Watson2001) using the official DUS data for the test cultivars. This provides a uniformity test on entrant varieties against selected control varieties on the basis of mean standard deviation + t value × standard deviation of the control varieties.
RESULTS
Distinguishing capacity of experimental design
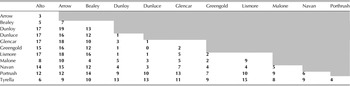
The stringency of the experimental design was determined by assessing whether it could distinguish between the 12 different registered cultivars, represented by plants grown from the official UK germplasm reference seedbank (seed). Table 1 presents the number of characters which were distinct between each seed accession pair. The level of discrimination varied greatly across the 66 pair comparisons. The pair with the highest number of distinguishing characters was Dunloy v. Arrow, with 18 of the 23 characters being significantly different (P < 0·001). In contrast, only one character was distinct between the seed accessions of five accession pairs for example Glencar and Dunluce. Only Greengold and Dunluce had no distinguishing characters and hence could not be separated. This result confirmed that the experimental design provided a highly discriminating means of identifying morphological differences between these cultivars. It was therefore concluded that the methodology was a suitable tool for investigating whether morphological changes had occurred in the aged accessions compared with their original seed.
Number of characters distinct between each seed accessions (P < 0·001)

Uniformity of seed accessions
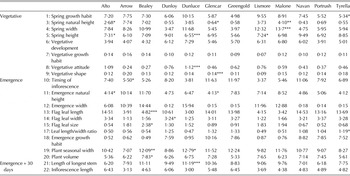
In order to further validate the experimentation, the reference seed accessions were also examined for uniformity (Table 2). This was to establish if the cultivars differed in their range of expression in any of the morphological characteristics, prior to any ageing treatments. This analysis was performed on the official DUS characters since these were the characters that would have established each cultivar as a uniform entity. Three cultivars (Greengold, Navan and Portrush) had no significant differences, indicating that the range of expression in all the characteristics was within expected levels for these 12 cultivars. A further five cultivars displayed a small significant difference (P < 0·05) in one or more characters (one each for Arrow, Dunloy and Lismore, two for Tyrella and three for Alto), which indicated a slightly wider range of expression in these characters. The remaining four cultivars did display a substantially wider expression for certain characters. Glencar had a significantly wider distribution in vegetative shape in spring (P < 0·001), (as well as P < 0·05 differences in two other characters). Bealey and Malone also had a character significance at P < 0·01 for flag leaf width and plant width, (with one other P < 0·05 difference). Dunluce had three characters with differences at the P < 0·01 level (spring width, length of longest stem and vegetative attitude), making it the cultivar with the greatest diversity of expression in these characters.
s.d. of cultivar for a number of DUS characteristics, with significant variation from the standard controls of DUS trial for uniformity indicated

The symbols denote a wider state of expression compared with the control cultivars set out in the DUS protocol at a probability level of *P < 0·05, **P < 0·01, ***P < 0·001.
Character numbers correspond with description in materials and methods.
Values are s.d. from the mean distribution of all control cultivars.
Character differences within seed and aged accessions
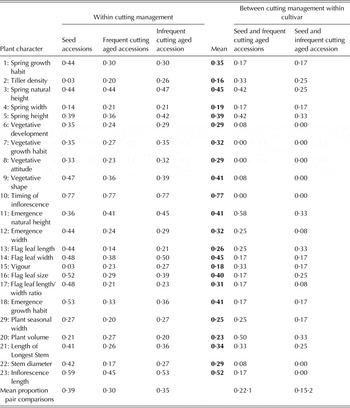
Table 3 presents the proportion of pairs which were separated by each character within the seed accessions and within each of the two aged accessions. Overall, the most discriminating character was timing of inflorescence and the least was tiller density, with every character achieving some pair distinctions. There were a higher proportion of successful distinctions between the seed accessions compared with either of the two aged accession sets, with FC accessions having the lowest proportion of significant distinctions. For the comparisons between seed accessions the timing of inflorescence and inflorescence length were the most distinguishing characters between seed accessions with 0·77 and 0·59 of the total pairs separated, respectively. In contrast, tiller density and vigour created the least number of distinctions with 0·03 of pairs separated by both, while plant volume also had relatively poor distinguishing power, only separating 0·21 of the total pairs. A similar pattern was observed in the aged accessions, whereby timing of inflorescence also distinguished 0·77 of accessions within both FC and IC. Inflorescence length distinguished 0·45 and 0·53 within accessions of FC and IC, respectively. Flag leaf length and stem diameter were the least distinguishing characters within the FC accessions, responsible for 0·14 and 0·17 of the pairs separated. Plant volume was the least useful character when distinguishing between the IC accessions, separating only 0·20 of the total pairs.
Proportion of pairwise comparisons that were judged to be statistically significant (P < 0·001) for 66 comparisons within managements or 12 comparisons between managements and within cultivars for each plant character

Character differences between seed and aged accessions
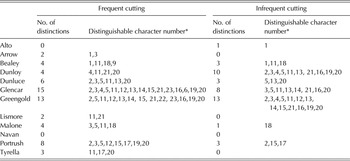
Significant differences (P < 0·001) in individual characters were recorded between seed and at least one of the aged accessions for all cultivars except Navan (Table 4). Among the remaining 11 cultivars, seven were distinct from their seed accession in both aged accessions with the remaining four cultivars being different from their seed accession in only one aged accession. In some comparisons this distinction only involved one character but in other comparisons, multiple character differences were observed. Navan gave a different pattern of results, as although there were no character distinctions between the seed accession and either aged accession, these two aged accessions did differ in emergence width, vigour, length of the longest stem, plant seasonal width and plant volume characters. This was possible because the FC and IC accessions had mean values that were greater and lower than the seed accession.

Differences in the discriminating power of the characters was also evident in how many times they distinguished seed from aged accessions, as summarized in Table 3. Within the FC treatment, ten accessions were distinct from their respective seed accessions, with Alto and Navan being the exceptions (Table 4). Glencar and Greengold had the greatest number of characters for which their FC accession differed significantly from their seed accessions (15 and 13 characters, respectively). Emergence, natural height and plant volume were the most modified characters between FC accessions and their seed equivalents, with 0.58 and 0.50 of pairs separated, respectively. Timing of inflorescence, vegetative growth habit and vegetative attitude did not distinguish any pairs between FC and seed accessions.
Within the IC treatment, eight accessions were distinct from their respective seed accessions with only Arrow, Lismore, Navan and Tyrella not distinct (Table 4). Glencar and Dunloy had the greatest number of distinctions between their IC and seed accessions (13 and eight characters, respectively). Spring height, emergence natural height, flag leaf length and plant volume were the most distinguishing characters, all separating 0.33 of the IC accessions from their respective seed accessions. In contrast, timing of inflorescence, stem diameter, inflorescence length, vegetative development, vegetative growth habit, vegetative attitude and vegetative shape all failed to achieve any distinctions between IC and seed accessions. Interestingly, timing of inflorescence, vegetative growth habit and vegetative attitude were not successful in distinguishing between seed and either of the aged accessions.
Differences between frequent cutting and infrequent cutting accessions
Four cultivars produced aged FC and IC accessions that could be distinguished from each other. Glencar aged accessions were distinguished by six characters, Navan aged accessions were distinguished by five characters, while Lismore and Malone both had one distinct character between FC and IC accessions. Glencar, Lismore and Navan all showed distinctness between FC and IC accessions for length of longest stem, with all three FC accessions having a shorter stem than the IC accessions. Malone had an earlier timing of inflorescence (by 5 days) under FC than IC.
Direction and magnitude of change
The evidence of changes to the mean values for most of the measured characters in the aged accession raises a further question of what type of changes have occurred. For clarity and simplicity this has been grouped into vegetative characters and reproductive characters.
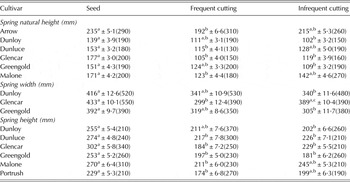
For vegetative characters, all aged accessions that showed distinction from the seed accessions in spring natural height also had a reduced mean height. Arrow was the only FC accession that showed a change in mean spring natural height compared with the seed accession that did not show a decrease in range (Table 5). Only Glencar showed a reduced mean natural spring height response in both management treatments. Similarly for spring width, Glencar showed a significant (P < 0·001) mean decline between the seed accession and the IC accession, with the range also declining, while Dunloy and Greengold showed a significant mean decline (P < 0·001) between the seed and IC accessions, also with a declining range. Five FC accessions, Dunluce, Glencar, Greengold, Malone and Portrush, showed a significant decline (P < 0·001) in spring height compared with their respective seed accession, while four IC accessions, Dunloy, Dunluce, Glencar and Greengold, showed a significant (P < 0·001) decline from their respective seed accession. Of the accessions that showed significant decline, all showed a decreased range compared with the seed accession except for the FC accession of Dunluce and Portrush and the IC accession of Dunloy which showed an increase in range compared with the seed accessions. The IC accession of Greengold exhibited no change in range in spring height.
Mean, s.e. and range between largest and smallest value recorded (in parenthesis) of cultivars which showed a significant change between seed and aged accessions during the vegetative period for three different traits

a,b,c Means within row with different superscripts differ P < 0·001.
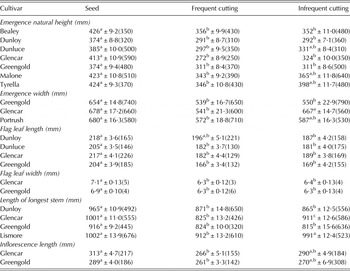
In the reproductive measurements, seven cultivars showed a significant decline (P < 0·001) in the mean emergence natural height between seed and FC accessions, with five showing a decreased range and only Bealey and Tyrella showing an increased range (Table 6). Between the seed and IC accessions four accessions showed a significant decline in emergence natural height (Bealey, Dunloy, Glencar and Greengold), with Glencar showing a decline in the range compared with the seed accession and the other three cultivars showing an increase. Emergence width showed a significant decline (P < 0·001) for three of the FC accessions, Greengold, Glencar, Portrush, compared with the respective seed accessions. The IC accession of Greengold showed a significant decline (P < 0·001) in mean emergence width compared with the seed accessions but an increase in range. Three FC accessions, Dunluce, Glencar and Greengold, showed a significant decline in flag leaf length compared with the seed accessions, with a reduction in range. Mean flag leaf length was also significantly shorter (P < 0·001) for the IC compared with the seed accessions for Dunloy, Dunluce, Glencar and Greengold, with a smaller range in all IC accessions except Dunluce when compared with the seed accessions. Glencar and Greengold both had a significantly shorter (P < 0·001) mean inflorescence length and smaller range between the seed and FC accessions.
Mean, s.e. and range between largest and smallest value recorded (in parenthesis) of cultivars which showed a significant change between seed and aged accessions during the reproductive period for six different traits

a,b,c Means within row with different superscripts differ P < 0·001.
All significant differences (P < 0·001) between FC and IC accessions within a cultivar resulted in a smaller mean for FC compared with the respective IC accession. The exception was of timing of inflorescence for Malone, with the FC accession having a 5 day later (P < 0·001) timing of inflorescence compared with infrequent cutting.
Phenotypic distance
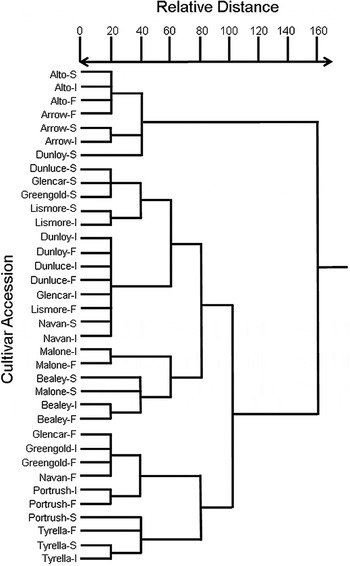
In order to gain an understanding of the overall change in plant morphology that was occurring between the aged accessions and their seed controls, a distance analysis was performed using all the plant character data for all 36 accessions. This produced the dendrogram shown in Fig. 1. The results show a tendency for different cultivars to react in different ways. All three accessions of Alto clustered together within a relative distance of 20, whereas Glencar had all three accessions in separate clusters with relative distances of 60 units between seed and FC and 100 units between seed and IC. Of the remaining ten triplets, all had a separation distance of at least 40 units between two of the three accessions. The most frequent separation was between the seed accession and both aged accessions with the most extreme example being Dunloy, where the aged accessions were only 20 units apart but they were detached from their seed accession by 160 units. This was not a ubiquitous response as the seed accessions of Arrow, Lismore, Navan and Tyrella were more closely clustered to their IC accession, with the FC accession clustering separately. In 11 of the 12 triplets, the FC accession was always clustered separately from the seed accession and often in closer association with the IC accession. The overall pattern was that the IC-treated accessions tended to be more distant from the original seed accessions than were the FC-treated accessions, but the degree of this separation differed between cultivars with Alto having the smallest and Glencar the largest separation between its triplet accessions.
Dendrogram showing relative distances between accessions based on the total differences across 23 plant morphological characters, using the UPGMA analysis. Accessions denoted as ‘s’ seed, ‘F’ Frequent cutting and ‘I’ Infrequent cutting.

DISCUSSION
As expected, the results show that each perennial ryegrass cultivar was comprised of plants that differed across a range of expressions for each plant character examined. Although it is known that there is a large change in the number of surviving plants post-establishment, which is ongoing as the sward is utilized over time (Brock & Thomas Reference Brock and Thomas1991), it is not known if this process involves random survival or possibly selective survival of plants based on their morphology.
Seed accessions
In official DUS tests, all registered cultivars should be distinct when examined over 2–3 years using different sets of 60 plants each year. Given that all but one of the 66 comparisons between the seed accessions of the 12 registered cultivars were found to be distinct, it was clear that the experimental design of one comparison year on 80 plants achieved an equivalent level of discriminating power with the exception of one pair comparison. It was also notable that the New Zealand-bred cultivars, Alto, Arrow and Bealey, were more distinct from the other nine European-bred cultivars than they were from each other and that the degree of discrimination between cultivars within each of these geographical groupings was lower in most pair comparisons.
As all 12 cultivars were officially registered, each should be sufficiently uniform to function as a single randomly interbreeding population, during seed production. Once established in swards, however, the greater the differences between plants then greater potential must exist for selective survival, assuming that characteristics contribute to plant fitness in the sward. In this context, the uniformity examination revealed that some cultivars comprised plants with a significantly wider spread in the expression of certain characters than others, and so this is where the potential for selective change may be greatest. As it is known from official DUS trials that differences at the P < 0·05 are difficult to repeat when re-examined in a separate year with a new seed sample, the recorded dis-uniformities at this level of significance may be of little importance when considering the effects of the sward ageing treatments on character expression. While the repeatability of difference at P < 0·01 indicates a wider distribution than normal and repeatability would be expected to be proportionately better, differences at P < 0·001 are a strong indicator for a wider distribution for that characteristic, which may then present a greater opportunity for adaptive change in expression when the sward ageing treatments were applied.
Differences between seed and aged accessions
In line with official DUS testing, the most distinguishing characters were timing of inflorescence and inflorescence length. The discriminating power of the emergence character was consistently high in all three accession types (seed, frequent and infrequent). In contrast, flag leaf length had a much greater discriminating power within the seed accessions compared with the aged ones, whereas tiller density and vigour had poor discriminating power among the seed accessions but provided much better discrimination of the aged accessions. These latter two characters are not official DUS test characters and on this evidence there would be little benefit in adopting either into the DUS protocol. They do however appear to represent some aspect of growth that is associated with plant fitness in managed swards, as there appears to have been a selective shift in these characters between the seed and aged accessions that has created the difference in discrimination success. Furthermore, to summarize the responses across all the characters, there was good evidence that directional plant selection did occur in the aged swards as ten of the 12 seed accessions differed from their FC accessions and eight differed from their IC accessions. These differences involved a shift in the mean population value of individual characters with ageing and provide evidence to support the hypothesis of Easton et al. (Reference Easton, Stewart, Kerr and Mercer2011) for selective fitness pressures within swards.
It is unlikely, however, that individual characters will function in isolation to determine a plant's fitness as it is much more likely that fitness will be determined as an accumulated effect of the plants entire morphology. Evidence for this came from the distance analysis that revealed the separation of accessions based on their overall difference across all 23 characters. The magnitude of the separation between different accessions of a cultivar is indicatory of the extent of overall selection that had occurred within each of the two sward management treatments.
More significant distinctions were seen between the FC and seed accessions than the IC and seed accessions. This indicates that FC induced a greater selective pressure compared with the IC treatment. This was not a ubiquitous response as, for example, a greater number of character distinctions were recorded under IC management for Dunloy. This indicates that cultivars may adapt differently to specific managements and would be consistent with the management specific performance profiles of cultivars, such as reported in recommended list publications (Gilliland & Meehan Reference Gilliland and Meehan2014). As previous research studies have largely only investigated differential selection over time in a maximum of two cultivars (Charles Reference Charles1970; Pike et al. Reference Pike, McNeilly and Putwain1979; Hazard et al. Reference Hazard, Betin and Molinari2006), most probably due to the high workload requirement, this new evidence of cultivars reacting differently to management based on their morphology is an important insight. Given the high labour requirement to excise tillers from swards, establish them as space plants and conduct full morphological measurements, it is unlikely this methodology will be a practical technique for plant breeders who seek to generate and assess vast numbers of candidate cultivars in their breeding programmes.
The most discriminating character when seed accessions of the cultivars were compared was not the most discriminating character when the seed accessions were compared with their aged equivalents. All measures of plant magnitude were strongly distinguishing between seed and aged accessions, including height, length, width and volume. Surprisingly, timing of inflorescence, which is known to be the strongest distinguishing character when examining seed accessions (Gilliland & Gensollen Reference Gilliland, Gensollen and Huyghe2010), and was again so in the current study, did not separate any of the seed and aged pairs. This suggests that plant maturity differences within a cultivar are either not a key selective factor or are not sufficiently diverse to act as an important fitness differential between plants. This is somewhat contrary to the view taken by Hazard et al. (Reference Hazard, Betin and Molinari2006), who commented that based on their observations, heading date could be negatively exposed to selective pressure as, following an early inflorescence emergence, the growing point is exposed to defoliation for a longer period of time, causing frequently defoliated populations to have a later average inflorescence emergence. As before this was not a ubiquitous response as, for example, the FC accession of Malone had a significantly later timing of inflorescence than its IC accession. While this supports the observation of Hazard et al. (Reference Hazard, Betin and Molinari2006) that earlier genotypes in the FC accession may have been disadvantaged by the frequent spring defoliation which the IC accession was not exposed to, Malone had one of the smaller ranges in time of inflorescence emergence among the 12 cultivars. So as discussed previously, there may be a more complex mechanism underlying this observation, possibly involving a combination of morphological characters. This could also explain the different observations between the current study and that of Hazard et al. (Reference Hazard, Betin and Molinari2006), who examined a different cultivar.
The Malone observation opens a question regarding the importance of the size of the range of expression for any character within a cultivar. It could be expected that where plant fitness is driven by individual morphological characters, then the greater the range between plants the greater the change that would be expected to occur between seed and aged accession. Interestingly, it was noted that the cultivar Glencar had a significantly wider range than other cultivars (dis-uniformity) in a number of characters and also showed a large number of phenotypic changes between seed and both aged accessions. The current evidence does not, however, provide any evidence to support a minimum range for selective change to occur as, for example, Greengold had no seed accession dis-uniformities but still displayed a large number of phenotypic changes between the seed and aged accessions. Taking an overview of the 12 cultivars, there was no detectable link between the level of uniformity of a character in the seed accession and the degree of difference observed between seed and aged accessions for individual characters. Here again, a more complex interaction between morphological characters is indicated. Therefore, the phenotypic range within individual characters of a cultivar does not appear to be an effective means to predict the extent to which it will undergo directional selection over time in a managed sward.
Direction and magnitude of change
The observation that every character that was distinct between the seed and aged accessions also had a smaller mean for the aged accession indicates that some consistent selection mechanism may be operating. For example, the observed reduction in plant height could indicate that shorter genotypes were able to avoid more of the defoliation pressure than taller ones. This would be consistent with the observations of Anderson & Briske (Reference Anderson and Briske1995). Similarly, Hazard et al. (Reference Hazard, Betin and Molinari2006) found that the surviving population of the cultivar Clerpin, after intensive grazing by sheep for 3 years, had a reduced vegetative plant height compared with the original seed population. If smaller plants were less severely defoliated and retained a greater proportion of their biomass after defoliation they could gain an advantage by having a faster regrowth compared with taller plants. This response has been reported previously by Lee et al. (Reference Lee, Donaghy, Sathish and Roche2009). Furthermore, as demonstrated by Fulkerson & Donaghy (Reference Fulkerson and Donaghy2001), smaller plants need not mean lower sward yield as increased tiller density can be compensatory. So a directional change in which shorter plants with higher densities were fittest would be an example of morphological characteristics being co-selected. In contrast however, plant volume was also reduced in many of the aged accessions which, according to Charles (Reference Charles1970), could be a causal effect in the reduced yield of swards over time. As emergence natural height is linked positively with plant volume and negatively with tiller density, complex selection interaction may be occurring. There may be opposing selection factors influencing emergence natural height which could, for example, explain some of the different responses for individual cultivars, depending on the plant volume to tiller density combination of their constituent plants.
The corollary to this is that infrequent defoliation could be expected to favour plants with a larger plant size due to their competitive ability to capture light. Hazard & Ghesquière (Reference Hazard and Ghesquière1997) found that infrequent defoliation resulted in a yield advantage for larger-leaved genotypes over smaller-leaved genotypes while frequent defoliation resulted in a yield advantage for smaller-leaved genotypes. However, both aged accessions showed a similar magnitude of change in flag leaf length and width, suggesting that this was not a selective mechanism in the current study. Clearly it is wrong to simply attempt to entirely attribute all changes in the plant population solely to morphological dependant selection. There may be important physiological responses to management that affect plant fitness that were not measured in the current experiment, such as their ability to adapt to more frequent defoliation by speeding up their accumulation of water soluble carbohydrates, as hypothesized by Lee et al. (Reference Lee, Donaghy, Sathish and Roche2009). Similarly, plant plasticity has been identified as a factor that might reduce the magnitude of morphological differences (Paenke et al. Reference Paenke, Sendhoff and Kawecki2007). Furthermore, a number of cultivars did not show a population shift between seed and aged combinations. These accessions remained stable under the imposed defoliation management suggesting that some plant populations are more robust and less subject to directional selection than others. This resilience may be management specific as three accessions were significantly different to their original seed accession after the FC treatment but not after the IC treatment.
CONCLUSION
The underlying assumption of the current study is that although the morphological structure of FC and IC swards are different, most obviously in residual heights and plant density, if tillers are removed and grown as individual space plants they should express their full genetically determined morphology and be directly comparable with plants generated from their original seed population. Differences between the seed plants and those extracted from swards must therefore reveal that selection in favour of a particular morphological ideotype has taken place, as was observed in the current study. The alternative hypothesis that the surviving plants would simply be the most productive ones is not well supported by the study. This is because high yielding plants would be expected to be larger in many aspects of their growth, such as height, length and width etc. In fact the opposite was observed as the aged accessions showed a decreased mean in comparison with their seed progenitors.
The current study does not exclude physiological aspects to plant fitness within swards as, for example, the speed of regrowth following defoliation is an obvious candidate for competitive advantage that may not be associated with plant morphology. Nonetheless, it has shown that there is differential survival of plants based on their morphological characteristics after sowing and that it is associated with the management of the sward over time. It has not provided a clear understanding of the processes involved, partly as not all cultivars reacted in a similar way and also because it is impossible to ascertain the contribution of each character to the overall plant fitness in each management system. For example more character distinctions where observed between the FC and seed accessions, than between seed and IC accessions. When an overall distance analysis was applied, the FC accessions often clustered further from their seed progenitor than the IC accession.
Much remains to be understood regarding the reported morphological changes, not least whether similar morphological changes occur within cultivars when grazed and how differences in management, environment and edaphic factors might modify responses. The potential benefits of a better understanding are considerable as the mechanisms underpinning morphological plant fitness may help breeders identify elite phenotypes for their breeding programmes. Alternatively, the trend in selection for smaller phenotypes that was observed may be a contributor to the progressive decline in productivity of swards over time. Whether this can lead to the creation of cultivars that can remain agronomically stable and true to their original type within a given sward management, will require much further investigation.
The authors wish to acknowledge the technical assistance of M. Feeney, A. McGrath, P. O'Connor, J.P. Murphy and S. Fallon.